
UNITED STATES
SECURITIES AND EXCHANGE COMMISSION
Washington, D.C. 20549
FORM 20-F
(Mark One)
¨ REGISTRATION STATEMENT PURSUANT TO SECTION 12(b) OR (g) OF THE SECURITIES EXCHANGE ACT OF 1934
OR
x ANNUAL REPORT PURSUANT TO SECTION 13 OR 15(d) OF THE SECURITIES EXCHANGE ACT OF 1934
For the fiscal year ended 31 March 2016
OR
¨ TRANSITION REPORT PURSUANT TO SECTION 13 OR 15(d) OF THE SECURITIES EXCHANGE ACT OF 1934
OR
¨ SHELL COMPANY REPORT PURSUANT TO SECTION 13 OR 15(d) OF THE SECURITIES EXCHANGE ACT OF 1934
Date of event requiring this shell company report
For the transition period from to
Commission file number 1-15240
JAMES HARDIE INDUSTRIES plc
(Exact name of Registrant as specified in its charter)
N/A
(Translation of Registrant’s name into English)
Ireland
(Jurisdiction of incorporation or organization)
Europa House, Second Floor
Harcourt Centre
Harcourt Street, Dublin 2, Ireland
(Address of principal executive offices)
Natasha Mercer
Corporate Secretary
(Contact name)
353 1411 6924 (Telephone) 353 1479 1128 (Facsimile)
Securities registered or to be registered pursuant to Section 12(b) of the Act:
|
Title of each class: |
Name of each exchange on which registered: | |
| Common stock, represented by CHESS Units of Foreign Securities |
New York Stock Exchange* | |
| CHESS Units of Foreign Securities |
New York Stock Exchange* | |
| American Depositary Shares, each representing one unit of CHESS Units of Foreign Securities | New York Stock Exchange |
| * | Listed, not for trading, but only in connection with the registered American Depositary Shares, pursuant to the requirements of the Securities and Exchange Commission |
Securities registered or to be registered pursuant to Section 12(g) of the Act.
None
Securities for which there is a reporting obligation pursuant to Section 15(d) of the Act.
None
Indicate the number of outstanding shares of each of the issuer’s classes of capital or common stock as of the close of the period covered by the Annual Report:
445,579,351 shares of common stock at 31 March 2016
Indicate by check mark if the registrant is a well-known seasoned issuer, as defined in Rule 405 of the Securities Act. x Yes ¨ No
If this report is an annual or transition report, indicate by check mark if the registrant is not required to file reports pursuant to Section 13 or 15(d) of the Securities Exchange Act of 1934. ¨ Yes x No
Note — Checking the box will not relieve any registrant required to file reports pursuant to Section 13 or 15(d) of the Securities Exchange Act of 1934 from their obligations under those Sections.
Indicate by check mark whether the registrant (1) has filed all reports required to be filed by Section 13 or 15(d) of the Securities Exchange Act of 1934 during the preceding 12 months (or for such shorter period that the registrant was required to file such reports) and (2) has been subject to such filing requirements for the past 90 days. x Yes ¨ No
Indicate by check mark whether the registrant has submitted electronically and posted on its corporate Web site, if any, every Interactive Data File required to be submitted and posted pursuant to Rule 405 of Regulation S-T (§232.405 of this chapter) during the preceding 12 months (or for such shorter period that the registrant was required to submit and post such files). x Yes ¨ No
Indicate by check mark whether the registrant is a large accelerated filer, an accelerated filer, or a non-accelerated filer. See the definition of “accelerated filer and large accelerated filer” in Rule 12b-2 of the Exchange Act. (Check one):
| Large accelerated filer |
x | |||
| Accelerated filer |
¨ | |||
| Non-accelerated filer |
¨ |
Indicate by check mark which basis of accounting the registrant has used to prepare the financial statements included in this filing:
| US GAAP |
x |
International Financial Reporting Standards as issued by the International Accounting
| Standards Board |
¨ |
| Other |
¨ |
If “Other” has been checked in response to the previous question, indicate by check mark which financial statement item the registrant has elected to follow:
¨ Item 17 ¨ Item 18
If this is an Annual Report, indicate by check mark whether the registrant is a shell company (as defined in Rule 12b-2 of the Exchange Act).
¨ Yes x No
2016
ANNUAL REPORT
ON FORM 20-F

| James Hardie 2016 Annual Report on Form 20-F | i |
| Page(s) | ||||||
| ii | ||||||
| 1 | ||||||
| 1 | ||||||
| 1 | ||||||
| 3 | ||||||
| 3 | ||||||
| 5 | ||||||
| 13 | ||||||
| 14 | ||||||
| 18 | ||||||
| 18 | ||||||
| 23 | ||||||
| 29 | ||||||
| 69 | ||||||
| 89 | ||||||
| 89 | ||||||
| 91 | ||||||
| 118 | ||||||
| 124 | ||||||
| Remuneration of Independent Registered Public Accounting Firm |
169 | |||||
| 170 | ||||||
| 170 | ||||||
| 188 | ||||||
| 190 | ||||||
| 192 | ||||||
| 192 | ||||||
| Purchases of Equity Securities by the Issuer and Affiliated Purchasers |
196 | |||||
| 197 | ||||||
| 206 | ||||||
| 206 | ||||||
| 206 | ||||||
| 216 | ||||||
| 219 | ||||||
| 219 | ||||||
| 222 | ||||||
| 227 | ||||||
| Signatures | 235 |
| James Hardie 2016 Annual Report on Form 20-F | ii |
| Page(s) | ||||||
| PART 1 |
||||||
| Item 1. Identity of Directors, Senior Management and Advisers |
Not applicable | |||||
| Item 2. Offer Statistics and Expected Timetable |
Not applicable | |||||
| Item 3. Key Information |
||||||
| A. Selected Financial Data |
1-3 | |||||
| B. Capitalization and Indebtness |
Not applicable | |||||
| C. Reasons for the Offer and Use of Proceeds |
Not applicable | |||||
| D. Risk Factors |
170-187 | |||||
| Item 4. Information on the Company |
||||||
| A. History and Development of the Company |
3-7; 10-11; 16-17 | |||||
| B. Business Overview |
5-13 | |||||
| C. Organizational Structure |
5; 13 | |||||
| D. Property, Plants and Equipment |
14-17; 115 | |||||
| Item 4A. Unresolved Staff Comments |
None | |||||
| Item 5. Operating and Financial Review and Prospects |
||||||
| A. Operating Results |
96-111 | |||||
| B. Liquidity and Capital Resources |
112-116 | |||||
| C. Research and Development, Patents and Licenses, etc |
11-12 | |||||
| D. Trend Information |
116 | |||||
| E. Off-Balance-Sheet Arrangements |
116 | |||||
| F. Tabular Disclosure of Contractual Obligations |
117 | |||||
| G. Safe Harbor |
89-90 | |||||
| Item 6. Directors, Senior Management and Employees |
||||||
| A. Directors and Senior Management |
18-28 | |||||
| B. Compensation |
29-68 | |||||
| C. Board Practices |
23-28; 69-88 | |||||
| D. Employees |
192 | |||||
| E. Share Ownership |
59-60; 64-68 |
| Item 7. Major Shareholders and Related Party Transactions |
||||||
| A. Major Shareholders |
219-221 | |||||
| B. Related Party Transactions |
79 | |||||
| C. Interests of Experts and Counsel |
None | |||||
| Item 8. Financial Information |
||||||
| A. Consolidated Statements and Other Financial Information |
118-168; 202-203 | |||||
| B. Significant Changes |
None | |||||
| Item 9. The Offer and Listing |
||||||
| A. Offer and Listing Details |
192-195 | |||||
| B. Plan of Distribution |
Not applicable | |||||
| C. Markets |
193-194 | |||||
| D. Selling Shareholders |
Not applicable |
| James Hardie 2016 Annual Report on Form 20-F | iii |
FORM 20-F CROSS REFERENCE (continued)
| Page(s) | ||||
| PART 1 (continued) |
||||
| E. Dilution |
Not applicable | |||||
| F. Expenses of the Issue |
Not applicable | |||||
| Item 10. Additional Information |
||||||
| A. Share Capital |
Not applicable | |||||
| B. Memorandum and Articles of Association |
197-206 | |||||
| C. Material Contracts |
206 | |||||
| D. Exchange Controls |
206 | |||||
| E. Taxation |
206-215 | |||||
| F. Dividends and Paying Agents |
Not applicable | |||||
| G. Statement by Experts |
Not applicable | |||||
| H. Documents on Display |
215 | |||||
| I. Subsidiary Information |
Not applicable | |||||
| Item 11. Quantitative and Qualitative Disclosures About Market Risk |
216-218 |
| Item 12. Description of Securities Other Than Equity Securities |
||||||
| A. Debt Securities |
Not applicable | |||||
| B. Warrants and Rights |
Not applicable | |||||
| C. Other Securities |
Not applicable |
| D. American Depositary Shares |
194-195 |
| PART II |
||||||
| Item 13. Defaults, Dividend Arrearages and Delinquencies |
None | |||||
| Item 14. Material Modifications to the Rights of Security Holders and Use of Proceeds |
None | |||||
| Item 15. Controls and Procedures |
190-191 | |||||
| Item 16A. Audit Committee Financial Expert |
83 | |||||
| Item 16B. Code of Business Conduct and Ethics |
81-82 | |||||
| Item 16C. Principal Accountant Fees and Services |
169 | |||||
| Item 16D. Exemptions from the Listing Standards for Audit Committees |
None | |||||
| Item 16E. Purchases of Equity Securities by the Issuer and Affiliated Purchasers |
196 | |||||
| Item 16F. Change in Registrant’s Certifying Accountant |
None | |||||
| Item 16G. Corporate Governance |
69-88 | |||||
| Item 16H. Mine Safety Disclosures |
15-16 | |||||
| PART III |
||||||
| Item 17. Financial Statements |
Not applicable |
| Item 18. Financial Statements |
118-168 | |||||
| Item 19. Exhibits |
227-234 |
| James Hardie 2016 Annual Report on Form 20-F | 1 |
James Hardie Industries plc is a world leader in the manufacture of fiber cement siding and backerboard. Our products are used in a number of markets, including new residential construction (single and multi-family housing), manufactured housing, repair and remodeling and a variety of commercial and industrial applications. We manufacture numerous types of fiber cement products with a variety of patterned profiles and surface finishes for a range of applications, including external siding and trim and soffit lining, internal linings, facades and floor and tile underlay. Our current primary geographic markets include the United States of America (“US”, “USA” or the “United States”), Canada, Australia, New Zealand, the Philippines and Europe.
James Hardie Industries plc is a “public limited company,” incorporated and existing under the laws of Ireland. Except as the context otherwise may require, references in this Annual Report on Form 20-F (this “Annual Report”) to “James Hardie,” the “James Hardie Group,” the “Company,” “JHI plc,” “we,” “our” or “us” refer to James Hardie Industries plc, together with its direct and indirect wholly owned subsidiaries as of the time relevant to the applicable reference.
For certain information about the basis of preparing the financial information in this Annual Report, see “Section 2 – Reading this Report.” In addition, this Annual Report contains statements that constitute “forward-looking statements.” For an explanation of forward-looking statements and the risks, uncertainties and assumptions to which they are subject, see “Section 2 – Reading this Report.” Further, a “Glossary of Abbreviations and Definitions” has also been included under Section 4 of this Annual Report.
The term “fiscal year” refers to our fiscal year ended 31 March of such year; the term “dollars,” “US$” or “$” refers to US dollars; and the term “A$” refers to Australian dollars. For the exchange rates used to convert Australian dollar denominated amounts into US dollars, see Note 2 to our consolidated financial statements in Section 2.
Information contained in or accessible through the websites mentioned in this Annual Report does not form a part of this Annual Report unless we specifically state that it is incorporated by reference herein. All references in this Annual Report to websites are inactive textual references and are for information only.
We have included in this Annual Report the audited consolidated financial statements of the Company, consisting of our consolidated balance sheets as of 31 March 2016 and 2015, and our consolidated statements of operations and comprehensive income, cash flows for each of the years ended 31 March 2016, 2015 and 2014 and changes in shareholders’ (deficit) equity, together with the related notes thereto. The consolidated financial statements included in this Annual Report have been prepared in accordance with accounting principles generally accepted in the US (“US GAAP”).
| James Hardie 2016 Annual Report on Form 20-F | 2 |
The selected consolidated financial information, summarized below for the five most recent fiscal years has been derived in part from the Company’s consolidated financial statements. You should read the selected consolidated financial information in conjunction with the Company’s consolidated financial statements and related notes contained in “Section 2 – Consolidated Financial Statements” and with the information provided in “Section 2 – Management’s Discussion and Analysis.” Historic financial data is not necessarily indicative of our future results and you should not unduly rely on it.
| (Millions of US dollars) | ||||||||||||||||||||
| Consolidated Statement of Operations Data | 2016 | 2015 | 2014 | 2013 | 2012 | |||||||||||||||
| Net sales |
$ | 1,728.2 | $ | 1,656.9 | $ | 1,493.8 | $ | 1,321.3 | $ | 1,237.5 | ||||||||||
| Income from operations1 |
244.4 | 291.3 | 99.5 | 45.5 | 604.3 | |||||||||||||||
| Net income1 |
$ | 244.4 | $ | 291.3 | $ | 99.5 | $ | 45.5 | $ | 604.3 | ||||||||||
| (Millions of US dollars) | ||||||||||||||||||||
| Consolidated Balance Sheet Data | 2016 | 2015 | 2014 | 2013 | 2012 | |||||||||||||||
| Total assets |
$ | 2,040.4 | $ | 2,044.5 | $ | 2,104.0 | $ | 2,113.2 | $ | 2,310.0 | ||||||||||
| Net assets |
(225.2 | ) | (202.6 | ) | (199.0 | ) | 18.2 | 126.4 | ||||||||||||
| Common stock |
$ | 231.4 | $ | 231.2 | $ | 230.6 | $ | 227.3 | $ | 224.0 | ||||||||||
| (Number) | ||||||||||||||||||||
| Shares | 2016 | 2015 | 2014 | 2013 | 2012 | |||||||||||||||
| Basic weighted average number of common shares |
445.3 | 445.0 | 442.6 | 439.2 | 436.2 | |||||||||||||||
| Diluted weighted average number of common shares |
447.2 | 446.4 | 444.6 | 440.6 | 437.9 | |||||||||||||||
| (US dollar) | ||||||||||||||||||||
| Earnings Per Share | 2016 | 2015 | 2014 | 2013 | 2012 | |||||||||||||||
| Income from operations per common share — basic |
$ | 0.55 | $ | 0.65 | $ | 0.22 | $ | 0.10 | $ | 1.39 | ||||||||||
| Net income per common share — basic |
0.55 | 0.65 | 0.22 | 0.10 | 1.39 | |||||||||||||||
| Income from operations per common share — diluted |
0.55 | 0.65 | 0.22 | 0.10 | 1.38 | |||||||||||||||
| Net income per common share — diluted |
0.55 | 0.65 | 0.22 | 0.10 | 1.38 | |||||||||||||||
| Dividends declared per share |
0.58 | 0.60 | 0.73 | 0.43 | 0.04 | |||||||||||||||
| Dividends paid per share |
$ | 0.58 | $ | 0.88 | $ | 0.45 | $ | 0.43 | $ | 0.04 | ||||||||||
| Other Financial Data | 2016 | 2015 | 2014 | 2013 | 2012 | |||||||||||||||
| Net cash provided by operating activities (Millions of US dollars) |
$ 260.4 | $ 179.5 | $ 322.8 | $ 109.3 | $ 387.2 | |||||||||||||||
| Net cash used in investing activities (Millions of US dollars) |
(66.6 | ) | (277.9 | ) | (118.8 | ) | (59.7 | ) | (49.9 | ) | ||||||||||
| Net cash used in financing activities (Millions of US dollars) |
$ (154.4 | ) | $ (4.6 | ) | $ (186.3 | ) | $ (158.7 | ) | $ (84.4 | ) | ||||||||||
| Volume (million square feet) |
||||||||||||||||||||
| North America and Europe Fiber Cement2 |
2,000.5 | 1,849.7 | 1,696.9 | 1,488.5 | 1,331.8 | |||||||||||||||
| Asia Pacific Fiber Cement3 |
449.6 | 456.2 | 417.2 | 393.7 | 392.3 | |||||||||||||||
| Net Sales (Millions of US dollars) |
||||||||||||||||||||
| North America and Europe Fiber Cement |
$ 1,386.3 | $1,276.5 | $ 1,127.6 | $ 951.4 | $ 862.0 | |||||||||||||||
| Asia Pacific Fiber Cement3 |
$ 341.9 | $ 380.4 | $ 366.2 | $ 369.9 | $ 375.5 | |||||||||||||||
| Average sales price per unit (per thousand square feet) |
||||||||||||||||||||
| North America and Europe Fiber Cement |
US$ 676 | US$ 675 | US$ 652 | US$ 626 | US$ 642 | |||||||||||||||
| Asia Pacific Fiber Cement3 |
A$ 1,020 | A$ 942 | A$ 930 | A$ 901 | A$ 906 | |||||||||||||||
| 1 | Income from operations and net income include the following: asbestos adjustments, Asbestos Injuries Compensation Fund (“AICF”) selling, general and administrative (“SG&A”) expenses, Australian Securities and Investments |
| James Hardie 2016 Annual Report on Form 20-F | 3 |
| Commission (“ASIC”) related (expenses) recoveries, asset impairment charges, non-recurring stamp duty and New Zealand weathertightness claims expenses. Income from operations and net income in fiscal year 2012 includes an income tax benefit of US$485.2 million recognized upon RCI Pty Ltd’s successful appeal of the Australian Taxation Office’s (“ATO”) disputed 1999 amended tax assessment. |
| (Millions of US dollars) | ||||||||||||||||||||
| Other Financial Data | 2016 | 2015 | 2014 | 2013 | 2012 | |||||||||||||||
| Asbestos adjustments benefit (expense) |
5.5 | 33.4 | (195.8 | ) | (117.1 | ) | (15.8 | ) | ||||||||||||
| AICF SG&A expenses |
(1.7 | ) | (2.5 | ) | (2.1 | ) | (1.7 | ) | (2.8 | ) | ||||||||||
| AICF interest (expense) income |
(0.3 | ) | 1.4 | 2.9 | 7.0 | 3.3 | ||||||||||||||
| ASIC related expenses |
- | - | - | (2.6 | ) | (1.1 | ) | |||||||||||||
| Asset impairments |
- | - | - | (16.9 | ) | (14.3 | ) | |||||||||||||
| Non-recurring stamp duty |
- | (4.2 | ) | - | - | - | ||||||||||||||
| New Zealand weathertightness claims4 |
(0.5 | ) | 4.3 | (1.8 | ) | (13.2 | ) | (5.4 | ) | |||||||||||
| For additional information on asbestos adjustments, AICF SG&A expenses, asset impairment charges, non-recurring stamp duty and New Zealand weathertightness, see “Section 2 – Management’s Discussion and Analysis” and Notes 7, 11 and 14 to our consolidated financial statements in Section 2. |
| 2 | During the year ended 31 March 2016, the Company changed the name of its USA and Europe segment to the North America and Europe segment to better reflect the segment’s geographic nature; however, the composition of the segment remained the same. |
| 3 | Asia Pacific Fiber Cement segment includes all fiber cement manufactured in Australia, New Zealand and the Philippines and sold in Australia, New Zealand, Asia, the Middle East and various Pacific Island Nations. |
| 4 | The Company began separately disclosing New Zealand weathertightness claims expense in fiscal year 2013 and did so for fiscal year 2012 for comparative purposes only. |
History and Development of the Company
James Hardie was established in 1888 as an import business, listing on the Australian Securities Exchange (“ASX”) in 1951 to become a publicly owned company in Australia. After becoming a listed company, we built a diverse portfolio of building and industrial products. In the late-1970s, we pioneered the development of asbestos-free fiber cement technology and in the early-1980’s began designing and manufacturing a wide range of fiber cement building products that made use of the benefits that came from the products’ durability, versatility and strength. Using the technical and manufacturing expertise developed in Australia, we expanded into the United States, opening our first fiber cement plant in Fontana, California in February 1990.
In September 2001, in order to maximize the benefit of our strong international growth and in order to generate higher returns for shareholders from the James Hardie Group’s continuing international expansion, the shareholders of James Hardie Industries Limited (“JHIL”), then the ultimate parent company of the James Hardie Group and the vehicle with which our shareholding was listed with the ASX, agreed to exchange their shares for shares in James Hardie Industries N.V. (“JHINV”), a Dutch public limited liability company. JHINV retained its primary listing on the ASX, and in October 2001, to reflect the new corporate structure, JHIL transferred all of its fiber cement businesses to JHINV.
| James Hardie 2016 Annual Report on Form 20-F | 4 |
In February 2010, our legal name was changed to James Hardie Industries SE when our legal form was converted from a Dutch public limited liability company to a Societas Europaea (“SE”), a European public limited liability company. This was the first stage of a two-stage re-domicile proposal to change our registered corporate domicile from the Netherlands to Ireland. On 17 June 2010, we implemented Stage 2 of the re-domicile and changed our registered corporate domicile to Ireland to become an Irish SE, becoming an Irish tax resident on 29 June 2010. On 15 October 2012, we converted from an Irish SE into our current corporate form, an Irish public limited company (“plc”).
We conduct our operations under legislation in various jurisdictions. As an Irish plc, we are governed by the Irish Companies Act 2014 and we operate under the regulatory requirements of numerous jurisdictions and organizations, including the ASX, ASIC, the New York Stock Exchange (“NYSE”), the United States Securities and Exchange Commission (“SEC”), the Irish Takeover Panel and various other rulemaking bodies.
The address of our registered office in Ireland is Europa House, Second Floor, Harcourt Centre, Harcourt Street, Dublin 2, Ireland. The telephone number there is +353 1411 6924. Our agent in the United States is CT Corporation. Its office is located at 111 Eight Avenue – 13th Floor, New York, New York 10011. The address of our registered office in Australia is Level 3, 22 Pitt Street, Sydney NSW 2000 and the telephone number there is +61 2 8845 3360. Our share registry is maintained by Computershare Registry Services Pty Ltd. All enquires and correspondence regarding holdings should be directed to: Computershare Investor Services Pty Ltd, Level 5, 115 Grenfell Street, Adelaide, SA 5000; telephone: +61 3 9415 4000, toll free within Australia: 1 300 855 080 or toll free from the US 1 855 298 3404.
Our Agreement with Asbestos Injuries Compensation Fund
Prior to 1987, ABN 60 Pty Limited (formerly JHIL) (“ABN 60”) and two of its former subsidiaries, Amaca Pty Limited (“Amaca”) and Amaba Pty Limited (“Amaba”) (together the “Former James Hardie Companies”), manufactured products in Australia that contained asbestos. These products have resulted in liabilities for the Former James Hardie Companies in Australia.
In February 2007, our shareholders approved the Amended and Restated Final Funding Agreement (“AFFA”) entered into on 21 November 2006 to provide long-term funding to AICF for the compensation of proven Australian-related personal injuries for which the Former James Hardie Companies are found liable. AICF, an independent trust, subsequently assumed ownership of the Former James Hardie Companies. We do not own AICF, however, we are entitled to appoint three directors, including the Chairman and the New South Wales (“NSW”) Government is entitled to appoint two directors.
Under the terms of the AFFA, subject to the operation of an annual cash flow cap, James Hardie 117 Pty Ltd (the “Performing Subsidiary”) will make annual payments to AICF. The amount of these annual payments is dependent on several factors, including our free cash flow (as defined in the AFFA), actuarial estimations, actual claims paid, operating expenses of AICF, changes in the AUD/USD exchange rate and the annual cash flow cap. JHI plc owns 100% of the Performing Subsidiary and guarantees the Performing Subsidiary’s obligation. As a result, for US GAAP purposes, we consider JHI plc to be the primary beneficiary of AICF.
| James Hardie 2016 Annual Report on Form 20-F | 5 |
Although we have no legal ownership in AICF, for financial reporting purposes, our interest in AICF is considered variable and we consolidate AICF due to our pecuniary and contractual interests in AICF as a result of the funding arrangements outlined in the AFFA. For additional information on our consolidation of AICF and asbestos-related assets and liabilities, see Note 2 to our consolidated financial statements.
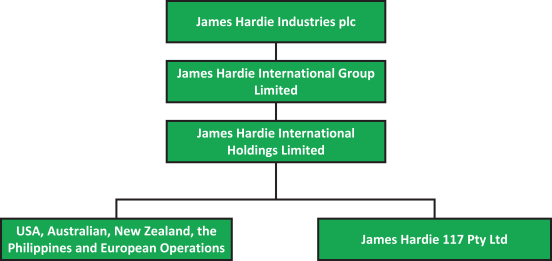
Corporate Structure
The following diagram summarizes our current corporate structure:
General Overview of Our Business
Based on net sales, we believe we are the largest manufacturer of fiber cement products and systems for internal and external building construction applications in the United States, Australia, New Zealand, and the Philippines. We market our fiber cement products and systems under various Hardie brand names, such as HardiePlank®, HardiePanel®, HardieTrim® and HardieBacker® boards, and other brand names such as Artisan® by James Hardie, Cemplank®, Scyon® and HardieLinea®.
The breakdown of our net sales by operating segment for each of our last three fiscal years is as follows:
| (Millions of US dollars) | ||||||||||||
| 2016 | 2015 | 2014 | ||||||||||
| North America and Europe Fiber Cement |
$ | 1,386.3 | $ | 1,276.5 | $ | 1,127.6 | ||||||
| Asia Pacific Fiber Cement |
341.9 | 380.4 | 366.2 | |||||||||
|
Total Net Sales |
$ | 1,728.2 | $ | 1,656.9 | $ | 1,493.8 | ||||||
| James Hardie 2016 Annual Report on Form 20-F | 6 |
Products
We manufacture a wide-range of fiber cement building materials for both internal and external use across a broad range of applications, including: external siding, internal walls, floors, ceilings, soffits, trim, fencing and facades. While there are some market specific products, our core product ranges, being planks, which are used for external siding and flat sheets, are used for internal and external wall linings and floor underlayments and are sold across all of the markets in which we operate.
Products Used in External Applications
We developed a proprietary technology platform that enables us to produce thicker yet lighter-weight fiber cement products that are generally easier to handle than most traditional building products. Further, we believe that our products provide certain performance, design and cost advantages, while offering comparable aesthetics to competing products such as wood and vinyl siding.
Performance and design advantages:
| • | Our fiber cement products exhibit resistance to the damaging effects of moisture, fire, impact and termites compared to natural and engineered wood and wood-based products; |
| • | Competing products do not duplicate fiber cement aesthetics and the characteristics necessary for effectively accepting paint applications; |
| • | Our fiber cement products provide the ability to imprint designs that closely resemble the patterns and profiles of traditional building materials such as wood and stucco; |
| • | The surface properties of our products provide an effective paint-holding finish, especially when compared to natural and engineered wood products, allowing for greater periods of time between necessary maintenance and repainting; and |
| • | Compared to masonry construction, fiber cement is lightweight, physically flexible and can be cut using readily available tools, making our products more appealing across a broad range of architectural styles, be it of timber or steel-framed construction. |
We believe the benefits associated with our fiber cement products have enabled us to gain a competitive advantage over competing products.
Products Used in Internal Applications
Compared to natural and engineered wood and wood-based products, we believe our product range for internal applications provide the same general advantages provided by our products for external applications. In addition, our fiber cement products for internal applications exhibit less movement in response to exposure to moisture and impact damage than many competing products, providing a more consistent and durable substrate on which to install tiles. Further, we believe our ceramic tile underlayment products exhibit better handling and installation characteristics compared to fiberglass mesh cement boards.
Significant New Products
In the United States, new products released over the last three years include HardieReveal2.0™ panel system, James Hardie® Insulated Lap Siding and Trim, HardieTrim® 2x™ board,
| James Hardie 2016 Annual Report on Form 20-F | 7 |
HardieTrim® NT3® Roughsawn board, HardieTrim® Mouldings, Artisan® V-Rustic premium exterior siding, custom colors using our ColorPlus® Technology, and an improved touch-up accessory to support ColorPlus® products.
In Australia and New Zealand, new products released over the last three years include the ARChitectural™ Prefinished panel range for commercial applications, including Invibe® panels with Chromashield® Technology and Inraw® panels. Extensions to the existing Stria® cladding products have been launched to provide Stria® Standard 325mm, Stria® Wide 405mm, and Splayed 255mm cladding profiles. Similarly, Axon® cladding has now been extended to provide Axon® Smooth 133mm, Axon® Smooth 400mm, and Axon® Grained 133mm cladding.
In Australia only, our HardieDeck™ system provided a major new product application launch in 2015. HardieBrace®, a new online calculator tool, offers a way to simplify structural bracing calculations. Modcem® modular flooring has provided an entry into commercial flooring applications. Similarly, Systemboard™ cladding provided a niche multi-story construction product application. Additions to the range of building science offerings include HardieWrap® weather barrier, HardieFire® Insulation, HardieBreak® Thermal Strip, as well as the HardieSmart® Boundary, Aged Care and ZeroLot Wall Systems. Due to an evolution of the market in Australia, the Scyon® range of products has been repositioned under the James Hardie brand as James Hardie® products including Scyon® technology.
In New Zealand only, over the same timeframe, Secura® Interior Flooring, Secura® Exterior Flooring, Axent™ Fascia, HomeRAB® 4.5mm Pre Cladding, HardieGlaze®, Stria® Cladding, Axon® 400 and 133 Grained Cladding, Linea® Oblique™ Cladding and Easy Lap™ Panel have been launched.
In the Philippines, new products released over the past three years include the extension of the established Hardieflex™ board range with the inclusion of Hardieflex™ Wet Area Walls lining and Hardieflex™ Pro products, primarily for wet area application, and HardieFlex® Flooring.
The European business has launched HardieFloor™ Structural Flooring, and has developed an innovative range of products focused on improving acoustic performance of buildings, including HardieFloor dB™ Structural Acoustic Flooring, and HardieQStrip™ Acoustic Batten.
Principal Markets for Our Products
United States, Canada and Europe
In the US and Canada, the largest application for fiber cement building products is in external siding for the residential building industry. The external siding market includes various cladding types, including fiber cement, vinyl, natural wood, engineered wood, brick, stucco and stone. Based on industry estimates, vinyl has the largest share of the US and Canadian siding markets. External siding typically occupies a significant square footage component of the outside of every building. Selection of siding material is based on installed cost, durability, aesthetic appeal, strength, weather resistance, maintenance requirements and cost, insulating properties and other features. Different regions of the US and Canada show a preference amongst siding materials according to economic conditions, weather, materials availability and local preference.
| James Hardie 2016 Annual Report on Form 20-F | 8 |
Demand for siding in the US and Canada fluctuates based on the level of new residential housing starts and the repair and remodeling activity of existing homes. The level of activity is generally a function of interest rates and the availability of financing to homeowners to purchase a new home or make improvements to their existing homes, inflation, household income and wage growth, unemployment levels, demographic trends, gross domestic product growth and consumer confidence. The sale of fiber cement products in the North America accounts for the largest portion of our net sales, accounting for 78%, 75% and 73% of our total net sales in fiscal years 2016, 2015 and 2014, respectively.
In the US and Canada, competition in the external siding market comes primarily from substitute products, such as natural or engineered wood, vinyl, stucco and brick. We believe we can continue to increase our market share from these competing products through targeted marketing programs designed to educate customers on our brand and the performance, design and cost advantages of our products.
In Europe, fiber cement building products are used in both residential and commercial building applications in external siding, internal walls, floors, soffits and roofing. We compete in most segments, except roofing, and promote the use of fiber cement products against traditional masonry, gypsum-based products and wood-based products. Since we commenced selling our products in Europe in fiscal year 2004, we have continued to work to grow demand for our products by building awareness among distributors, builders and contractors. Management believes that the growth outlook for fiber cement in Europe is favorable, in light of stricter insulation requirements driving demand for advanced exterior cladding systems, as well as better building practices increasing the use of fiber cement in interior applications.
Asia Pacific
In the Asia Pacific region, we principally sell into the Australian, New Zealand and Philippines markets, with the residential building industry representing the principal market for fiber cement products. The largest applications of fiber cement across our three primary markets are in external siding, internal walls, ceilings, floors, soffits, fences and facades. We believe the level of activity in this industry is generally a function of interest rates, inflation, household income and wage growth, unemployment levels, demographic trends, gross domestic product growth and consumer confidence. Demand for fiber cement building products is also affected by the level of new housing starts and renovation activity.
In Australia, competition for fiber cement has intensified over the past decade, with two competitors establishing fiber cement manufacturing facilities and competition from imports continuing to grow. Additionally, we continue to see competition from natural and engineered wood, wallboard, masonry and brick products.
In New Zealand, we continue to see competition intensifying as fiber cement imports have become more cost competitive and overseas manufacturers look to supplement their primary operating environments with additional markets.
In the Philippines, we have seen fiber cement gain acceptance across a broader range of product applications in the last decade, leading to additional fiber cement products entering the market,
| James Hardie 2016 Annual Report on Form 20-F | 9 |
along with the increased use of gypsum in fiber cement applications. We see fiber cement having long-term growth potential not only in the Philippines, but across Asia and the Middle East, as the benefits of its light-weight and durability become more widely recognized.
Seasonality
Our businesses are seasonal and typically follow activity levels in the building and construction industry. In the United States, the calendar quarters ending in December and March generally reflect reduced levels of building activity depending on weather conditions. In Australia and New Zealand, the calendar quarter ending in March is usually the quarter most affected by a slowdown due to summer holidays. In the Philippines, construction activity diminishes during the wet season from June through September and during the last half of December due to the slowdown in business activity over the holiday period. Also, general industry patterns can be affected by weather, economic conditions, industrial disputes and other factors. See “Section 3 – Risk Factors.”
Raw Materials
The principal raw materials used in the manufacture of our fiber cement products are cellulose fiber (wood-based pulp), silica (sand), Portland cement and water. We have established supplier relationships for all of our raw materials across the various markets in which we operate and we do not anticipate having difficulty in obtaining our required raw materials from these suppliers. The purchase price of these raw materials and other materials can fluctuate depending on the supply-demand situation at any given point in time.
We work hard to reduce the effect of both price fluctuations and supply interruptions by entering into contracts with qualified suppliers and through continuous internal improvements in both our products and manufacturing processes.
Cellulose Fiber
Reliable access to specialized, consistent quality, low cost pulp is critical to the production of fiber cement building materials. As a result of our many years of experience and expertise in the industry, we share our internal expertise with pulp producers in New Zealand, the United States, Canada and Chile to ensure they are able to provide us with a highly specialized and proprietary formula crucial to the reinforcing cement matrix of our fiber cement products. We have confidentiality agreements with our pulp producers and we have obtained patents in the United States and in certain other countries covering certain unique aspects of our pulping formulas and processes that we believe cannot adequately be protected through confidentiality agreements. However, we cannot be assured that our intellectual property and other proprietary information will be protected in all cases. See “Section 3 – Risk Factors.”
Silica
High purity silica is sourced locally by the various production plants. In the majority of locations, we use silica sand as a silica source. In certain other locations, however, we process quartz rock and beneficiate silica sand to ensure the quality and consistency of this key raw material.
| James Hardie 2016 Annual Report on Form 20-F | 10 |
Cement
Cement is acquired in bulk from local suppliers. We continue to evaluate options on agreements with suppliers for the purchase of cement that can lock in our cement prices over longer periods of time.
Water
We use local water supplies and seek to process all wastewater to comply with environmental requirements.
Sales, Marketing and Distribution
The principal markets for our fiber cement products are the United States, Australia, New Zealand, the Philippines, Canada, and in parts of Europe, including the United Kingdom and France. In addition, we have sold fiber cement products in many other markets, including China, Mongolia, Denmark, Germany, Hong Kong, India, the Middle East (Israel, Saudi Arabia, Lebanon and the United Arab Emirates), various Pacific Islands, Singapore, South Korea, Taiwan, and Vietnam. Our brand name, customer education in comparative product advantages, differentiated product range and customer service, including technical advice and assistance, provide the basis for our marketing strategy.
We offer our customers support through a specialized fiber cement sales force and customer service infrastructure in the United States, Australia, New Zealand, the Philippines and Europe. The customer service infrastructure includes inbound customer service support coordinated nationally in each country, and is complemented by outbound telemarketing capability. Within each regional market, we provide sales and marketing support to building products dealers and lumber yards and also provide support directly to the customers of these distribution channels, principally homebuilders and building contractors.
We maintain dedicated regional sales management teams in our major sales territories, with our national sales managers and national account managers, together with regional sales managers and sales representatives, maintaining relationships with national and other major accounts. Our various sales forces, which in some instances manage specific product categories, include skilled trades people who provide on-site technical advice and assistance.
In the United States, we sell fiber cement products for new residential construction predominantly to distributors, which then sell these products to dealers or lumber yards. This two-step distribution process is supplemented with direct sales to dealers and lumber yards as a means of accelerating product penetration and sales. Repair and remodel products in the United States are typically sold through the large home center retailers and specialist distributors. Our products are distributed across the United States and Canada primarily by road and, to a lesser extent, by rail.
In Australia and New Zealand, both new construction and repair and remodel products are generally sold directly to distributor/hardware stores and lumber yards rather than through the two-step distribution process. In the Philippines, a network of thousands of small to medium size dealer outlets sell our fiber cement products to consumers, builders and real estate developers,
| James Hardie 2016 Annual Report on Form 20-F | 11 |
although in recent years, do-it-yourself type stores have started to enter the Philippines market. The physical distribution of our product in each country is primarily by road or sea transport. Products manufactured in Australia, New Zealand and the Philippines are also exported to a number of markets in Asia, various Pacific Islands, and the Middle East by sea transport.
Despite the fact that distributors and dealers are generally our direct customers, we also aim to increase primary demand for our products by marketing our products directly to homeowners, architects and builders. We encourage them to specify and install our products because of the quality and craftsmanship of our products. This “pull through” strategy, in turn, assists us in expanding sales for our distribution network as distributors benefit from the increasing demand for our products.
Geographic expansion of our fiber cement business has occurred in markets where framed construction is prevalent for residential applications or where there are opportunities to change building practices from masonry to framed construction. Expansion is also possible where there are direct substitution opportunities irrespective of the methods of construction. Our entry into the Philippines is an example of the ability to substitute fiber cement for an alternative product (in this case plywood). With the exception of our current major markets, as well as Japan and certain rural areas in Asia, Scandinavia, and Eastern Europe, most markets in the world principally utilize masonry construction for external walls in residential construction. Accordingly, further geographic expansion depends substantially on our ability to provide alternative construction solutions and for those solutions to be accepted in those markets.
Dependence on Trade Secrets and Research and Development (“R&D”)
We pioneered the successful development of cellulose reinforced fiber cement and, since the early-1980s, have progressively introduced products developed as a result of our proprietary product formulation and process technology. The introduction of differentiated products is one of the core components of our global business strategy. This product differentiation strategy is supported by our significant investment in research and development activities.
We view spending on research and development as the key to sustaining our existing product leadership position, by providing a continuous pipeline of innovative new products and technologies with sustainable performance and design advantages over our competitors. Further, through our investments in new process technology or by modifying existing process technology, we aim to keep reducing our capital and operating costs and to find new ways to make existing and new products. As such, we expect to continue allocating significant funding to these endeavors. For fiscal years 2016, 2015 and 2014, our expenses for R&D were US$29.5 million, US$31.7 million and US$33.1 million, respectively.
Our current patent portfolio is based mainly on fiber cement compositions, associated manufacturing processes and the resulting products. Our non-patented technical intellectual property consists primarily of our operating and manufacturing know-how and raw material and operating equipment specifications, all of which are maintained as trade secret information. We have enhanced our abilities to effectively create, manage and utilize our intellectual property and have implemented a strategy that increasingly uses patenting, licensing, trade secret protection and joint development to protect and increase our competitive advantage.
| James Hardie 2016 Annual Report on Form 20-F | 12 |
In addition, we own a variety of licenses; industrial, commercial and financial contracts; and manufacturing processes. While we are dependent on the competitive advantage that these items provide as a whole, we are is not dependent on any one of them individually and do not consider any one of them individually to be material. We do not materially rely on intellectual property licensed from any outside third parties. However, we cannot assure that our intellectual property and other proprietary information will be protected in all cases. In addition, if our research and development efforts fail to generate new, innovative products or processes, our overall profit margins may decrease and demand for our products may fall. See “Section 3 – Risk Factors.”
Governmental Regulation
As an Irish plc, we are governed by the Irish Companies Act 2014 and are also subject to all applicable European Union level legislation. We also operate under the regulatory requirements of numerous jurisdictions and organizations, including the ASX, ASIC, the NYSE, the SEC, the Irish Takeover Panel and various other federal, state, local and foreign rulemaking bodies. See “Section 3 – Constitution” for additional information regarding the Irish Companies Act 2014 and regulations to which we are subject.
Environmental, Health and Safety Regulation
Our operations and properties are subject to extensive federal, state, local and foreign environmental protection, health and safety laws, regulations and ordinances governing activities and operations that may have adverse environmental effects. As it relates to our operations, our manufacturing plants produce regulated materials, including waste water and air emissions. The waste water produced from our manufacturing plants is internally recycled and reused before eventually being discharged to publicly owned treatment works, a process which is monitored by us, as well as by regulators. In addition, we actively monitor air emissions and other regulated materials produced by our plants so as to ensure compliance with the various environmental regulations under which we operate.
Some environmental laws provide that a current or previous owner or operator of real property may be liable for the costs of investigation, removal or remediation of certain regulated materials on, under, or in that property or other impacted properties. In addition, persons who arrange, or are deemed to have arranged, for the disposal or treatment of certain regulated materials may also be liable for the costs of investigation, removal or remediation of the regulated materials at the disposal or treatment site, regardless of whether the affected site is owned or operated by such person. Environmental laws often impose liability whether or not the owner, operator, transporter or arranger knew of, or was responsible for, the presence of such regulated materials. Also, third parties may make claims against owners or operators of properties for personal injuries, property damage and/or for clean-up associated with releases of certain regulated materials pursuant to applicable environmental laws and common law tort theories, including strict liability.
In the past, from time to time, we have received notices of alleged discharges in excess of our water and air permit limits. In each case, and in compliance with our Environmental Policy, we have addressed the concerns raised in those notices, in part, through capital expenditures intended to prevent future discharges in excess of permitted levels and, on occasion, the payment of associated minor fines.
| James Hardie 2016 Annual Report on Form 20-F | 13 |
Environmental compliance costs in the future will depend, in part, on continued oversight of operations, expansion of operations and manufacturing activities, regulatory developments and future requirements that cannot presently be predicted.
JHI plc is incorporated and domiciled in Ireland and the table below sets forth our significant subsidiaries, all of which are wholly-owned by JHI plc, either directly or indirectly, as of 30 April 2016.
| Name of Company |
Jurisdiction of |
Jurisdiction of | ||
| James Hardie 117 Pty Ltd |
Australia | Australia | ||
| James Hardie Australia Pty Ltd |
Australia | Australia | ||
| James Hardie Building Products Inc. |
United States | United States | ||
| James Hardie Europe B.V. |
Netherlands | Netherlands | ||
| James Hardie Finance Holdings 1 Ltd |
Bermuda | Ireland | ||
| James Hardie Holdings Ltd |
Ireland | Ireland | ||
| James Hardie International Finance Ltd |
Ireland | Ireland | ||
| James Hardie International Group Ltd |
Ireland | Ireland | ||
| James Hardie International Holdings Ltd |
Ireland | Ireland | ||
| James Hardie New Zealand |
New Zealand | New Zealand | ||
| James Hardie NZ Holdings |
New Zealand | New Zealand | ||
| James Hardie North America Inc. |
United States | United States | ||
| James Hardie Philippines Inc. |
Philippines | Philippines | ||
| James Hardie Technology Ltd |
Bermuda | Ireland | ||
| James Hardie U.S. Investments Sierra Inc. |
United States | United States | ||
| RCI Holdings Pty Ltd |
Australia | Australia |
| James Hardie 2016 Annual Report on Form 20-F | 14 |
Property, Plants and Equipment
We believe we have some of the largest and lowest cost fiber cement manufacturing plants across the United States, Australia and New Zealand, with our plants servicing both domestic and export markets. Our plants are ideally located to take advantage of established transportation networks, allowing us to distribute our products into key markets, while also providing easy access to key raw materials.
Manufacturing Capacity
At 31 March 2016, we had manufacturing facilities at the following locations:
| 1 | The calculated annual design capacity is based on management’s historical experience with our production process and is calculated assuming continuous operation, 24 hours per day, seven days per week, producing 5/16” medium density product at a targeted operating speed. No accepted industry standard exists for the calculation of our fiber cement manufacturing facility design and utilization capacities. |
| 2 | Estimated commission in fiscal year 2019. |
| 3 | Estimated commission in fiscal year 2017. |
| 4 | The lease for our Waxahachie location expires on 31 March 2020, at which time we have an option to purchase the facility. |
| 5 | We suspended production at our Summerville, South Carolina location in November 2008. At the time of this Annual Report, no decision has been made on the future of the Summerville location although we anticipate starting production at this location in the future. |
| 6 | In December 2014, we completed the purchase of the land and buildings previously leased at our Rosehill, New South Wales facility. |
| 7 | We exercised our option to renew the Auckland leases for a further term of 10 years prior to the leases’ expiry on 22 March 2016. The Auckland leases now expire on 22 March 2026, at which time we have an option to renew them for a further term of 10 years expiring in March 2036. There is no option to purchase at the expiration of the leases. |
| James Hardie 2016 Annual Report on Form 20-F | 15 |
| 8 | The land on which our Philippines fiber cement plant is located is owned by Ajempa Holding Inc. (“Ajempa”), a related party. Ajempa is 40% owned by our operating entity, James Hardie Philippines Inc., and 60% owned by the James Hardie Philippines Retirement Fund. James Hardie Philippines Inc. owns 100% of the fixed assets on the land owned by Ajempa. |
Prior to the fourth quarter of fiscal year 2016, we disclosed an annual flat sheet design capacity based on operation of the machines for 24 hours per day, seven days per week, producing 5/16” medium density product at an optimal operating speed. However, beginning in the fourth quarter of fiscal year 2016, management determined that for measuring the annual flat sheet design capacity of the fiber cement network, the calculation should incorporate our historical experience with certain factors such as demand, product mix of varying thickness and density, batch size, plant availability and differing production speeds multiplied by 24 hours per day, seven days per week.
Based on the revised methodology noted above, for the year ended 31 March 2016, we had an annual flat sheet design capacity of 3,005 mmsf and 625 mmsf in the United States and Asia Pacific, respectively. It is important to note that annual design capacity does not necessarily reflect the actual capacity utilization rates of our manufacturing facilities, with actual utilization affected by factors such as demand, product mix, batch size, plant availability and production speeds. For fiscal year 2016, actual capacity utilization across our plants was an average of 70% and 73% in the United States and Asia Pacific, respectively.
Based on the revised methodology noted above, for the year ended 31 March 2015, we had an annual flat sheet design capacity of 3,041 mmsf and 559 mmsf in the United States and Asia Pacific, respectively. It is important to note that annual design capacity does not necessarily reflect the actual capacity utilization rates of our manufacturing facilities, with actual utilization affected by factors such as demand, product mix, batch size, plant availability and production speeds. For fiscal 2015, actual capacity utilization across our plants was an average of 72% and 83% in the United States and Asia Pacific, respectively.
During the first quarter of fiscal year 2016, we completed the sale of our Blandon, Pennsylvania location and our Australian Pipes business.
Mines
We lease silica quartz mine sites in Tacoma, Washington, Reno, Nevada and Victorville, California. The lease for our quartz mine in Tacoma, Washington expires in February 2018 (with options to renew). The lease for our silica quartz mine site in Reno, Nevada expires in January 2019. The lease for our silica mine site in Victorville, California expires on 31 May 2016. Further, we own rights to an additional property in Victorville, California. As of 30 April 2016, however, we have not begun to mine this site.
As a mine operator, we are required by Section 1503(a) of the Dodd-Frank Wall Street Reform and Consumer Protection Act (the “Dodd-Frank Act”), and rules promulgated by the SEC implementing that section of the Dodd-Frank Act, to provide certain information concerning mine safety violations and other regulatory matters concerning the operation of our mines. During fiscal year 2016, we did not receive any notices, citations, orders, legal action or other communication from the US Department of Labor’s Mine Safety and Health Administration that would necessitate
| James Hardie 2016 Annual Report on Form 20-F | 16 |
additional disclosure under Section 1503(a) of the Dodd-Frank Act. Similarly, we have not experienced any mining-related fatalities in our mining operations. There are currently no pending legal actions before the Federal Mine Safety and Health Review Commission related to our mining operations.
Capital Expenditures
We utilize a mix of operating cash flow and debt facilities to fund our capital expenditure projects and investments. We continuously invest in equipment maintenance and upgrades to ensure continued environmental compliance and operating effectiveness of our plants. The following table sets forth our capital expenditures for the three most recent fiscal years:
| (Millions of US dollars) | ||||||||||||
| 2016 | 2015 | 2014 | ||||||||||
| North America and Europe Fiber Cement |
$ | 42.8 | $ | 165.3 | $ | 72.4 | ||||||
| Asia Pacific Fiber Cement |
28.5 | 94.4 | 40.7 | |||||||||
|
R&D and Corporate |
1.9 | 16.5 | 2.3 | |||||||||
|
Total Capital Expenditure |
$ | 73.2 | $ | 276.2 | $ | 115.4 | ||||||
Significant active capital expenditures
At 31 March 2016, the following significant capital expenditure projects remain in progress:
| Project Description | Approximate Investment (US millions) |
Investment to date (US millions) |
Project Start Date |
Expected Commission Date |
Expected Capacity Increase1 |
|||||||||
| Plant City - 4th sheet machine |
$ | 70.5 | $ | 68.8 | Q4 FY14 | FY17 | 9% | |||||||
| Cleburne - 3rd sheet machine |
$ | 37.0 | $ | 35.7 | Q4 FY14 | FY19 | 6% | |||||||
| 1 | The expected capacity increase is based on management’s historical experience with our production process and is calculated assuming continuous operation, 24 hours per day, seven days per week, producing 5/16” medium density product at a targeted operating speed. It does not take into account factors such as product mix with varying thickness and density, batch size, plant availability and production speeds. |
Significant completed capital expenditure projects
Following is a list of significant capital expenditure projects we have invested in over the three most recent fiscal years:
| Project Description | Total Investment (US Millions) |
Fiscal Year of Expenditure | ||||
| Carole Park land and building purchase and capacity expansion |
$ | 85.3 | FY14 - FY16 | |||
| Plant City - 4th sheet machine |
$ | 68.8 | FY14 - FY16 | |||
| Fontana Plant re-commisioning |
$ | 49.0 | FY13 - FY15 | |||
| Rosehill land and buildings |
$ | 37.5 | FY15 | |||
| Cleburne - 3rd sheet machine |
$ | 35.7 | FY14 - FY16 | |||
| Tacoma land and buildings |
$ | 28.3 | FY15 | |||
| James Hardie 2016 Annual Report on Form 20-F | 17 |
Capital Divestitures
During the three most recent fiscal years, we did not make any material capital divestitures. On 30 June 2015, we finalized the sale of our Australian Pipes business. Additionally, on 1 June 2015 we finalized the sale of our Blandon, Pennsylvania location. We do not consider the disposition of the pipes business or sale of Blandon, Pennsylvania location material divestitures or strategic shifts in the nature of our operations.
| James Hardie 2016 Annual Report on Form 20-F | 18 |
DIRECTORS, SENIOR MANAGEMENT AND EMPLOYEES
Our management is overseen by our executive team, whose members cover the key areas of fiber cement research and development, production, manufacturing, investor relations, finance and legal.
Members of our executive team at 30 April 2016 (in alphabetical order) are:
Joe Blasko BSFS, JD
General Counsel and Chief Compliance Officer
Age 49
|
|
Joe Blasko joined James Hardie as General Counsel and Chief Compliance Officer in June 2011.
Before joining James Hardie, Mr Blasko was Assistant General Counsel, and later, the General Counsel at Liebert Corporation, an Emerson Network Power Systems company and wholly-owned subsidiary of Emerson Electric Co. In his four years with Liebert/Emerson, Mr Blasko was responsible for establishing the legal department in Columbus, Ohio, managing and overseeing all legal matters and working closely with the executive management team. In this role, Mr Blasko also had global responsibilities which required expertise across multiple jurisdictions. |
From 2004 to 2006, Mr Blasko was Associate General Counsel at The Scotts Miracle-Gro Company, serving as the effective “general counsel” to numerous corporate divisions within the organization. From 1997 to 2004, Mr Blasko gained considerable regulatory and litigation expertise working at Vorys, Sater, Seymour and Pease LLP in Ohio.
Mr Blasko has a Juris Doctor from Case Western Reserve University in Cleveland, Ohio, USA and a Bachelor of Science in Foreign Service from Georgetown University, USA, with a specialty in International Relations, Law and Organizations.
| James Hardie 2016 Annual Report on Form 20-F | 19 |
Mark Fisher BSc, MBA
Executive Vice President – International
Age 45
|
|
Mark Fisher joined James Hardie in 1993 as a Production Engineer. Since then, he has worked for the Company as Finishing Manager, Production Manager and Product Manager at various locations; Sales and Marketing Manager; and as General Manager of our Europe Fiber Cement business. Mr Fisher was appointed Vice President — Specialty Products in November 2004, then Vice President — Research & Development in December 2005. In February 2008, his role was expanded to cover Engineering & Process Development. |
In January 2010, he was appointed Executive General Manager – International, responsible for the Company’s non-US businesses in Australia, New Zealand, Philippines and Europe and the Company’s windows business. Effective 16 October 2015, Mr Fisher’s title became Executive Vice President – International. Mr Fisher continues to be responsible for international fiber cement operations, as well as, the Company’s non-fiber cement business development activities. He continues to report to the Company’s Chief Executive Officer (“CEO”), Mr Louis Gries.
Mr Fisher has a Bachelor of Science in Mechanical Engineering and an MBA from University of Southern California, USA.
Louis Gries BSc, MBA
Chief Executive Officer
Age 62
|
|
Louis Gries joined James Hardie as Manager of the Fontana fiber cement plant in California in February 1991 and was appointed President of James Hardie Building Products, Inc. in December 1993. Mr Gries became Executive Vice President — Operations in January 2003, responsible for operations, sales and marketing in our businesses in the Americas, Asia Pacific and Europe.
He was appointed Interim CEO in October 2004 and became CEO in February 2005. |
In April 2012, the Company announced that effective June 2012, Mr Gries would again assume responsibility for managing the US business. Effective 16 October 2015, responsibility for managing the Company’s Fiber cement operations in North America transitioned to Mr Ryan Sullivan and oversight of corporate responsibilities to Mr Matthew Marsh. As a result of this transition, Mr Gries is now focused on driving market demand growth for the Company’s fiber cement products and the continued creation of long-term shareholder value.
Before he joined James Hardie, Mr Gries worked for 13 years for USG Corp, including a variety of roles in research, plant quality and production, and product and plant management.
Mr Gries has a Bachelor of Science in Mathematics from the University of Illinois, USA and an MBA from California State University, Long Beach, USA.
| James Hardie 2016 Annual Report on Form 20-F | 20 |
Matthew Marsh BA, MBA
Chief Financial Officer and Executive Vice President – Corporate
Age 41
|
|
Matthew Marsh joined James Hardie as Chief Financial Officer (“CFO”) in June 2013. As CFO he oversees the Company’s overall financial activities, including accounting, tax, treasury, performance and competitor analysis, internal audit and financial operations.
Effective 16 October 2015, Mr Marsh’s role was expanded to include the role of Executive Vice President—Corporate. In this role, Mr Marsh continues his
oversight of the Company’s overall financial management in addition to the oversight of | |
| James Hardie’s global human resources, information systems, legal and compliance, and investor and media relations functions. He continues to report to the Company’s Chief Executive Officer, Mr Louis Gries. | ||
After a 16-year career at General Electric Company (“GE”), Mr Marsh brings a strong background in financial management. Before joining James Hardie, Mr Marsh most recently served as CFO of GE Healthcare’s IT business. Prior to being named CFO of GE Healthcare IT, Mr Marsh oversaw the finance operations for GE Healthcare’s US Healthcare Systems and US Diagnostic Imaging businesses.
Prior to those appointments, Mr Marsh travelled globally with the GE Internal Audit Staff gaining extensive experience in several industries including appliances, information services, distribution and supply, aviation, plastics, financial services, capital markets and healthcare, across more than twenty countries. Mr Marsh has graduated from GE’s Financial Management Program (FMP).
Mr Marsh has a Bachelor of Arts in Economics and Public Affairs from Syracuse University, USA and an MBA from University of Chicago’s Booth School of Business, USA.
| James Hardie 2016 Annual Report on Form 20-F | 21 |
Sean O’Sullivan BA, MBA, Fellow AIRA
Vice President — Investor & Media Relations
Age 50
|
|
Sean O’Sullivan joined James Hardie as Vice President — Investor & Media Relations in December 2008. For the eight years prior to joining James Hardie, Mr O’Sullivan was Head of Investor Relations at St. George Bank, where he established and led the investor relations function.
Mr O’Sullivan’s background includes thirteen years as a fund manager for GIO Asset Management, responsible for domestic and global investments. During this
period, he spent time on secondment with a McKinsey and Co. taskforce that | |
| completed a major study into the Australian financial services industry. Mr O’Sullivan’s final position at GIO was General Manager of Diversified Investments where his responsibilities included determining the asset allocation for over A$10 billion in funds under management. After leaving GIO, Mr O’Sullivan worked for Westpac Banking Corporation in funds management sales. | ||
In November 2014, Mr O’Sullivan was inducted as a Fellow of the Australasian Investor Relations Association (AIRA).
Mr O’Sullivan has a Bachelor of Arts in Economics from Sydney University, Australia and an MBA from Macquarie Graduate School of Management, Australia.
| James Hardie 2016 Annual Report on Form 20-F | 22 |
Ryan Sullivan BSc, MS, MBA
Executive Vice President and President – James Hardie Building Products
Age 42
|
|
Ryan Sullivan joined James Hardie in 2004 as the ColorPlus Manufacturing Manager. Since then, he has worked for the Company as Director of Global R&D and Engineering Services and Director of North America Supply Chain. In 2012, he became Director of the ColorPlus Business Unit, with product line responsibility for the North American ColorPlus business. In 2013, he was appointed as Executive General Manager of the Southern Division with full P&L responsibility.
Effective 16 October 2015, Mr Sullivan was promoted to the position of Executive |
Vice President and President — James Hardie Building Products. In this role, Mr Sullivan is responsible for the daily management of James Hardie Building Products’ fiber cement operations in North America, including manufacturing, supply chain and engineering operations, R&D and product development, and sales and marketing. He continues to report to the Company’s Chief Executive Officer, Mr Louis Gries.
Before joining James Hardie, Mr Sullivan was a senior manager at Marconi Communications where he held numerous positions and had global responsibility. He has also worked in the fields of nuclear power and advanced robotics.
Mr Sullivan has a Bachelor of Science in Mechanical Engineering with a minor in Engineering Design from Carnegie Mellon University, USA, a Masters of Science in Electrical Engineering from the University of Pittsburgh, USA and an MBA from the University of Pittsburgh Katz School, USA.
| James Hardie 2016 Annual Report on Form 20-F | 23 |
James Hardie’s directors have widespread experience, spanning general management, finance, law, marketing and accounting. Each director also brings valuable international experience that assists with James Hardie’s growth.
Members of the Board of Directors (the “Board”) at 31 March 2016 are:
Michael Hammes BS, MBA
Age 74
|
|
Michael Hammes was elected as an independent non-executive director of James Hardie in February 2007. He was appointed Chairman of the Board in January 2008 and is a member of the Audit Committee, the Remuneration Committee and the Nominating and Governance Committee.
Experience: Mr Hammes has extensive commercial experience at a senior executive level. He has held a number of executive positions in the medical products,
hardware and home improvement, and automobile sectors, including CEO and Chairman of |
Sunrise Medical, Inc. (2000-2007), Chairman and CEO of Guide Corporation (1998-2000), Chairman and CEO of Coleman Company, Inc. (1993-1997), Vice Chairman of Black & Decker Corporation (1992-1993) and various senior executive roles with Chrysler Corporation (1986-1990) and Ford Motor Company (1979-1986).
Directorships of listed companies in the past five years: Current – Director of Navistar International Corporation (since 1996); Director of DynaVox Mayer-Johnson (listed in April 2010).
Other: Resident of the United States.
Last elected: August 2014
Term expires: August 2016
| James Hardie 2016 Annual Report on Form 20-F | 24 |
Donald McGauchie AO
Age 66
|
|
Donald McGauchie joined James Hardie as an independent non-executive director in August 2003 and was appointed Acting Deputy Chairman in February 2007 and Deputy Chairman in April 2007. He is a member of the Nominating and Governance Committee.
Experience: Mr McGauchie has wide commercial experience within the food processing, commodity trading, finance and telecommunication sectors. He also has
extensive public policy experience, having previously held several high-level |
advisory positions to the Australian Government.
Directorships of listed companies in the past five years: Current – Chairman (since 2010) and Director (since 2010) of Australian Agricultural Company Limited; Chairman (since 2010) and Director (since 2003) of Nufarm Limited; Director of GrainCorp Limited (since 2009).
Other directorships: Chairman of Australian Wool Testing Authority (since 2005) and Director (since 1999); Former Director of The Reserve Bank of Australia (2001-2011)
Other: Resident of Australia.
Last elected: August 2013
Term expires: August 2016
Brian Anderson BS, MBA, CPA
Age 65
|
|
Brian Anderson was appointed as an independent non-executive director of James Hardie in December 2006. He is Chairman of the Audit Committee and a member of the Remuneration Committee.
Experience: Mr Anderson has extensive financial
and business experience at both executive and board levels. He has held a variety of senior positions, with thirteen years at Baxter International, Inc., including Corporate Vice President of Finance, Senior Vice President and CFO (1997-2004) and,
more recently, Executive Vice |
President and CFO of OfficeMax, Inc. (2004-2005). Earlier in his career, Mr Anderson was an Audit Partner of Deloitte & Touche LLP (1986-1991).
Directorships of listed companies in the past five years: Current – Chairman (since 2010) and Director (since 2005) of A.M. Castle & Co.; Director of PulteGroup (since 2005); Director of W.W. Grainger, Inc. (since 1999). Former – Lead Director of W.W. Grainger, Inc. (2011-2014).
Other: Resident of the United States.
Last elected: August 2015
Term expires: August 2018
| James Hardie 2016 Annual Report on Form 20-F | 25 |
Russell Chenu BCom, MBA
Age 66
|
|
Russell Chenu was appointed as a non-executive director of James Hardie in August 2014. He is a member of the Remuneration Committee and the Nominating and Governance Committee.
Experience: Mr Chenu joined James Hardie as
Interim CFO in October 2004 and was appointed CFO in February 2005. He was elected to the Company’s Managing Board at the 2005 Annual General Meeting, re-elected in 2008 and continued as a member of the Managing Board until it was dissolved in
June 2010. As CFO, he |
was responsible for accounting, treasury, taxation, corporate finance, information technology and systems, and procurement. Mr Chenu retired as CFO in November 2013.
Mr Chenu is an experienced corporate and finance executive who held senior finance and management positions with a number of Australian publicly-listed companies. In a number of these senior roles, he was engaged in significant strategic business planning and business change, including several turnarounds, new market expansions and management leadership initiatives.
Mr Chenu has a Bachelor of Commerce from the University of Melbourne and an MBA from Macquarie Graduate School of Management, Australia.
Directorships of listed companies in the past five years: Current – Director of Reliance Worldwide Corporation Limited (since April 2016; listed April 2016); Director of CIMIC Group Limited (since 2014); Director of Metro Performance Glass Limited (since 2014).
Other: Resident of Australia.
Last elected: August 2014
Term expires: August 2017
| James Hardie 2016 Annual Report on Form 20-F | 26 |
David D. Harrison BA, MBA, CMA
Age 69
|
|
David Harrison was appointed as an independent non-executive director of James Hardie in May 2008. He is Chairman of the Remuneration Committee and a member of the Audit Committee.
| |
| Experience: Mr Harrison is an experienced company director with a finance background, having served in corporate finance roles, international operations and information technology for 22 years with Borg Warner/General
Electric Co. His previous experience includes 10 years at Pentair, Inc., as Executive Vice |
President and CFO (1994-1996 and 2000-2007) and Vice President and CFO roles at Scotts, Inc. and Coltec Industries, Inc. (1996-2000).
Directorships of listed companies in the past five years: Current – Director of National Oilwell Varco (since 2003); Former – Director of Navistar International Corporation (2007-2012).
Other: Resident of the United States.
Last elected: August 2013
Term expires: August 2016
Andrea Gisle Joosen MSc, BSc
Age 52
|
|
Andrea Gisle Joosen was appointed as an independent non-executive director of James Hardie in March 2015. She is a member of the Audit Committee.
| |
| Experience: Ms Gisle Joosen is an experienced former executive with extensive experience in marketing, brand management and business development across a range of different consumer businesses. Her former roles include
Chief Executive of Boxer TV Access AB in Sweden and Managing Director (Nordic region) of Panasonic, Chantelle AB and Twentieth Century Fox. Her early career involved |
several senior marketing roles with Procter & Gamble and Johnson & Johnson.
Directorships of listed companies in the past five years: Current – Director of BillerudKorsnas AB (since 2015); Director of Dixons Carphone plc (since 2014); Director of ICA Gruppen AB (since 2010); Former – Director of Dixons Retail plc (2012-2013).
Other directorships: Chairman and Director of Teknikmagasinet AB (since 2015); Director of Mr Green AB (since 2015); Director of Neopitch AB (since 2004)
Other: Resident of Sweden.
Last elected: August 2015
Term expires: August 2018
| James Hardie 2016 Annual Report on Form 20-F | 27 |
Alison Littley BA, FCIPS
Age 53
|
|
Alison Littley was appointed as an independent non-executive director of James Hardie in February 2012. She is a member of the Audit Committee and the Remuneration Committee.
Experience: Ms Littley has substantial experience in
multinational manufacturing and supply chain operations, and she brings a strong international leadership background building effective management teams and third party relationships. She has held a variety of positions, most recently as Chief
Executive of Buying |
Solutions, a UK Government Agency responsible for procurement of goods and services on behalf of UK government and public sector bodies (2006-2011). She has previously held senior management roles in Diageo plc (1999-2006) and Mars, Inc. (1981-1999). She serves on the Board of Weightmans LLP, a UK law firm and Eakin Healthcare Ltd, a medical device company.
Directorships of listed companies in the past five years: None.
Other: Resident of the United Kingdom.
Last elected: August 2015
Term expires: August 2018
James Osborne BA Hons, LLB
Age 67
|
|
James Osborne was appointed as an independent non-executive director of James Hardie in March 2009. He is a member of the Nominating and Governance Committee.
Experience: Mr Osborne is an experienced company director with a strong legal background and a considerable knowledge of international business operations in North America and Europe. His career includes 35 years with the leading Irish law firm, A&L Goodbody, in roles which included opening the firm’s New York office in |
1979 and serving as the firm’s managing partner (1982-1994). He has served as a consultant to the firm since 1994. Mr Osborne also contributed to the listing of Ryanair in London, New York and Dublin and continues to serve on Ryanair’s board.
Directorships of listed companies in the past five years: Current – Director of Ryanair Holdings plc (since 1996); Chairman and Director of Oneview Healthcare plc (since 2013, listed March 2016). Former – Chairman of Independent News & Media (2011-2012).
Other directorships: Chairman of Eason Holdings plc (since 2013); Chairman of Jellia Holdings Limited (since 2014); Chairman of ELST (since 2012)
Other: Resident of Ireland.
Last elected: August 2015
Term expires: August 2018
| James Hardie 2016 Annual Report on Form 20-F | 28 |
Rudolf van der Meer M.Ch.Eng
Age 71
|
|
Rudy van der Meer was appointed as an independent non-executive director of James Hardie in February 2007. He is Chairman of the Nominating and Governance Committee.
Experience: Mr van der Meer is an experienced former executive,
with considerable knowledge of international business and the building and construction sector. During his 32-year association with Akzo Nobel N.V., he held a number of senior positions including CEO of Coatings (2000-2005), CEO of |
Chemicals (1993-2000), and member of the five person Executive Board (1993-2005).
Directorships of listed companies in the past five years: Current – Director of LyondellBasell Industries N.V. (since 2010); Former – Member of the Supervisory Board of Hagemeyer N.V. (2006-2008); Chairman of the Supervisory Board of Royal Imtech N.V. (2005-2013).
Other directorships: Former Chairman of the Board of Energie Beheer Nederland B.V. (2006-2013); Chairman of the Supervisory Board of VGZ Health Insurance (since 2011)
Other: Resident of the Netherlands.
Last elected: August 2014
Term expires: August 2017
| James Hardie 2016 Annual Report on Form 20-F | 29 |
This Remuneration Report describes our executive remuneration philosophy, programs and objectives and explains the decisions of the Remuneration Committee and the Board of Directors (the “Board”) for our senior executive officers’ fiscal year 2016 remuneration.
We are not required to produce a remuneration report under applicable Irish, Australian or US rules or regulations. However, taking into consideration our significant Australian and US shareholder bases and our primary listing on the ASX, we have voluntarily produced a remuneration report consistent with those provided by similarly situated companies for non-binding shareholder approval since 2005.
In this Remuneration Report, we first provide a summary of our business performance and the key remuneration considerations and decisions made in fiscal year 2016. We then describe in detail our remuneration philosophy, the individual elements of our remuneration program and the linkage between our remuneration programs and our pay-for-performance philosophy. For fiscal year 2016, our senior executive officers (Chief Executive Officer (“CEO”), Chief Financial Officer (“CFO”) and the other three highest paid executive officers based on total compensation that was earned or accrued for fiscal year 2016) (“Senior Executive Officers”) are:
| • | Louis Gries, CEO; |
| • | Matthew Marsh, CFO and Executive Vice President – Corporate; |
| • | Ryan Sullivan, Executive Vice President and President – James Hardie Building Products; |
| • | Mark Fisher, Executive Vice President – International; and |
| • | Joseph Blasko, General Counsel and Chief Compliance Officer |
This Remuneration Report has been adopted by our Board on the recommendation of the Remuneration Committee.
EXECUTIVE SUMMARY
Fiscal Year 2016 Business Highlights1
We delivered strong financial performance in fiscal year 2016, highlighted by Adjusted net operating profit of US$242.9 million, Adjusted earnings before interest and taxes (“EBIT”) of US$350.7 million, and net sales of US$1.7 billion. In addition, we achieved a 45% increase in net cash provided by operating activities, compared to the fiscal year 2015, and $268.8 million of capital returned to shareholders through a combination of dividends and the previously announced share buyback program.
| 1 | Please see the “Glossary of Abbreviations and Definitions” in Section 4 of this Annual Report for a reconciliation of non-GAAP financial measures used in this Remuneration Report to the most directly comparable US GAAP financial measure. |
| James Hardie 2016 Annual Report on Form 20-F | 30 |
The following graphs show our performance for key financial measures during fiscal year 2016, with a comparison to prior corresponding periods:
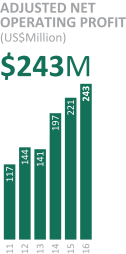
|
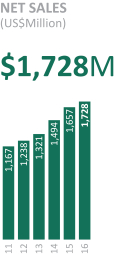
|
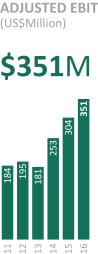
|
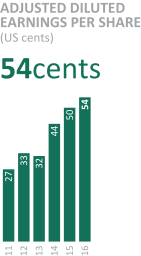
|
Fiscal Year 2016 Compensation Highlights
Our fiscal year 2016 compensation continued to reflect and promote our pay-for-performance philosophy and our stated goal to position Senior Executive Officer fixed base salary and benefits at the median and total target direct remuneration (comprising fixed and target variable remuneration) at the 75th percentile of our Peer Group (defined herein), if stretch short and long-term target performance goals are met. During May 2015, the Board, with the assistance of the Remuneration Committee and its independent remuneration advisers, undertook its annual review of our existing remuneration policies, programs and arrangements and determined the following for fiscal year 2016 pay programs:
| • | For fiscal year 2016, there were no increases in Mr Gries’ base salary or short-term incentive (“STI”) target. Mr Gries’ target long-term incentive (“LTI”) increased by US$500,000 to US$4.0 million. The Board made this adjustment in order to bring Mr Gries’ total compensation package in line with the total compensation packages of CEOs in our Peer Group. |
| • | Base salary increases for Messrs Marsh, Fisher, and Blasko were made in line with our annual compensation review guidelines and were adjusted as required to maintain positioning relative to market merit increase levels. The base salary increase for Mr Sullivan was made to properly align his base salary with the increased scope and accountability of his position. In addition, target LTI for fiscal year 2016 increased for Messrs Marsh, Sullivan, Fisher, and Blasko to better align LTI target values with (i) our CEO succession plan; (ii) our need to retain key senior executives through the eventual CEO transition process; (iii) our lean management structure; and (iv) the 75th percentile of |
| James Hardie 2016 Annual Report on Form 20-F | 31 |
| our Peer Group LTI values, consistent with our remuneration philosophy. Base pay and target LTI increases in fiscal year 2016 for Senior Executive Officers, other than the CEO are as follows: |
| Base Salary | Target LTI | |||||||||||||||
| Name | Fiscal Year 2015 (US$) |
Fiscal Year 2016 (US$) |
Fiscal Year 2015 (US$) |
Fiscal Year 2016 (US$) |
||||||||||||
| M Marsh |
500,000 | 520,000 | 500,000 | 900,000 | ||||||||||||
| R Sullivan |
420,000 | 520,000 | 500,000 | 900,000 | ||||||||||||
| M Fisher |
490,000 | 500,000 | 500,000 | 650,000 | ||||||||||||
| J Blasko |
360,000 | 380,000 | 300,000 | 400,000 | ||||||||||||
| • | To better align and focus management’s performance on initiatives that are key to our success, the Remuneration Committee approved changes to the performance measures for the US business under the company performance plan (“CP Plan”) component of our annual STI. There are no changes to the other components of the CP Plan (performance measures for the Asia Pacific business, maximum payout levels and Remuneration Committee discretion on STI paid) or to the individual performance plan (“IP Plan”) component of our annual STI. A complete description of the performance hurdles applicable for fiscal year 2016 for the CP Plan is set in the section titled “Incentive Arrangements” later in this Remuneration Report. |
| • | The Remuneration Committee established a performance-based compensation clawback policy in connection with performance-based compensation paid or awarded to certain executives. The clawback policy provides that the Board may, in all appropriate circumstances, recover from any current or former executive regardless of fault, that portion of any performance-based compensation erroneously awarded: (i) based on financial information required to be reported under applicable US or Australian securities laws or applicable exchange listing standards that would not have been paid in the three completed fiscal years preceding the year(s) in which an accounting restatement is required to correct a material error; or (ii) during the previous three completed fiscal years as a result of any errors or omissions in objective, calculable performance measures contained in formal papers presented to and relied upon by the Board for purposes of determining compensation to be paid or awarded, where the absence of such errors or omissions would have resulted in there being a material negative impact on the amount of performance-based compensation paid or awarded. |
| James Hardie 2016 Annual Report on Form 20-F | 32 |
Fiscal Year 2016 Total Target Compensation
Remuneration packages for Senior Executive Officers reflect our remuneration philosophy and comprise a mixture of fixed base salary and benefits and variable performance-based incentives. The Remuneration Committee seeks to appropriately balance fixed and variable remuneration in order to align our total compensation structure with our pay-for-performance philosophy. The following chart summarizes total target compensation awarded to each Senior Executive Officer in fiscal year 2016:
| Summary of Fiscal Year 2016 Senior Executive Officer Target Compensation | ||||||||||||||||
| Senior Executive Officer |
FY2016 Annual Base Salary (US$) |
FY2016 STI Target Value (US$) |
FY2016 LTI Target Value (US$) |
FY2016 Total Target Compensation (US$) |
||||||||||||
| L Gries |
950,000 | 1,187,500 | 4,000,000 | 6,137,500 | ||||||||||||
| M Marsh |
520,000 | 312,000 | 900,000 | 1,732,000 | ||||||||||||
| R Sullivan |
520,000 | 312,000 | 900,000 | 1,732,000 | ||||||||||||
| M Fisher |
500,000 | 300,000 | 650,000 | 1,450,000 | ||||||||||||
| J Blasko |
380,000 | 226,000 | 400,000 | 1,006,000 | ||||||||||||
Results of 2016 Remuneration Report Vote
In August 2015, our shareholders were asked to cast a non-binding advisory vote on our remuneration report for the fiscal year ended 31 March 2015. Although we are not required under applicable Irish, Australian or US laws or regulations to provide a shareholder vote on our executive remuneration practices, the Board believes that it is important to engage shareholders on this important issue and we have voluntarily submitted our remuneration report for non-binding shareholder approval on an annual basis since 2005 and currently intend to continue to do so. At our 2015 Annual General Meeting, our shareholders approved our remuneration report, with more than 86% of the votes cast in support of our remuneration program. The Remuneration Committee considered the results of this supportive advisory vote, together with the other factors and data discussed in this Remuneration Report, in determining our executive remuneration policies, objectives and decisions, as well as our shareholder engagement efforts to communicate these, in fiscal year 2016.
APPROACH TO SENIOR EXECUTIVE REMUNERATION
Remuneration Philosophy
As our main business and all of our Senior Executive Officers are located in the US, our remuneration philosophy is to provide our Senior Executive Officers with an overall package that is competitive with Peer Group companies (defined herein) exposed to the US housing market. Within this philosophy, the executive remuneration framework emphasizes operational excellence and shareholder value creation through incentives which link executive remuneration with the interests of shareholders. Our remuneration plans and programs are structured to enable us to: (i) attract and retain talented executives; (ii) reward outstanding individual and corporate performance; and (iii) align the interests of our executives to the interests of our shareholders,
| James Hardie 2016 Annual Report on Form 20-F | 33 |
with the ultimate goal of improving long-term value for our shareholders. This pay-for-performance system continues to serve as the framework for executive remuneration, aligning the remuneration received with the performance achieved.
Composition of Remuneration Packages
In line with our remuneration philosophy, our goal is to position Senior Executive Officer fixed base salary and benefits at the median and total target direct remuneration (comprising fixed and target variable remuneration) at the 75th percentile of our Peer Group, if stretch short and long-term target performance goals are met. Performance goals for target variable performance-based incentive remuneration are set with the expectation that we will deliver results in the top quartile of our Peer Group. Performance below this level will result in variable remuneration payments below target (and potentially zero for poor performance). Performance above this level will result in variable remuneration payments above target.
Relative Weightings of Fixed and Variable Remuneration
The charts below detail the relative weightings of fixed versus variable remuneration for the CEO and other Senior Executive Officers for fiscal years 2016 and 2015. Fixed remuneration includes base salary and other fixed benefits. Variable remuneration is comprised of STI Awards and the following three LTI components: (i) relative total shareholder return restricted stock units (“Relative TSR RSUs”); (ii) return on capital employed restricted stock units (“ROCE RSUs”); and (iii) scorecard long-term incentive (“Scorecard LTI”), each of which are discussed later in this Remuneration Report. STI Awards include amounts incurred under the CP and IP plans for each fiscal year, paid in June of the following fiscal year, and LTI components are shown at total granted value.
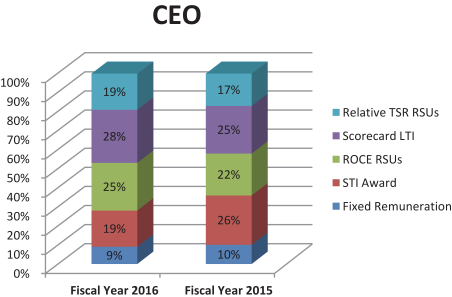
| James Hardie 2016 Annual Report on Form 20-F | 34 |
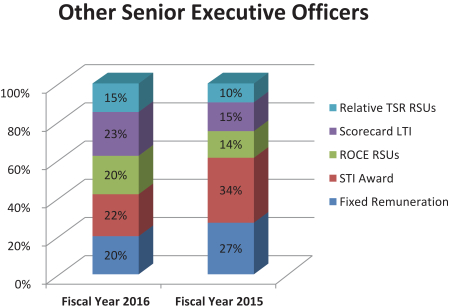
Setting Remuneration Packages
Remuneration decisions are based on the executive remuneration philosophy and framework described in this Remuneration Report. The Remuneration Committee reviews and the Board approves this framework each year.
Remuneration packages for Senior Executive Officers are evaluated each year to make sure that they continue to align with our compensation philosophy, are competitive with our Peer Group and developments in the market, and continue to support our business structure and objectives. In making decisions regarding individual Senior Executive Officers, the Remuneration Committee takes into account the results of an annual remuneration positioning review provided by the Remuneration Committee’s independent advisor, as well as the Senior Executive Officer’s responsibilities and performance.
All aspects of the remuneration package for our CEO, and CFO are determined by the Remuneration Committee and ratified by the Board. All aspects of the remuneration package for the remaining Senior Executive Officers are determined by the Remuneration Committee on the recommendation of the CEO.
Remuneration Committee Governance
The remuneration program for our Senior Executive Officers is overseen by our Remuneration Committee, the members of which are appointed by the Board. As prescribed by the Remuneration Committee Charter, the duties of the Remuneration Committee include, among other things: (i) administering and making recommendations on our incentive compensation and equity-based remuneration plans; (ii) reviewing the remuneration of directors; (iii) reviewing the remuneration framework for the Company; and (iv) making recommendations to the Board on our recruitment, retention and termination policies and procedures for senior management. The
| James Hardie 2016 Annual Report on Form 20-F | 35 |
current members of the Remuneration Committee are David Harrison (Chairman), Brian Anderson, Russell Chenu, Michael Hammes and Alison Littley, the majority of whom are independent non-executive directors. A more complete description of these and other Remuneration Committee functions is contained in the Remuneration Committee’s Charter, a copy of which is available in the Corporate Governance section of our investor relations website (www.ir.jameshardie.com.au).
Summary of Executive Compensation Practices
The following table summarizes certain of the key governance practices employed by the Remuneration Committee relative to our executive compensation practices, including those practices which we believe are important drivers of both short- and long-term corporate performance and those practices which we believe are not aligned with the long-term interests of our shareholders:
| What We Do | What We Don’t Do | |||||
| ü | Retain independent compensation advisors reporting directly to Remuneration Committee | Prohibition on hedging of stock held by executives and directors | ||||
| ü | Pay for performance model, with approximately 85% of our CEO’s total target compensation being performance-based “at risk” compensation and an average of approximately 67% total target compensation being performance-based “at risk” compensation for our other Senior Executive Officers | Limited employment agreements and severance arrangements | ||||
| ü | Circuit breaker on annual STI awards to ensure that no annual incentive awards are paid unless minimum corporate performance levels are achieved | Limited change-in-control benefits | ||||
| ü | Set robust share ownership requirements for all directors and Senior Executive Officers | No dividends paid on unvested equity awards | ||||
| ü | Broad clawback policy on performance-based compensation | Limited perquisites and other benefits | ||||
| ü | Set performance-based vesting conditions for all equity grants to Senior Executive Officers | No time-based LTI equity grants to Senior Executive Officers | ||||
| ü | Provide the Remuneration Committee with ability to exercise “negative” discretion when determining the vesting and payout of our LTI programs | No excessive retirement or deferred compensation arrangements | ||||
| James Hardie 2016 Annual Report on Form 20-F | 36 |
Remuneration Advisers
As permitted by the Remuneration Committee Charter, the Remuneration Committee retained Aon Hewitt (in the US) and Guerdon Associates (in Australia) as its independent advisers for matters regarding remuneration for fiscal year 2016. The Remuneration Committee reviews the appointment of its advisors each year. Both Aon Hewitt and Guerdon Associates provided the Remuneration Committee with written certification during fiscal year 2016 to support their re-appointment. In those certifications, the advisors: (i) confirmed that their pay recommendations were made without undue influence from any member of our management; and (ii) provided detailed responses to the six independence factors a Remuneration Committee should consider under relevant NYSE rules, and confirmed their independence based on these factors.
The Remuneration Committee reviewed these certifications before re-appointing each advisor for fiscal year 2017.
Peer Group Analysis
To assist the Remuneration Committee in making remuneration decisions, the Remuneration Committee evaluates the remuneration of our Senior Executive Officers against a designated set of companies (the “Peer Group”). The Peer Group, which is reviewed by the Remuneration Committee on an annual basis, consists of companies that are similar to us in terms of certain factors, including size, industry, and exposure to the US housing market. For fiscal year 2016, the Peer Group remained unchanged from fiscal year 2015. The Remuneration Committee believes that US market focused companies are a more appropriate peer group than ASX-listed companies, as they are exposed to the same macroeconomic factors in the US housing market as those we face. The names of the 24 companies comprising the Peer Group are set forth below.
| Acuity Brands, Inc | Louisiana-Pacific Corp | Sherwin Williams Co | ||
| American Woodmark Corp | Martin Marietta Materials, Inc | Simpson Manufacturing Co., Inc | ||
| Apogee Enterprises, Inc | Masco Corporation | Trex Co., Inc | ||
| Armstrong World Indus, Inc | Mohawk Industries, Inc | USG Corp | ||
| Eagle Materials, Inc | Mueller Water Products, Inc | Valmont Industries, Inc | ||
| Fortune Brands Home & Security | NCI Building Systems, Inc | Valspar Corporation | ||
| Headwaters, Inc | Owens Corning | Vulcan Materials Co | ||
| Lennox International, Inc | Quanex Building Products Corp | Watsco, Inc |
Performance Linkage with Remuneration Policy
During its annual review, the Remuneration Committee assessed our performance in fiscal year 2016 against the background of the continued gradual recovery in the US and Asia Pacific markets. This review included assessing fiscal year 2016 performance against:
| • | our historical performance; |
| • | our Peer Group; |
| James Hardie 2016 Annual Report on Form 20-F | 37 |
| • | the goals in our STI and LTI variable remuneration plans; and |
| • | the key objectives and measures the Board expects to see achieved, which are referred to as the “Scorecard” and further discussed later in this Remuneration Report. |
Based on that review, the Board and the Remuneration Committee concluded that management’s performance in fiscal year 2016 was on the whole: (i) significantly above target on earnings and slightly above target on growth measures, resulting in STI variable remuneration outcomes being above target for fiscal year 2016; and (ii) superior to the 75th percentile of our Peer Group on TSR performance and substantially above expectations on long-term strategic measures included in the Scorecard (when taken together with performance in fiscal years 2014 and 2015), resulting in LTI variable remuneration being above target for fiscal years 2014-2016.
More details about this assessment, including the percentage of the maximum variable remuneration awarded to or forfeited by Senior Executive Officers is set out on pages 37 through 48 of this Remuneration Report.
DESCRIPTION OF 2016 REMUNERATION ELEMENTS
Base Salaries and Other Fixed Remuneration Benefits
Base salary provides a guaranteed level of income that recognizes the market value of the position and internal equities between roles, and the individual’s capability, experience and performance. Annual base salary increases are not automatic. Base salaries for Senior Executive Officers are positioned around the market median for positions of similar responsibility and are reviewed by the Remuneration Committee each year.
In addition, Senior Executive Officers may receive certain other limited fixed benefits, such as medical and life insurance benefits, car allowances, participation in executive wellness programs and an annual financial planning allowance. For fiscal year 2016, the base salary and value of other fixed benefits for each of our Senior Executive Officers is provided in the Base Pay and Other Benefits columns of the remuneration table, in sectioned titled “Remuneration Paid to Senior Executive Officers”.
Retirement Plan
In every country in which we operate, we offer employees access to pension, superannuation or individual retirement savings plans consistent with the laws of the respective country.
In the US, we sponsor a defined contribution plan, the James Hardie Retirement and Profit Sharing Plan (the “401(k) Plan”). The 401(k) Plan is a tax-qualified retirement and savings plan covering all US employees, including our Senior Executive Officers, subject to certain eligibility requirements. Participating employees were able to elect to reduce their current annual compensation by up to US$18,000 in calendar year 2015 and have the amount of such reduction contributed to the 401(k) Plan, with a maximum eligible compensation limit of US$265,000. In addition, we match employee contributions dollar for dollar up to a maximum of the first 6% of an employee’s eligible compensation.
| James Hardie 2016 Annual Report on Form 20-F | 38 |
Incentive Arrangements
In addition to the base salary and other fixed benefits provided to our Senior Executive Officers, the Remuneration Committee reviews and approves a combination of both short-term and long-term variable incentive programs on an annual basis. For fiscal year 2016, our variable incentive plans for Senior Executive Officers were as follows:
| Duration | Plan Name | Amount | Form Incentive Paid | |||
| STI (1 year) |
IP Plan | 20% of STI Target | Cash | |||
| CP Plan | 80% of STI Target | Cash | ||||
|
LTI (3 - 4.5 years) |
Long Term Incentive Plan 2006 (“LTIP”) |
40% of LTI Target | ROCE RSUs | |||
| 30% of LTI Target | Relative TSR RSUs | |||||
| 30% of LTI Target | Cash (Scorecard LTI) | |||||
STI Plans
On an annual basis, the Remuneration Committee approves a STI target for all Senior Executive Officers, expressed as a percentage of base salary, which is allocated between individual goals and company goals under the IP and CP Plans, respectively. For fiscal year 2016, the STI target percentage for Mr Gries was 125% of base salary and 60% of base salary for Messrs Marsh, Sullivan, Fisher and Blasko, with 80% allocated to the CP Plan and 20% allocated to the IP Plan for all Senior Executive Officers.
Since fiscal year 2014, the Remuneration Committee has applied a ‘circuit breaker’ to the STI plans which, for Senior Executive Officers, will prevent payment of any STI under the CP and IP Plans unless our performance exceeds a level approved by the Remuneration Committee each year. For fiscal year 2016, the ‘circuit breaker’ was set at 60% of our fiscal year 2016 plan Adjusted EBIT (indexed to housing starts) less any impairment costs the Remuneration Committee determines should be disregarded.
CP Plan
The CP Plan is based on a series of payout matrices for the US and Asia Pacific businesses, which provide a range of possible payouts depending on our performance against hurdles which assess volume growth relative to, and above, market (“Growth Measure”), earnings (“Return Measure”), and for the US business, performance of the interiors business and performance against certain “wood-look” competitors. Each Senior Executive Officer can receive between 0% and 300% of their STI target allocated to the CP Plan based on the results of the payout multiple the Senior Executive Officer is tied to. All Senior Executive Officers are tied to either the US multiple (Messr Sullivan) or a composite multiple derived from the metrics for the US (80%) and Asia Pacific (20%) businesses combined (Messrs Gries, Marsh, Fisher and Blasko).
| James Hardie 2016 Annual Report on Form 20-F | 39 |
Payout Matrices
We use both performance measures (Growth Measure and Return Measure) in the payout matrices for our US and Asia Pacific businesses in order to ensure that as management increases its top line market growth focus, it does not do so at the expense of short- to medium-term earnings. Management is encouraged to balance market growth and earnings returns since achievement of a higher reward requires management to generate both strong earnings and growth relative to and above market. Higher returns on one measure at the expense of the other measure may result in a lower reward or no reward at all.
To ensure that the payout matrices represent genuinely challenging targets aligned with our executive remuneration philosophy, particularly in light of the continued, but gradual recovery of the US housing market, the Growth Measure is indexed to take into account changes in the US and Asia Pacific new housing starts and the US repair and remodel market and the Return Measure is indexed to take into account changes in pulp prices. The targets for the Return Measure exclude costs related to legacy issues. The Remuneration Committee has reserved for itself discretion to change the STI paid. Examples of instances when the Remuneration Committee would consider exercising this discretion include external factors outside of management’s control, and for the US CP Plan only, if the general shift toward smaller homes at each segment of the US market is considered sufficiently material. The Remuneration Committee will disclose the reasons for any such exercise of discretion.
The Remuneration Committee believes that the payout matrices are appropriate because they provide management with an incentive to achieve overall corporate goals, balance growth with returns in our primary markets, recognize the need to flexibly respond to strategic opportunities, incorporate indexing relative to market growth to account for factors beyond management’s control, and incorporate Remuneration Committee discretion to ensure appropriate outcomes. Payouts under the US matrix may range from 0% to 200% of target, while payouts under the Asia Pacific matrix may range from 0 to 300% of target.
We do not disclose the volume Growth Measure and earnings Return Measure targets for our US or Asia Pacific businesses since these are commercial-in-confidence. However, achieving a target payment for the Return Measure under either the US or Asia Pacific payout matrix for fiscal year 2016 would have required performance above the average of performance for the previous three years and the fiscal year 2016 plan. Achieving a target payout for the Growth Measure requires growth substantially above market growth.
Additional US Performance Metrics
In addition to the Growth Measure and Return Measure components of the CP plan, for the US business only, the Remuneration Committee has implemented additional performance measures in order to better align and focus management’s performance on initiatives that are key to the success of the US business. For fiscal year 2016, the Remuneration Committee approved changes to the performance measures for the US business to increase the weight of key business initiatives in the calculation of determining STI paid. As a result, the US payout multiple for fiscal year 2016 is determined by performance against the matrix multiple (Growth and Return measures for 70% of the STI opportunity), the interiors product business multiple (for 10% of STI
| James Hardie 2016 Annual Report on Form 20-F | 40 |
opportunity), and the “Wood-look” multiple (for 20% of STI opportunity). The overarching formula for the US payout multiple is:

Each payout factor (Matrix Factor, Interiors Factor, and “Wood-look” Factor) is capped as follows to properly balance management’s focus across volume growth, returns and key initiatives:
| • | Matrix Factor = capped at 2.0x |
| • | Matrix Factor plus Interiors Factor = capped at 2.3x |
| • | “Wood-look” Factor = capped at 1.25x |
The Interiors Multiple is measured as a function of the revenue growth of our interiors business in fiscal year 2016. The “Wood-look” Multiple is measured as our growth against key “wood-look” competition.
We do not disclose the interiors volume growth or “wood-look” targets since these are commercial-in-confidence. However, achieving a target payment for fiscal year 2016 would have required performance above performance for fiscal year 2015 for interiors volume growth and substantial growth against key “wood-look” competition.
IP Plan
Under the IP Plan, the Remuneration Committee approves a series of one-year individual performance goals which, along with personal growth and development goals, are used to assess the performance of our Senior Executive Officers. The IP Plan links financial rewards to the Senior Executive Officer’s achievement of specific objectives that have benefited us and contributed to shareholder value, but are not captured directly by financial measures in the CP Plan. Each Senior Executive Officer can receive between 0% and 150% of their STI target allocated to the IP Plan based on achievement of individual performance and personal growth and development goals.
STI Plan Performance for Fiscal Year 2016
Our results and the subsequent STI payouts for fiscal year 2016 were above STI target as a result of:
| • | the US business performing substantially above target on the Return Measure due to lower production costs per unit, higher average net sales price, and lower organizational costs as a percentage of revenue; |
| • | the US business performing below target on the Growth Measure; |
| • | the US business performing significantly above target on the “Wood-look” Factor and above target on the Interiors Factor; |
| • | Asia Pacific performing slightly above target on the Growth Measure due to the Australia and New Zealand businesses achieving growth above their respective targets, offset by the Philippines business achieving growth below target; and |
| • | Asia Pacific performing above target on the Return Measure due to higher returns in Australia, New Zealand and the Philippines. |
| James Hardie 2016 Annual Report on Form 20-F | 41 |
The Senior Executive Officers’ performance and the subsequent STI payouts for fiscal year 2016 were generally at or above target based on each Senior Executive Officer’s achievement of fiscal year 2016 one-year individual performance and personal growth and development goals.
For fiscal year 2016, the amount to be paid to each of our Senior Executive Officers under the STI Plans is provided in the STI Award column of the remuneration table, in the section titled “Remuneration Paid to Senior Executive Officers”. The percentage of the maximum STI Variable Remuneration awarded to or forfeited by each Senior Executive Officer for (individual and company) performance in fiscal year 2016 compared to fiscal year 2015 was:
| STI Award1 | ||||||||
| Awarded % | Forfeited % | |||||||
| L Gries |
||||||||
| Fiscal Year 2016 |
76 | 24 | ||||||
| Fiscal Year 2015 |
100 | - | ||||||
| M Marsh |
||||||||
| Fiscal Year 2016 |
76 | 24 | ||||||
| Fiscal Year 2015 |
100 | - | ||||||
| R Sullivan |
||||||||
| Fiscal Year 2016 |
80 | 20 | ||||||
| Fiscal Year 2015 |
100 | - | ||||||
| M Fisher |
||||||||
| Fiscal Year 2016 |
74 | 26 | ||||||
| Fiscal Year 2015 |
98 | 2 | ||||||
| J Blasko |
||||||||
| Fiscal Year 2016 |
74 | 26 | ||||||
| Fiscal Year 2015 |
96 | 4 | ||||||
| 1 | Awarded = % of STI Award maximum actually paid. Forfeited = % of STI Award maximum foregone. STI Award amounts are paid in cash under the CP and IP Plans. |
LTI Plans
Each year, the Remuneration Committee approves a LTI target for all Senior Executive Officers. The approved target is allocated between three separate components to ensure that each Senior Executive Officer’s performance is assessed across factors considered important for sustainable long-term value creation:
| • | ROCE RSUs are used as they are an indicator of high capital efficiency required over time; |
| • | Relative TSR RSUs are used as they are an indicator of our performance relative to our Peer Group; and |
| • | Scorecard LTI is an indicator of each Senior Executive Officer’s contribution to achieving our long-term strategic goals. |
| James Hardie 2016 Annual Report on Form 20-F | 42 |
Awards issued under the LTI Plans are issued pursuant to the terms of the Amended and Restated James Hardie Industries plc Long Term Incentive Plan 2006 (the “LTIP”). During fiscal year 2016, our Senior Executive Officers were granted the following awards under the LTIP:
| ROCE RSUs | TSR RSUs | Scorecard LTI Units |
||||||||||
| L Gries |
254,480 | 292,514 | 286,290 | |||||||||
| M Marsh |
57,258 | 65,816 | 64,415 | |||||||||
| R Sullivan |
57,258 | 65,816 | 64,415 | |||||||||
| M Fisher |
41,353 | 47,533 | 46,522 | |||||||||
| J Blasko |
25,448 | 29,251 | 28,629 | |||||||||
RSUs issued under our LTI programs will be settled upon vesting in CUFS on a 1-to-1 basis. Unless the context indicates otherwise, in this Remuneration Report when we refer to our common stock, we are referring to the shares of our common stock that are represented by CUFS.
ROCE RSUs (40% of target LTI)
The Remuneration Committee introduced ROCE RSUs in fiscal year 2013 because the US housing market had stabilized to an extent which permitted the setting of multi-year financial metrics. The Remuneration Committee believes ROCE RSUs remain an appropriate component of the LTI Plan because they:
| • | allow the Remuneration Committee to replace the interim one-year metrics previously used during the US housing downturn with three-year financial metrics; |
| • | tie the reward’s value to share price which provides alignment with shareholder interests; |
| • | promote that we earn appropriate returns on the additional capital invested in response to the improvement in the US housing market; |
| • | reward performance that is under management’s direct influence and control; and |
| • | focus management on capital efficiency as the necessary precondition for the creation of additional shareholder value. |
| James Hardie 2016 Annual Report on Form 20-F | 43 |
Consistent with fiscal years 2013 through 2015, the maximum payout for the ROCE RSUs is 200% of target LTI. ROCE is determined by dividing Adjusted EBIT by Adjusted Capital Employed1. The ROCE hurdles will be indexed for changes to US and Asia Pacific addressable housing starts. The resulting Adjusted Capital Employed for each quarter of any fiscal year will be averaged to better reflect Capital Employed through a year rather than at a certain point in time.
ROCE hurdles for the ROCE RSUs are based on historical results and take into account the recovering US housing market and better optimization of our manufacturing plants. The three-year average ROCE for fiscal years 2013, 2014 and 2015 was 22.9%.
The hurdles for ROCE RSUs granted in fiscal year 2016 (for performance in fiscal years 2016 to 2018) were changed from those granted in fiscal year 2015 as follows:
| Fiscal Years 2015-2016 ROCE |
Fiscal Years 2016-2018 ROCE |
% of ROCE RSUs to vest |
||||
| < 22.0% |
< 23.0% | 0% | ||||
| ³ 22.0%, but < 24.5% |
³ 23.0%, but < 25.0% | 25% | ||||
| ³ 24.5%, but < 27.0% |
³ 25.0%, but < 27.5% | 50% | ||||
| ³ 27.0%, but < 28.5% |
³ 27.5%, but < 28.5% | 75% | ||||
| ³ 28.5% |
³ 28.5% | 100% | ||||
At the conclusion of this three-year performance period, the Remuneration Committee will review management’s performance based on the quality of the returns balanced against management’s delivery of market share growth and performance against the Scorecard. Following this review, the Remuneration Committee can exercise negative discretion to reduce the number of shares received on vesting of the ROCE RSUs. This discretion can only be applied to reduce the number of shares which will vest.
| 1 | For purposes of ROCE RSU vesting, “Adjusted EBIT” and “Adjusted Capital Employed” will be calculated as follows: |
| “Adjusted EBIT” will be calculated as (i) EBIT as reported in our financial results; adjusted by (ii) deducting the earnings impact of legacy issues (such as asbestos adjustments and New Zealand weathertightness); and (iii) adding back asset impairment charges in the relevant period, unless otherwise determined by the Remuneration Committee. |
| “Adjusted Capital Employed” will be calculated as Total Assets minus Current Liabilities as reported in our financial results; adjusted by: (i) excluding balance sheet items related to legacy issues (such as asbestos adjustments), dividends payable and deferred taxes; (ii) adding back asset impairment charges in the relevant period, unless otherwise determined by the Remuneration Committee; (iii) adding back leasehold assets for manufacturing facilities and other material leased assets; and (iv) deducting all greenfield construction-in-progress, and any brownfield construction-in-progress projects involving capacity expansion that are individually greater than US$20 million, until such assets reach commercial production and are transferred to the fixed asset register. |
| James Hardie 2016 Annual Report on Form 20-F | 44 |
ROCE RSUs Vesting in Fiscal Year 2016 (For Fiscal Years 2013-2015)
As a component of the fiscal year 2013 LTI Plan, we granted ROCE RSUs in September 2012. The ROCE RSUs comprised 40% of each executive’s LTI target and were granted assuming maximum performance (200% of target). Vesting of the ROCE RSUs is dependent on the average ROCE performance for fiscal years 2013-2015 and is subject to the Remuneration Committee’s negative discretion based on its judgment regarding the quality of returns balanced against management’s delivery of market share growth. The ROCE performance hurdles for this grant were approved as follows:
| ROCE Performance Level | % of ROCE RSUs vested | |
|
<18.5% |
0% | |
| ³18.5% but < 19.5% |
25% | |
| ³19.5% but <20.5% |
50% | |
| ³20.5% but <21.5% |
75% | |
| ³21.5% |
100% |
Based solely on the average ROCE result for fiscal years 2013-2015 of 22.9%, 100% of the ROCE RSUs granted would have vested. However, based on the Remuneration Committee’s assessment of the quality of returns balanced against management’s delivery of market share growth, the Remuneration Committee determined that it would apply negative discretion in the amount of 20%. As such, 80% of the outstanding fiscal year 2013 ROCE RSUs vested on 14 September 2015. Unvested ROCE RSUs from this grant were forfeited.
Relative TSR RSUs (30% of target LTI)
The Remuneration Committee believes that Relative TSR RSUs continue to be an appropriate component of the LTI Plan because they provide alignment with shareholders. Even if macro-economic conditions create substantial shareholder value, Senior Executive Officers will only receive payouts if the TSR of our shares exceeds a specified percentage of our Peer Group over a performance period.
We have used Relative TSR RSUs in our LTI Plan since fiscal year 2009. Consistent with fiscal years 2013 through 2015, the maximum payout for Relative TSR RSUs granted in fiscal year 2016 is 200% of target LTI.
Relative TSR, measure changes in our share price and the share prices of our Peer Group; and assumes all dividends and capital returns are reinvested when paid. Our relative TSR performance will be measured against the Peer Group over a 36 to 54 month period from grant date, with testing at the 36th month, 48th month and at the end of the 54 month period. To eliminate the impact of short-term share price changes, the starting point and each test date are
| James Hardie 2016 Annual Report on Form 20-F | 45 |
measured using a 20 trading-day average closing price. Relative TSR RSUs will vest based on the following straight-line schedule:
| Performance against Peer Group | % of Relative TSR RSUs vested | |
| <40th Percentile |
0% | |
| 40th Percentile |
25% | |
| >40th Percentile - <60th Percentile |
Sliding Scale | |
| 60th Percentile |
50% | |
| >60th Percentile - <80th Percentile |
Sliding Scale | |
| ³80th Percentile |
100% |
The Remuneration Committee will continue to monitor the design of the Relative TSR RSU component of the LTI Plan for Senior Executive Officers with the aim of balancing investor preferences with the ability to motivate and retain Senior Executive Officers.
TSR RSUs Vesting in Fiscal Year 2016
As part of the fiscal year 2011 LTI Plan, in September 2010 we granted five year Relative TSR RSUs to senior executives. Vesting of these Relative TSR RSUs was dependent on our TSR performance relative to a set peer group, based on the following schedule:
| Performance against Peer Group | % of Relative TSR RSUs vested | |
| <50th Percentile |
0% | |
| 50th Percentile |
33% | |
| ³51st but <75th Percentile |
Sliding Scale | |
| ³75th Percentile |
100% |
In September 2015, the final test of relative TSR performance was completed, resulting in our TSR performance at the 76.9th percentile of the peer group (bringing the total vesting percentage for these grants over the five-year performance period to 100%).
As part of the fiscal year 2012 LTI Plan, in September 2011 we granted five year Relative TSR RSUs to senior executives. Vesting of these Relative TSR RSUs was dependent on our TSR performance relative to a set peer group, based on the same schedule as noted above for the fiscal year 2010 grants. In September 2015, the third test of relative TSR performance was completed, bringing the total vesting for this grant to 53.37% based on our TSR performance at the 57.6th percentile of the peer group. The fourth performance test (in March 2016) for these grants did not result in any additional vesting.
| James Hardie 2016 Annual Report on Form 20-F | 46 |
As part of the fiscal year 2013 LTI Plan, in September 2012 we granted five year Relative TSR RSUs to senior executives. Vesting of these Relative TSR RSUs was dependent on our TSR performance relative to a set peer group, based on the following schedule:
| Performance against Peer Group | % of Relative TSR RSUs vested | |
|
<40th Percentile |
0% | |
|
³40th but <80th Percentile |
Sliding Scale | |
|
³80th Percentile |
100% |
In September 2015, the first test of relative TSR performance was completed, resulting in 77% vesting for these grants based on our TSR performance at the 70.8th percentile of the peer group. The second performance test (in March 2016) for these grants did not result in any additional vesting.
Scorecard LTI (30% of target LTI)
We have used Scorecard LTI in our LTI Plan since fiscal year 2010. Each year, the Remuneration Committee approves a number of key management objectives and the measures it expects to see achieved in relation to these objectives. These objectives are incorporated into that year’s grant of Scorecard LTI. At the end of the three-year performance period, the Remuneration Committee assesses our Senior Executive Officers’ collective performance on each key objective and each individual Senior Executive Officer’s contribution to those achievements (with scores between 0 and 100) and the Board reviews this assessment. Senior Executive Officers may receive different ratings depending on the contribution they have made during the three-year performance period. Although most of the objectives in the Scorecard have quantitative targets, we consider some of the targets to be commercial-in-confidence. Consistent from fiscal year 2010, the maximum payout for Scorecard LTI is 300% of target LTI.
The Remuneration Committee believes that the Scorecard LTI continues to be an appropriate component of its LTI Plan because it:
| • | allows the Remuneration Committee to set targets for and reward executives on a balance of longer-term financial, strategic, business, customer and organizational development goals which it believes are important contributors to long-term creation of shareholder value; |
| • | ties the reward’s value to our share price over the medium-term; and |
| • | allows flexibility to apply rewards across different countries, while providing Senior Executive Officers with liquidity to pay tax or other material commitments at a time that coincides with vesting of shares (via the other components of the LTI Plan) as payment is in cash. |
No specific weighting is applied to any single objective and the final Scorecard assessment reflects an element of judgment by the Board. The Board may only exercise negative discretion (i.e., to reduce the amount of Scorecard LTI that will ultimately vest). It cannot enhance the maximum reward that can be received.
| James Hardie 2016 Annual Report on Form 20-F | 47 |
The amount received by Senior Executive Officers is based on both our share price performance over the three years from the grant date and the Senior Executive Officer’s Scorecard rating. At the start of the three-year performance period, we calculate the number of shares each Senior Executive Officer could have acquired if they received a maximum payout on the Scorecard LTI at that time (based on a 20 trading-day average closing price). Depending on the Senior Executive Officer’s rating (between 0 and 100), between 0% and 100% of the Senior Executive Officer’s Scorecard LTI awards will vest at the end of the three-year performance period. Each Senior Executive Officer will receive a cash payment based on our share price at the end of the period (based on a 20 trading-day average closing price) multiplied by the number of shares they could have acquired at the start of the performance period, adjusted downward in accordance with their Scorecard rating.
Further details related to the Scorecard for fiscal year 2016, including the method of measurement, historical performance against the proposed measures and the Board of Director’s expectations, were previously set out in our Remuneration Report for the fiscal year ended 31 March 2015. An assessment of our Scorecard performance for fiscal years 2014-2016 is set out below. We will provide an explanation of the final assessment of performance under the Scorecard for fiscal years 2016-2018 at the conclusion of fiscal year 2018.
Scorecard LTI for Fiscal Years 2014-2016
After fiscal year 2016, the Remuneration Committee reviewed our performance over fiscal years 2014-2016 against the Scorecard objectives set forth in fiscal year 2014, and the contribution of individual Senior Executive Officers towards the obtainment of such objectives. As a result of this evaluation, the Remuneration Committee determined that Senior Executive Officers received a weighted average Scorecard rating of 67.5% (with a range of 58% to 69%).
| Performance Measure/ Rationale | Performance Metric/Results | Board Assessment | ||
| Grow exterior cladding market share and maintain category share in the US business
A key strategy for JH is to maximize its market share growth/ retention of the exterior cladding market for new housing starts and for Repair & Remodel markets. |
Goal: PDG above market. Outperformance against ‘wood-look’ competition.
Result: PDG performance above the Board requirement. Growth above key competition and slight increase in exterior cladding market share. |
Performance exceeded expectations | ||
| Build US organizational and leadership capability in support of the 35/90 growth target | Goal: Satisfactory progress on turnover and engagement initiatives capability build demonstrated by greater bench strength of high performing managers. | Performance below expectations
| ||
| The amount of growth that 35/90 entails requires lower turnover levels and an increase in management depth and organizational capability. | Result: No improvement on average turnover during the three-year period. The business has benefitted from recruiting programs, career development and mentoring and leadership programs that are part of the talent management and development initiatives. Bench strength and overall organizational capability build has not kept pace with internal demand for talent. |
| James Hardie 2016 Annual Report on Form 20-F | 48 |
| Performance Measure/ Rationale | Performance Metric/Results | Board Assessment | ||
| Manufacturing capacity planning and sourcing efficiency | Goal: Commercial-in-confidence metrics for product and process efficiency and material yield used to confirm manufacturing performance and progress is effectively supporting our product leadership strategy. | Performance exceeded expectations | ||
| The Company operates a national US network of manufacturing facilities. | Result: Product and process efficiency above Board expectations for the three year period, material yield remained flat. | |||
| Safety | Goal: No fatalities, 2.0 or below incident rate (“IR”) and 20.0 or below severity rate (“SR”). | Performance below expectations
| ||
| The safety of our employees is an essential objective of the Company. | Result: IR SR | |||
| FY16 1.8 42.4 FY15 1.3 11.0 FY14 1.3 23.4 |
||||
| Effectively Manage Legacy Issues | Goal: Make acceptable progress on resolving or addressing issues. | Performance exceeded expectations | ||
| Minimize financial and market position impact of legacy issues. | Result: Very positive progress on legacy issues over the three-year period with minimal impact or distraction on the business. | |||
| Maintain market position on core products in Australian and NZ Markets and grow Scyon to greater proportion of Australian business |
Goal: Maintain or grow category share on core Australian and New Zealand products, achieve PDG in Australia and New Zealand and achieve growth of Scyon percentage of Australian business. | Performance met expectations | ||
| Value creating opportunity. | Result: Category share and PDG in Australia and New Zealand, as well as Scyon growth, met Board expectations for the three-year period. | |||
| Australian capacity expansion | Goal: Completion of building construction, equipment installation and commissioning of Carole Park expansion. | Performance below expectations | ||
| The expansion will support expected growth over the next 20 years. | Result: Carole Park expansion complete, but start-up behind initial plan and spend was above budget. Production volumes at or above start-up expectations for most products. |
| James Hardie 2016 Annual Report on Form 20-F | 49 |
CHANGES TO REMUNERATION FOR FISCAL YEAR 2017
Remuneration for Fiscal Year 2017
During May 2016, the Board, with the assistance of the Remuneration Committee and its independent remuneration advisers, undertook its annual review of our existing remuneration policies, programs and arrangements and determined to implement certain changes for fiscal year 2017.
CEO Compensation
For fiscal year 2017, there will be no changes to the CEO’s base salary, target STI or target LTI.
Other Senior Executive Officer Compensation
Base pay, target STI and target LTI increases in fiscal year 2017 for other Senior Executive Officers are as follows:
| Base Salary | Target STI | Target LTI | ||||||||||||||||||||||
| Name | Fiscal Year 2016 (US$) |
Fiscal Year 2017 (US$) |
Fiscal Year 2016 |
Fiscal Year 2017 |
Fiscal Year 2016 (US$) |
Fiscal Year 2017 (US$) |
||||||||||||||||||
| M Marsh |
520,000 | 560,000 | 60 | % | 70 | % | 900,000 | 1,200,000 | ||||||||||||||||
| R Sullivan |
520,000 | 600,000 | 60 | % | 80 | % | 900,000 | 1,500,000 | ||||||||||||||||
| M Fisher |
500,000 | 515,000 | 60 | % | 60 | % | 650,000 | 650,000 | ||||||||||||||||
| J Blasko |
380,000 | 405,000 | 60 | % | 60 | % | 400,000 | 450,000 | ||||||||||||||||
Base salary, STI target and LTI target increases for Messrs Marsh and Sullivan were made to properly align their base salaries with the increase in role scope and accountability that occurred for each during fiscal year 2016 in addition to better align their overall compensation practices with (i) our CEO succession plan, (ii) our need to retain key senior executives through the eventual CEO transition process, (iii) our lean management structure, and (iv) the 75th percentile of our Peer Group LTI values, consistent with our remuneration philosophy.
Base salary increases for Messrs Fisher and Blasko were made in line with our annual compensation review guidelines and were adjusted as required to maintain positioning relative to market merit increase levels. The small increase to Messr Blasko’s LTI target was made to better align his LTI target value with the 75th percentile of our Peer Group, consistent with our remuneration philosophy.
STI Plans
There will be no changes to the operation of the IP or CP Plans for fiscal year 2017 other than to establish new commercial-in-confidence targets aligned with our strategic initiatives as we do every year.
| James Hardie 2016 Annual Report on Form 20-F | 50 |
LTI Plan
The Board and Remuneration Committee feel the current LTI Plan is having the desired effect of balancing the short-term focus of base salaries and STI program by tying equity-based rewards to performance achieved over multi-year periods and aligning equity incentives with long-term shareholder interests. Additionally, management understands the current plan and continues to be motivated by it. As such, the fiscal year 2017 LTI Plan is consistent with the plan for fiscal year 2016, with only minor updates to ROCE RSU hurdles and Scorecard objectives.
The 2016 Notice of Annual General Meeting will contain further details on the relative TSR RSU and ROCE RSU grants for fiscal year 2017. Changes to ROCE performance hurdles and Scorecard objectives for fiscal year 2017 are set forth below.
Changes to LTI Variable Compensation for Fiscal Year 2017
ROCE RSUs
The hurdles for ROCE RSUs to be granted in fiscal year 2017 (for performance in fiscal years 2017 to 2019) were increased from the hurdles for ROCE RSUs granted in fiscal year 2016 as follows:
| Fiscal Years 2017-2019 ROCE |
Fiscal Years 2016-2018 ROCE |
% of ROCE RSUs to vest | ||
| < 24.0% |
< 23.0% | 0% | ||
| ³ 24.0%, but < 26.0% |
³ 23.0%, but < 25.0% | 25% | ||
| ³ 26.0%, but < 28.5% |
³ 25.0%, but < 27.5% | 50% | ||
| ³ 28.5%, but < 29.5% |
³ 27.5%, but < 28.5% | 75% | ||
| ³ 29.5% |
³ 28.5% | 100% |
For fiscal year 2016, the Board has increased the threshold, target and maximum ROCE performance hurdles, thereby making it more difficult to achieve minimum, at target and maximum vesting. The Board believes this increase in performance hurdles is appropriate given the recovering housing market in the US and better optimization of manufacturing plants.
Scorecard LTI
The Remuneration Committee uses the Scorecard to set strategic objectives for which performance can only be assessed over a period of time. These objectives change from year-to-
| James Hardie 2016 Annual Report on Form 20-F | 51 |
year in line with our strategic priorities. For fiscal year 2017, the Remuneration Committee has set the following seven Scorecard goals:
| Performance Goal/ Rationale | Performance Metric | Board Expectation | ||
| Grow exterior cladding market share and maintain category share in the US business
A key strategy for us is to maximize our market share growth/retention of the exterior cladding market for new housing starts and for repair and remodel markets. |
Our PDG performance for exterior cladding compared to the underlying market (in standard feet) and outperformance of key competition. | PDG growth above market and outperformance against key competition. | ||
| Interiors Market Strategy Implementation
Necessary to sustain interiors business revenue and EBIT, and grow beyond the Company’s current market position. |
PDG together with the entry into adjacent markets. The latter achievement can include developing new technologies, expanding into new product categories or the acquisition of new technologies. | PDG growth above market and technology and/or product adjacent to existing markets identified and in process of development. | ||
| Build US Organizational and Leadership Capability in Support of the “35/90” Growth Target
In order to achieve 35/90, we will require lower turnover levels and an increase in management depth and organizational capability. |
A range of factors including the rate of salaried voluntary turnover, execution of programs to build organizational capability and bench strength for key roles. | Continued focus on turnover and engagement initiatives, success in external recruitment, onboarding of key positions, programs to build organizational capability, and development of/successful execution on a management team succession plan. | ||
| Safety
The safety of all employees is an essential objective of the Company. |
Incident Rate (IR): Recordable incidents per 200,000 hours worked.
Severity Rate (SR): Days lost per 200,000 hours worked. |
Zero fatalities.
IR: 2.0 or below.
SR: 20.0 or below. | ||
| Pursue Organic Growth in All Asia Pacific Markets and Grow Scyon and New Products to Greater Proportion of Asia Pacific Business Value creating opportunity. |
Category share and PDG.
Continued growth of Scyon and introduction and growth of new products in Asia Pacific. |
Grow category share on core Australian and New Zealand products.
Grow PDG in Australia and New Zealand.
Achieve growth in Scyon as well as the introduction of new products in Asia Pacific. | ||
| Manufacturing Effectiveness and Sourcing Efficiency
We operate a national US network of manufacturing facilities. |
First pass quality and service, as well as sheet machine product and process efficiency metrics.
Manufacturing performance data is commercial-in-confidence. |
Commercia-in-confidence targets will be reviewed to confirm progress is supporting the Company’s product leadership strategy. | ||
| Define a Clear Vision and Strategy for Non-Fiber Cement Business
Developing sustainable growth beyond the Company’s traditional products may create shareholder value through increased profits and lower risk through diversification. |
This measure is subjective and achievement can take many different forms, including developing a vision or business development framework, new technologies, or expanding into new product categories. | Progress against this goal will be reviewed to ensure any progress is supporting the Company’s position in the non-fiber cement marketplace. |
| James Hardie 2016 Annual Report on Form 20-F | 52 |
EXECUTIVE COMPENSATION PRACTICES
Clawback Provisions
The Remuneration Committee has established an executive performance-based compensation clawback policy in connection with performance-based compensation paid or awarded to certain executives. The clawback policy provides that the Board may, in all appropriate circumstances, recover from any current or former executive regardless of fault, that portion of any performance-based compensation erroneously awarded: (i) based on financial information required to be reported under applicable US or Australian securities laws or applicable exchange listing standards that would not have been paid in the three completed fiscal years preceding the year(s) in which an accounting restatement is required to correct a material error; or (ii) during the previous three completed fiscal year as a result of any errors or omissions in objective, calculable performance measures contained in formal papers presented to and relied upon by the Board for purposes of determining compensation to be paid or awarded, where the absence of such errors or omissions would have resulted in there being a material negative impact on the amount of performance-based compensation paid or awarded.
The clawback policy applies to any person designated as a participant by the Board in the annual LTI Plan and applies to any compensation that is granted, earned or vested based wholly or in part upon the attainment of any financial or other objective, calculable performance measure under any incentive, bonus, retirement or equity compensation plan maintained by the Company, including, without limitation, the STI Plan and LTI Plan. Salaries, discretionary bonuses, time-based equity awards and bonuses or equity awards based on subjective, non-financial measures, including strategic or personal performance metrics, are excluded.
The excess compensation requiring recovery shall be the amount of performance-based compensation that an executive received, based on the erroneous data, less the amount that would have been paid to the executive based on the restated or corrected data. All recoverable amounts shall be calculated on a pre-tax basis. For equity awards still held at the time of the recovery, the recoverable amount shall be the amount vested in excess of the number that should have vested under the restated or corrected financial reporting measure. For vested equity awards which have already been sold, the recoverable amount shall be the sale proceeds the executive received with respect to the excess number of shares.
In addition, all LTI grants made to Messrs Gries, Sullivan, Marsh and Fisher are subject to clawback provisions (either in their respective employment agreement or award grant documents) for violation of a limited non-compete provision that specifically prohibits executives from working for designated competitors or for any company that may enter the fiber cement market within two years of departure.
Stock Ownership Guidelines
The Remuneration Committee believes that Senior Executive Officers should hold a meaningful level of our stock to further align their interests with those of our shareholders. We have adopted stock ownership guidelines for the CEO and other Senior Executive Officers, respectively, which require them to accumulate holdings of three times and one times their base salary, respectively, in our stock over a period of five years from the effective date of the guidelines (1 April 2009) or the date the Senior Executive Officer first becomes subject to the applicable guideline.
| James Hardie 2016 Annual Report on Form 20-F | 53 |
Until the stock ownership guidelines have been met, Senior Executive Officers are required to retain at least 75% of shares obtained under our LTI Plans (net of taxes and other costs). Once Senior Executive Officers have met or exceeded their stock ownership guidelines, they are required to retain at least 25% of shares issued under our LTI Plans through the vesting of RSUs (net of taxes and other costs) for a period of two years (by way of a holding lock), after which time those shares can be sold (provided the Senior Executive Officer remains at or above the stock ownership guideline).
The CEO’s holdings have exceeded the stock ownership guidelines for some years. All other Senior Executive Officers are tracking toward achievement of the minimum share accumulation threshold in accordance with the timeframe specified.
Equity Award Practices
Annual equity awards under the LTI Plan are generally approved by the Remuneration Committee in May of each year with awards generally issued in September of each year. We do not time the granting of equity awards to the disclosure of material information.
For details of the application of our insider-trading policy for equity award grant participants, including our prohibition on employee hedging transactions, see the “Insider Trading” section of this Annual Report.
Loans
We did not grant loans to Senior Executive Officers during fiscal year 2016. There are no loans outstanding to Senior Executive Officers.
EMPLOYMENT AND SEVERANCE ARRANGEMENTS
We maintain employment agreements with Messrs Gries, Sullivan, Marsh and Fisher, the material terms of which are outlined below. Other than as provided under the terms of their respective employment agreements, no other termination payments are payable, except as required under the terms of the applicable STI or LTI plans.
Employment Agreement with Louis Gries
Below is a summary of the key terms of Mr Gries’ current employment agreement:
| • | Executive Employment Agreement renewed effective as of 14 October 2010 providing for service as Chief Executive Officer. |
| • | Mr Gries is an employee-at-will and either he or the Company may terminate his employment at any time or any reason. |
| • | Base salary at an initial annual rate of US$950,000, subject to annual review and approval by Remuneration Committee. |
| • | Participation in Company’s annual STI and LTI Plans, with a minimum STI target of 100% of his annual base salary, as established by the Company’s Board. |
| • | Participation in the Company’s benefit, health and welfare plans and certain fringe benefits made generally available to Senior Executive Officers in accordance with his agreement and Company policies. |
| • | Provisions concerning consequences of termination of employment under specified circumstances, including: (i) termination by the Company for cause; (ii) termination by |
| James Hardie 2016 Annual Report on Form 20-F | 54 |
| reason of death or disability; (iii) retirement; (iv) termination by the Company without cause or by Mr Gries with good reason; or (v) termination by Mr Gries without good reason. |
| • | In the event that Mr Gries’ employment is terminated by the Company for any reason other than for cause, or if Mr Gries voluntarily terminates his employment for good reason, the Company shall pay to Mr Gries, in addition to any compensation or reimbursements he would otherwise be entitled to up to the date of termination: (i) an amount equal to 150% of his then current base salary; (ii) an amount equal to 150% of his average annual STI bonus actually paid, calculated based on the three full fiscal years immediately preceding the year of termination; (iii) his prorated bonus; (iv) no pro rata forfeiture of his unvested RSUs/Scorecard LTI grants – these will vest in accordance with the terms and timing of the specific grants; and (v) continuation of health and medical benefits at the Company’s expense for the duration of the consultation agreement referenced below, provided that Mr Gries signs the Company’s release of claims without revocation and has been and continues to remain in compliance with his confidentiality and noncompetition obligations as set forth in this agreement. |
| • | In the event of Mr Gries’ retirement after the age of 65, or prior to age 65 with the approval of the Board, his then unvested RSUs and awards will not be forfeited and will be held through the applicable testing periods. |
| • | In the event that Mr Gries’ employment is terminated for any reason other than by the Company for cause or due to his death, in addition to any severance payment he may be entitled to as set forth above, the Company and Mr Gries each agree to enter into a consulting arrangement for a minimum of two years, as long as Mr Gries adheres to certain non-competition and confidentiality provisions and executes a release of claims following the effective date of termination. Under the consulting agreement, Mr Gries will receive his annual target STI bonus and annual base salary in exchange for his consulting services and non-compete. |
Employment Agreement with Ryan Sullivan
Below is a summary of the key terms of Mr Sullivan’s employment agreement:
| • | Effective 15 May 2016, the Company entered into an employment agreement with Mr Sullivan (the “Sullivan Agreement”), which has an initial term of three years and automatic one year renewals thereafter unless either Mr Sullivan or the Company notifies the other party at least 90 days before the expiration date that the Sullivan Agreement is not to be renewed. In the event that the Company is the party that determines not to renew, such non-renewal shall be treated as a termination without “Cause” (as defined in the Sullivan Agreement) and subject to the termination without “Cause” provisions of the Sullivan Agreement. |
| • | The Sullivan Agreement provide for a base salary of not less than US$600,000 for Mr Sullivan, which shall be reviewed annually for increase in the discretion of the Remuneration Committee. Additionally, Mr Sullivan shall be eligible for an annual STI award with payout opportunities that are commensurate with his position and duties, with a minimum target annual STI award opportunity of not less than 80% of this the current base salary. Mr Sullivan shall also be eligible to participate in our annual LTI plan on terms commensurate with his position and duties, with a minimum annual target LTI award opportunity of not less than US$1,500,000. |
| James Hardie 2016 Annual Report on Form 20-F | 55 |
| • | Mr Sullivan shall be eligible for participation in our employee benefit, health and welfare plans and certain fringe benefits made generally available to Senior Executive Officers in accordance with Company policies. |
| • | The Sullivan Agreement contains provisions concerning the consequences of termination of employment under specified circumstances, including: (i) termination by the Company for Cause; (ii) termination by reason of death or disability; (iii) termination by the Company without Cause or by Mr Sullivan with Good Reason; or (iv) termination by Mr Sullivan without good reason. In particular, in the event the Company terminates Mr Sullivan without Cause or Mr Sullivan voluntarily terminates for Good Reason, Mr Sullivan shall be entitled to: (i) a lump-sum amount equal to his unpaid base salary through and including the date of termination, as well as accrued, unused vacation pay and unreimbursed business expenses; (ii) a payment for any earned but unpaid annual incentive award for a completed calendar year prior to the date of termination; (iii) salary continuation for the two year period following the date of termination, provided the aggregate amount of such continuation payments shall be equal to the sum of (A) two times the base salary plus (B) one times the annual incentive award opportunity, as then in effect; (iv) an amount, if any, with respect to the annual incentive award opportunity for the year in which such termination of employment occurs, as determined under the terms and conditions of the Company’s annual incentive program(s); (v) all outstanding equity awards will remain subject to the terms and conditions of the applicable equity incentive plan and any corresponding award agreement(s); (vi) monthly payments for a period of 18 months equal to the premium Mr Sullivan would be required to pay for COBRA continuation coverage under the James Hardie’s health benefit plans, determined using the COBRA premium rate in effect for the level of coverage that Mr Sullivan has in place immediately prior to termination; and (vii) the Company will assist Mr Sullivan in finding other employment opportunities by providing to him, at James Hardie’s limited expense, reasonable professional outplacement services through the provider of the James Hardie’s choice for a period of up to 24 months. |
| • | Pursuant to the confidentiality, non-competition and non-solicitation provisions of the Sullivan Agreement, for a period of 24 months following any termination of Mr Sullivan’s employment, Mr Sullivan shall be prohibited from: (i) directly or indirectly acting, engaging in, have a financial or other interest in, or otherwise serving as an employee, agent, partner, shareholder, director, or consultant for certain designated competitors of the Company; and (ii) employing or retaining or soliciting for employment any person who is an employee or consultant of the Company or soliciting suppliers or customers of the Company or inducing any such person to terminate his, her, or its relationship with the Company. |
Employment Agreement with Matthew Marsh
Below is a summary of the key terms of Mr Marsh’s current employment agreement:
| • | Effective 15 May 2016, the Company entered into an employment agreement with Mr Marsh (the “Marsh Agreement”), which has an initial term of three years and automatic one year renewals thereafter unless either Mr Marsh or the Company notifies the other party at least 90 days before the expiration date that the Marsh Agreement is not to be renewed. In the event that the Company is the party that determines not to renew, such non-renewal shall be treated as a termination without “Cause” (as defined in the Marsh Agreement) and subject to the termination without “Cause” provisions of the Marsh Agreement. |
| • | The Marsh Agreement provide for a base salary of not less than US$560,000 for Mr Marsh, which shall be reviewed annually for increase in the discretion of the Remuneration |
| James Hardie 2016 Annual Report on Form 20-F | 56 |
| Committee. Additionally, Mr Marsh shall be eligible for an annual STI award with payout opportunities that are commensurate with his position and duties, with a minimum target annual STI award opportunity of not less than 70% of this the current base salary. Mr Marsh shall also be eligible to participate in our annual LTI plan on terms commensurate with his position and duties, with a minimum annual target LTI award opportunity of not less than US$1,200,000. |
| • | Mr Marsh shall be eligible for participation in our employee benefit, health and welfare plans and certain fringe benefits made generally available to Senior Executive Officers in accordance with Company policies. |
| • | The Marsh Agreement contains provisions concerning the consequences of termination of employment under specified circumstances, including: (i) termination by the Company for Cause; (ii) termination by reason of death or disability; (iii) termination by the Company without Cause or by Mr Marsh with Good Reason; or (iv) termination by Mr Marsh without good reason. In particular, in the event the Company terminates Mr Marsh without Cause or Mr Marsh voluntarily terminates for Good Reason, Mr Marsh shall be entitled to: (i) a lump-sum amount equal to his unpaid base salary through and including the date of termination, as well as accrued, unused vacation pay and unreimbursed business expenses; (ii) a payment for any earned but unpaid annual incentive award for a completed calendar year prior to the date of termination; (iii) salary continuation for the two year period following the date of termination, provided the aggregate amount of such continuation payments shall be equal to the sum of (A) two times the base salary plus (B) one times the annual incentive award opportunity, as then in effect; (iv) an amount, if any, with respect to the annual incentive award opportunity for the year in which such termination of employment occurs, as determined under the terms and conditions of the Company’s annual incentive program(s); (v) all outstanding equity awards will remain subject to the terms and conditions of the applicable equity incentive plan and any corresponding award agreement(s); (vi) monthly payments for a period of 18 months equal to the premium Mr Marsh would be required to pay for COBRA continuation coverage under the James Hardie’s health benefit plans, determined using the COBRA premium rate in effect for the level of coverage that Mr Marsh has in place immediately prior to termination; and (vii) the Company will assist Mr Marsh in finding other employment opportunities by providing to him, at James Hardie’s limited expense, reasonable professional outplacement services through the provider of the James Hardie’s choice for a period of up to 24 months. |
| • | Pursuant to the confidentiality, non-competition and non-solicitation provisions of the Marsh Agreement, for a period of 24 months following any termination of Mr Marsh’s employment, Mr Marsh shall be prohibited from: (i) directly or indirectly acting, engaging in, have a financial or other interest in, or otherwise serving as an employee, agent, partner, shareholder, director, or consultant for certain designated competitors of the Company; and (ii) employing or retaining or soliciting for employment any person who is an employee or consultant of the Company or soliciting suppliers or customers of the Company or inducing any such person to terminate his, her, or its relationship with the Company. |
Employment Agreement with Mark Fisher
Below is a summary of the key terms of Mr Fisher’s current employment agreement:
| • | Executive Employment Agreement effective as of 31 March 2006. |
| • | Mr Fisher is an employee-at-will and either he or the Company may terminate his employment at any time or for any reason. |
| James Hardie 2016 Annual Report on Form 20-F | 57 |
| • | Base salary subject to annual review and approval by Remuneration Committee. |
| • | Participation in Company’s annual STI and LTI Plans, as established by the Company’s Board. |
| • | Participation in the Company’s benefit, health and welfare plans and certain fringe benefits made generally available to Senior Executive Officers in accordance with Company policies. |
| • | Provisions concerning consequences of termination of employment under specified circumstances, including: (i) termination by the Company for cause; (ii) termination by reason of death or disability; (iii) termination by the Company without cause or by Mr Fisher with good reason; or (iv) termination by Mr Fisher without good reason. |
| • | In the event that Mr Fisher’s employment is terminated by the Company for any reason other than for cause or due to his death or if Mr Fisher voluntarily terminates his employment for good reason, in addition to any compensation or reimbursements he would otherwise be entitled to up to the date of termination, the Company and Mr Fisher each agree to enter into a consulting arrangement for a minimum of two years, as long as Mr Fisher adheres to certain non-competition and confidentiality provisions and executes a release of claims following the effective date of termination. Under the consulting agreement, Mr Fisher will receive his annual base salary as of the termination date for each year in exchange for his consulting services and non-compete. |
REMUNERATION PAID TO SENIOR EXECUTIVE OFFICERS
Total Remuneration for Senior Executive Officers
Details of the remuneration for Senior Executive Officers in fiscal years 2016 and 2015 are set out below:
| (US dollars) | Primary | Post- employment |
Equity Awards | TOTAL | ||||||||||||||||||||||||
| Name | Base Pay | STI Award2 | Other Benefits3 |
401(k) | Ongoing Vesting4 |
Mark-to Market5 |
||||||||||||||||||||||
| L Gries1 |
||||||||||||||||||||||||||||
| Fiscal Year 2016 |
950,000 | 2,424,875 | 134,174 | 15,919 | 6,283,244 | 1,228,260 | 11,036,472 | |||||||||||||||||||||
| Fiscal Year 2015 |
950,000 | 3,206,250 | 156,059 | 15,440 | 8,319,665 | (908,777 | ) | 11,738,637 | ||||||||||||||||||||
| M Marsh |
||||||||||||||||||||||||||||
| Fiscal Year 2016 |
513,846 | 637,104 | 49,233 | 16,177 | 965,366 | 67,910 | 2,249,636 | |||||||||||||||||||||
| Fiscal Year 2015 |
493,846 | 810,000 | 47,903 | 15,877 | 619,567 | (48,658 | ) | 1,938,535 | ||||||||||||||||||||
| R Sullivan |
||||||||||||||||||||||||||||
| Fiscal Year 2016 |
489,231 | 673,023 | 70,796 | 10,085 | 770,382 | 58,778 | 2,072,295 | |||||||||||||||||||||
| Fiscal Year 2015 |
392,308 | 680,400 | 54,687 | 16,846 | 475,721 | (50,189 | ) | 1,569,773 | ||||||||||||||||||||
| M Fisher |
||||||||||||||||||||||||||||
| Fiscal Year 2016 |
496,923 | 597,600 | 36,657 | 16,038 | 753,040 | 126,265 | 2,026,523 | |||||||||||||||||||||
| Fiscal Year 2015 |
486,923 | 779,100 | 39,887 | 15,738 | 835,874 | (106,421 | ) | 2,051,101 | ||||||||||||||||||||
| J Blasko |
||||||||||||||||||||||||||||
| Fiscal Year 2016 |
373,846 | 454,176 | 56,987 | 16,177 | 485,451 | 88,935 | 1,475,572 | |||||||||||||||||||||
| Fiscal Year 2015 |
350,769 | 561,600 | 48,223 | 16,015 | 569,377 | (80,719 | ) | 1,465,265 | ||||||||||||||||||||
| TOTAL |
||||||||||||||||||||||||||||
| Fiscal Year 2016 |
2,823,846 | 4,786,778 | 347,847 | 74,396 | 9,257,483 | 1,570,148 | 18,860,498 | |||||||||||||||||||||
| Fiscal Year 2015 |
2,673,846 | 6,037,350 | 346,759 | 79,916 | 10,820,204 | (1,194,764 | ) | 18,763,311 | ||||||||||||||||||||
| James Hardie 2016 Annual Report on Form 20-F | 58 |
| 1 | L Gries base pay includes US$170.184 and US$161,449 in fiscal years 2016 and 2015, respectively, which is allocated for tax purposes to his services on the Company’s Board. |
| 2 | For further details on STI awards paid for fiscal years 2016 and 2015, see page 41 of this Remuneration Report. Amounts reflect actual STI awards to be paid in June 2016 and paid in June 2015, for fiscal years 2016 and 2015, respectively. |
| 3 | Includes the aggregate amount of all other benefits received in the year indicated. Examples of benefits that may be received include medical and life insurance benefits, car allowances, membership in executive wellness programs, and financial planning and tax services. |
| 4 | Includes equity award expense for grants of Scorecard LTI awards, relative TSR RSUs and ROCE RSUs. Relative TSR RSUs are valued using a Monte Carlo simulation method. ROCE RSUs and Scorecard LTI awards are valued based on the Company’s share price at each balance date as well as the Remuneration Committee’s current expectation of the percentage of the RSUs or awards which will vest. The fair value of equity awards granted are included in compensation during the period in which the equity awards vest. For ROCE RSUs and Scorecard LTI awards, this amount excludes the equity award expense in fiscal years 2016 and 2015 resulting from changes in the Company’s share price, which is disclosed separately in the Equity Awards “Mark-to-Market” column. |
| 5 | The amount included in this column is the equity award expense in relation to ROCE RSUs and Scorecard LTI awards resulting solely from changes in the US dollar share price during fiscal years 2016 and 2015. During fiscal year 2016, there was a 17.4% appreciation in our share price from US$11.65 to US$13.68, as a result of changes in the AUD/USD exchange rate. During fiscal year 2015, there was an 11.8% depreciation in our share price from US$13.21 to US$11.65. |
Variable Remuneration Payable in Future Years
Details of the accounting cost of the variable remuneration for fiscal year 2016 that may be paid to Senior Executive Officers in future years are set out below. The minimum amount payable is nil in all cases. The maximum amount payable will depend on the share price at time of vesting, and is therefore not possible to determine. The table below is based on the fair value of the RSUs and Scorecard LTI according to US generally accepted accounting standards and our estimate of the rating to be applied to Scorecard LTI.
| Scorecard LTI¹ (US dollars) |
ROCE RSUs² (US dollars) |
Relative TSR RSUs³ (US dollars) |
||||||||||||||||||||||||||||||||||||||||||||||||||
| FY2016 | FY2017 | FY2018 | FY2019 | FY2016 | FY2017 | FY2018 | FY2019 | FY2016 | FY2017 | FY2018 | FY2019 | |||||||||||||||||||||||||||||||||||||||||
| L Gries |
468,721 | 868,443 | 868,443 | 404,480 | 312,481 | 578,962 | 578,962 | 269,653 | 439,296 | 813,923 | 813,923 | 381,317 | ||||||||||||||||||||||||||||||||||||||||
| M Marsh |
105,461 | 195,397 | 195,397 | 91,007 | 70,308 | 130,266 | 130,266 | 60,672 | 98,842 | 183,134 | 183,134 | 85,797 | ||||||||||||||||||||||||||||||||||||||||
| R Sullivan |
105,461 | 195,397 | 195,397 | 91,007 | 70,308 | 130,266 | 130,266 | 60,672 | 98,842 | 183,134 | 183,134 | 85,797 | ||||||||||||||||||||||||||||||||||||||||
| M Fisher |
76,165 | 141,119 | 141,119 | 65,726 | 50,777 | 94,079 | 94,079 | 43,818 | 71,385 | 132,261 | 132,261 | 61,963 | ||||||||||||||||||||||||||||||||||||||||
| J Blasko |
46,872 | 86,844 | 86,844 | 40,448 | 31,248 | 57,896 | 57,896 | 26,965 | 43,929 | 81,391 | 81,391 | 38,131 | ||||||||||||||||||||||||||||||||||||||||
|
|
|
|
|
|
|
|
|
|
|
|
|
|
|
|
|
|
|
|
|
|
|
|
|
|||||||||||||||||||||||||||||
| 802,680 | 1,487,200 | 1,487,200 | 692,668 | 535,122 | 991,469 | 991,469 | 461,780 | 752,294 | 1,393,843 | 1,393,843 | 653,005 | |||||||||||||||||||||||||||||||||||||||||
|
|
|
|
|
|
|
|
|
|
|
|
|
|
|
|
|
|
|
|
|
|
|
|
|
|||||||||||||||||||||||||||||
| 1 | Represents annual SG&A expense for Scorecard LTI granted in September 2015. The fair value of each award is adjusted for changes in our common stock price at each balance sheet date until the final Scorecard rating is applied in September 2018, at which time the final value is based on our share price and the Senior Executive Officers Scorecard rating at the time of vesting. |
| 2 | Represents annual SG&A expense for the ROCE RSUs granted in September 2015. The fair value of each RSU is adjusted for changes in our common stock price at each balance sheet date until September 2018 when ROCE results are known and the Remuneration Committee makes a determination on the amount of negative discretion to be applied and some, all or none of the awards become vested. |
| 3 | Represents annual SG&A expense for the relative TSR RSUs granted in September 2015 with fair market value estimated using the Monte Carlo option-pricing method. |
| James Hardie 2016 Annual Report on Form 20-F | 59 |
OUTSTANDING EQUITY AWARDS HELD BY SENIOR EXECUTIVE OFFICERS
The following tables set forth information regarding outstanding equity awards held by our Senior Executive Officers as of 30 April 2016.
Options
As at 30 April 2016, no Senior Executive Officers held stock options.
Restricted Stock Units
| Name | Grant Date |
Release Date |
Holding and Unvested at 1 April 2015 |
Granted | Total Value at Grant¹ (US$) |
Vested | Lapsed | Holding and Unvested at 30 April 2016 |
Fair Value per RSU2 (US$) |
|||||||||||||||||||||||||||
| L Gries |
15-Sep-10 | 3 | 15-Sep-13 | 128,405 | 577,255 | $ | 2,595,627 | (128,405 | ) | - | - | $ | 4.4965 | |||||||||||||||||||||||
| 15-Sep-11 | 3 | 15-Sep-14 | 406,591 | 606,852 | $ | 2,500,291 | (123,603 | ) | - | 282,988 | $ | 4.1201 | ||||||||||||||||||||||||
| 14-Sep-12 | 3 | 14-Sep-15 | 273,732 | 273,732 | $ | 2,041,356 | (210,773 | ) | - | 62,959 | $ | 7.4575 | ||||||||||||||||||||||||
| 14-Sep-12 | 4 | 14-Sep-15 | 284,916 | 284,916 | $ | 2,697,385 | (227,932 | ) | (56,984 | ) | - | $ | 9.4673 | |||||||||||||||||||||||
| 16-Sep-13 | 3 | 16-Sep-16 | 295,824 | 295,824 | $ | 1,994,593 | - | - | 295,824 | $ | 6.7425 | |||||||||||||||||||||||||
| 16-Sep-13 | 4 | 16-Sep-16 | 278,393 | 278,393 | $ | 2,640,140 | - | - | 278,393 | $ | 9.4835 | |||||||||||||||||||||||||
| 16-Sep-14 | 3,5 | 16-Sep-17 | 260,346 | 260,346 | $ | 1,883,812 | - | - | 260,346 | $ | 7.2358 | |||||||||||||||||||||||||
| 16-Sep-14 | 4 | 16-Sep-17 | 232,980 | 232,980 | $ | 2,607,442 | - | - | 232,980 | $ | 11.1917 | |||||||||||||||||||||||||
| 16-Sep-15 | 3 | 16-Sep-18 | - | 292,514 | $ | 2,448,459 | - | - | 292,514 | $ | 8.3704 | |||||||||||||||||||||||||
| 16-Sep-15 | 4 | 16-Sep-18 | - | 254,480 | $ | 3,227,875 | - | - | 254,480 | $ | 12.6842 | |||||||||||||||||||||||||
| M Marsh |
16-Sep-13 | 3 | 16-Sep-16 | 33,400 | 33,400 | $ | 225,200 | - | - | 33,400 | $ | 6.7425 | ||||||||||||||||||||||||
| 16-Sep-13 | 4 | 16-Sep-16 | 31,431 | 31,431 | $ | 298,076 | - | - | 31,431 | $ | 9.4835 | |||||||||||||||||||||||||
| 16-Sep-13 | 6 | 16-Sep-16 | 56,128 | 56,128 | $ | 482,734 | - | - | 56,128 | $ | 8.6006 | |||||||||||||||||||||||||
| 16-Sep-14 | 3 | 16-Sep-17 | 38,787 | 38,787 | $ | 280,655 | - | - | 38,787 | $ | 7.2358 | |||||||||||||||||||||||||
| 16-Sep-14 | 4 | 16-Sep-17 | 33,283 | 33,283 | $ | 372,493 | - | - | 33,283 | $ | 11.1917 | |||||||||||||||||||||||||
| 16-Sep-15 | 3 | 16-Sep-18 | - | 65,816 | $ | 550,906 | - | - | 65,816 | $ | 8.3704 | |||||||||||||||||||||||||
| 16-Sep-15 | 4 | 16-Sep-18 | - | 57,258 | $ | 726,272 | - | - | 57,258 | $ | 12.6842 | |||||||||||||||||||||||||
| R Sullivan |
15-Sep-11 | 3 | 15-Sep-14 | 11,543 | 17,227 | $ | 70,977 | (3,509 | ) | - | 8,034 | $ | 4.1201 | |||||||||||||||||||||||
| 14-Sep-12 | 3 | 14-Sep-15 | 7,064 | 7,064 | $ | 52,680 | (5,439 | ) | - | 1,625 | $ | 7.4575 | ||||||||||||||||||||||||
| 14-Sep-12 | 4 | 14-Sep-15 | 7,353 | 7,353 | $ | 69,613 | (5,882 | ) | (1,471 | ) | - | $ | 9.4673 | |||||||||||||||||||||||
| 16-Sep-13 | 3 | 16-Sep-16 | 23,857 | 23,857 | $ | 160,856 | - | - | 23,857 | $ | 6.7425 | |||||||||||||||||||||||||
| 16-Sep-13 | 4 | 16-Sep-16 | 22,451 | 22,451 | $ | 212,914 | - | - | 22,451 | $ | 9.4835 | |||||||||||||||||||||||||
| 16-Sep-14 | 3 | 16-Sep-17 | 38,787 | 38,787 | $ | 280,655 | - | - | 38,787 | $ | 7.2358 | |||||||||||||||||||||||||
| 16-Sep-14 | 4 | 16-Sep-17 | 33,283 | 33,283 | $ | 372,493 | - | - | 33,283 | $ | 11.1917 | |||||||||||||||||||||||||
| 16-Sep-15 | 3 | 16-Sep-18 | - | 65,816 | $ | 550,906 | - | - | 65,816 | $ | 8.3704 | |||||||||||||||||||||||||
| 16-Sep-15 | 4 | 16-Sep-18 | - | 57,258 | $ | 726,272 | - | - | 57,258 | $ | 12.6842 | |||||||||||||||||||||||||
| M Fisher |
15-Sep-10 | 3 | 15-Sep-13 | 14,905 | 67,003 | $ | 301,279 | (14,905 | ) | - | - | $ | 4.4965 | |||||||||||||||||||||||
| 15-Sep-11 | 3 | 15-Sep-14 | 45,906 | 68,516 | $ | 282,293 | (13,955 | ) | - | 31,951 | $ | 4.1201 | ||||||||||||||||||||||||
| 14-Sep-12 | 3 | 14-Sep-15 | 30,905 | 30,905 | $ | 230,474 | (23,796 | ) | - | 7,109 | $ | 7.4575 | ||||||||||||||||||||||||
| 14-Sep-12 | 4 | 14-Sep-15 | 32,168 | 32,168 | $ | 304,544 | (25,734 | ) | (6,434 | ) | - | $ | 9.4673 | |||||||||||||||||||||||
| 16-Sep-13 | 3 | 16-Sep-16 | 33,400 | 33,400 | $ | 225,200 | - | - | 33,400 | $ | 6.7425 | |||||||||||||||||||||||||
| 16-Sep-13 | 4 | 16-Sep-16 | 31,431 | 31,431 | $ | 298,076 | - | - | 31,431 | $ | 9.4835 | |||||||||||||||||||||||||
| 16-Sep-14 | 3 | 16-Sep-17 | 38,787 | 38,787 | $ | 280,655 | - | - | 38,787 | $ | 7.2358 | |||||||||||||||||||||||||
| 16-Sep-14 | 4 | 16-Sep-17 | 33,283 | 33,283 | $ | 372,493 | - | - | 33,283 | $ | 11.1917 | |||||||||||||||||||||||||
| 16-Sep-15 | 3 | 16-Sep-18 | - | 47,533 | $ | 397,870 | - | - | 47,533 | $ | 8.3704 | |||||||||||||||||||||||||
| 16-Sep-15 | 4 | 16-Sep-18 | - | 41,353 | $ | 524,530 | - | - | 41,353 | $ | 12.6842 | |||||||||||||||||||||||||
| J Blasko |
14-Sep-12 | 3 | 14-Sep-15 | 22,075 | 22,075 | $ | 164,624 | (16,997 | ) | - | 5,078 | $ | 7.4575 | |||||||||||||||||||||||
| 14-Sep-12 | 4 | 14-Sep-15 | 22,977 | 22,977 | $ | 217,530 | (18,381 | ) | (4,596 | ) | - | $ | 9.4673 | |||||||||||||||||||||||
| 16-Sep-13 | 3 | 16-Sep-16 | 23,857 | 23,857 | $ | 160,856 | - | - | 23,857 | $ | 6.7425 | |||||||||||||||||||||||||
| 16-Sep-13 | 4 | 16-Sep-16 | 22,451 | 22,451 | $ | 212,914 | - | - | 22,451 | $ | 9.4835 | |||||||||||||||||||||||||
| 16-Sep-14 | 3 | 16-Sep-17 | 23,272 | 23,272 | $ | 168,392 | - | - | 23,272 | $ | 7.2358 | |||||||||||||||||||||||||
| 16-Sep-14 | 4 | 16-Sep-17 | 19,970 | 19,970 | $ | 223,498 | - | - | 19,970 | $ | 11.1917 | |||||||||||||||||||||||||
| 16-Sep-15 | 3 | 16-Sep-18 | - | 29,251 | $ | 244,843 | - | - | 29,251 | $ | 8.3704 | |||||||||||||||||||||||||
| 16-Sep-15 | 4 | 16-Sep-18 | - | 25,448 | $ | 322,788 | - | - | 25,448 | $ | 12.6842 | |||||||||||||||||||||||||
| James Hardie 2016 Annual Report on Form 20-F | 60 |
| 1 | Total Value at Grant = Fair Value per RSU multiplied by number of units granted. |
| 2 | Fair Value per RSU is estimated on the date of grant using a binomial lattice model that incorporates a Monte Carlo simulation for Relative TSR RSUs. For ROCE RSUs, the grant date fair value is our stock price on the date of grant. For service vesting RSUs, the fair value is our stock price on the date of grant, adjusted for the fair value of estimated dividends as the RSU holder is not entitled to dividends over the vesting period. |
| 3 | Relative TSR RSUs granted under the LTIP. These RSUs are subject to performance hurdles. |
| 4 | ROCE RSUs granted under the LTIP. These RSUs are subject to performance hurdles and/or application of negative discretion. |
| 5 | Mr Gries was also granted a cash-settled award (equivalent to 11,164 units) on 16 September 2014. This cash-settled award may vest based on the same vesting criteria as his relative TSR RSU grant and may only vest in the event that his relative TSR RSU grant vests in full. Upon vesting, the award will be settled in cash based on the number of units vested and the fair market value of our shares of common stock as of the relevant vesting date. |
| 6 | Time vested RSUs granted under the 2001 JHI plc Equity Incentive Plan (“2001 Plan”). |
Scorecard LTI
| Name | Grant Date |
Release Date |
Holding at 1 April 2015 |
Granted | Vested1 | Lapsed | Holding at 30 April 2016 |
|||||||||||||||||||||
| L Gries |
14-Sep-12 | 14-Sep-15 | 320,531 | 320,531 | (211,550 | ) | (108,981 | ) | - | |||||||||||||||||||
| 16-Sep-13 | 2 | 16-Sep-16 | 313,192 | 313,192 | - | - | 313,192 | |||||||||||||||||||||
| 16-Sep-14 | 16-Sep-17 | 262,103 | 262,103 | - | - | 262,103 | ||||||||||||||||||||||
| 16-Sep-15 | 16-Sep-18 | - | 286,290 | - | - | 286,290 | ||||||||||||||||||||||
| M Marsh |
16-Sep-13 | 2 | 16-Sep-16 | 35,360 | 35,360 | - | - | 35,360 | ||||||||||||||||||||
| 16-Sep-14 | 16-Sep-17 | 37,443 | 37,443 | - | - | 37,443 | ||||||||||||||||||||||
| 16-Sep-15 | 16-Sep-18 | - | 64,415 | - | - | 64,415 | ||||||||||||||||||||||
| R Sullivan |
14-Sep-12 | 14-Sep-15 | 8,272 | 8,272 | (5,459 | ) | (2,813 | ) | - | |||||||||||||||||||
| 16-Sep-13 | 2 | 16-Sep-16 | 25,257 | 25,257 | - | - | 25,257 | |||||||||||||||||||||
| 16-Sep-14 | 16-Sep-17 | 37,443 | 37,443 | - | - | 37,443 | ||||||||||||||||||||||
| 16-Sep-15 | 16-Sep-18 | - | 64,415 | - | - | 64,415 | ||||||||||||||||||||||
| M Fisher |
14-Sep-12 | 14-Sep-15 | 36,189 | 36,189 | (19,903 | ) | (16,286 | ) | - | |||||||||||||||||||
| 16-Sep-13 | 2 | 16-Sep-16 | 35,360 | 35,360 | - | - | 35,360 | |||||||||||||||||||||
| 16-Sep-14 | 16-Sep-17 | 37,443 | 37,443 | - | - | 37,443 | ||||||||||||||||||||||
| 16-Sep-15 | 16-Sep-18 | - | 46,522 | - | - | 46,522 | ||||||||||||||||||||||
| J Blasko |
14-Sep-12 | 14-Sep-15 | 25,849 | 25,849 | (14,216 | ) | (11,633 | ) | - | |||||||||||||||||||
| 16-Sep-13 | 2 | 16-Sep-16 | 25,257 | 25,257 | - | - | 25,257 | |||||||||||||||||||||
| 16-Sep-14 | 16-Sep-17 | 22,466 | 22,466 | - | - | 22,466 | ||||||||||||||||||||||
| 16-Sep-15 | 16-Sep-18 | - | 28,629 | - | - | 28,629 | ||||||||||||||||||||||
| 1 | Represents the number of Scorecard LTI awards vesting after the Remuneration Committee’s application of the scorecard in respect of fiscal years 2013-2015. A detailed assessment of the reasons for the scorecard ratings was set out in the fiscal year 2015 Remuneration Report. |
| 2 | Scorecard LTI awards in respect of fiscal years 2014-2016 will vest on 16 September 2016. A detailed assessment of the Remuneration Committee’s assessment of management’s performance is set out on page XX of this Remuneration Report. |
REMUNERATION FOR NON-EXECUTIVE DIRECTORS
Fees paid to non-executive directors are determined by the Board, with the advice of the Remuneration Committee’s independent external remuneration advisers, within the maximum
| James Hardie 2016 Annual Report on Form 20-F | 61 |
total amount of base and committee fees pool approved by shareholders from time-to-time. Shareholders at the 2014 AGM approved the current maximum aggregate base and committee fee pool of US$2.3 million per annum. No additional Board fees are paid to executive directors.
Remuneration Structure
Non-executive directors are paid a base fee for service on the Board. Additional fees are paid to the person occupying the positions of Chairman, Deputy Chairman and Board Committee Chairman, as well as for attendance at ad-hoc sub-committee meetings.
During fiscal year 2016, the Remuneration Committee reviewed non-executive directors’ fees, using market data and taking into consideration the level of fees paid to chairmen and directors of companies with similar size, complexity of operations and responsibilities and workload requirements. The Remuneration Committee recommended an increase in the non-executive director base fee for calendar year 2016 and the fee increase was effective from the start of the calendar year. The annual fee adjustment when calculated on a fiscal year basis equates to a 10.1% increase in base fee.
The tax equalization allowance, incorporated in the US domiciled chairman, audit committee chair and remuneration committee chair fees for fiscal years 2014, 2015 and 2016, has been discontinued for fiscal year 2017. The purpose of this allowance was to compensate the US domiciled directors for the reduction in net of tax compensation they received as a result of the Company’s re-domicile from the Netherlands to Ireland and this arrangement was concluded in fiscal year 2016.
| Position | Fiscal Year
2016 (US$) |
Fiscal Year
2017 (US$) |
||||||
| Chairman |
464,984 | 402,426 | ||||||
| Deputy Chairman |
227,112 | 244,294 | ||||||
| Board member |
170,184 | 187,366 | ||||||
| Audit Committee Chair |
68,750 | 20,000 | ||||||
| Remuneration Committee Chair |
68,750 | 20,000 | ||||||
| N&GC Committee Chair |
20,000 | 20,000 | ||||||
| Ad-hoc Board sub-committee attendance 1 |
3,000 | 3,000 | ||||||
| 1 | Fee is payable in respect of each ad-hoc Board sub-committee attended. |
During fiscal year 2016, the Remuneration Committee approved a non-executive director tax equalization policy, in order to ensure that the Company continues to attract highly qualified persons to serve on the Board irrespective of their tax residence. In accordance with the policy, the Company will ensure that each non-executive director does not have an increased income tax liability as a direct result of their appointment to the Board. Accordingly, if Irish income taxes levied on their director compensation exceed net income taxes owed on such compensation in their country of tax residence, assuming it had been derived solely in their country of tax residence, such director is eligible to receive a tax equalization payment in respect of that excess.
| James Hardie 2016 Annual Report on Form 20-F | 62 |
As the focus of the Board is on maintaining the Company’s long-term direction and well-being, there is no direct link between non-executive directors’ remuneration and the Company’s short-term results.
Board Accumulation Guidelines
Non-executive directors are encouraged to accumulate up to 1.5 times (and two times for the Chairman) the base fee in shares of the Company’s common stock (either personally, in the name of their spouse, or through a personal superannuation or pension plan). The Remuneration Committee reviews the guidelines and non-executive directors’ shareholdings on a periodic basis.
Director Retirement Benefits
We do not provide any benefits for our non-executive directors upon termination of their service on the Board.
Total Remuneration for Non-Executive Directors for the Years Ended 31 March 2016 and 2015
The table below sets out the remuneration for those non-executive directors who served on the Board during the fiscal years ended 31 March 2016 and 2015:
|
(US dollars) Name |
Primary Directors’ Fees1 |
Other Payments2 | Other Benefits3 | TOTAL | ||||||||||||
| M Hammes |
||||||||||||||||
| Fiscal Year 2016 |
473,984 | 96,047 | 16,740 | 586,771 | ||||||||||||
| Fiscal Year 2015 |
468,754 | - | 15,715 | 484,469 | ||||||||||||
| D McGauchie |
||||||||||||||||
| Fiscal Year 2016 |
232,922 | - | 15,741 | 248,663 | ||||||||||||
| Fiscal Year 2015 |
237,335 | - | 23,444 | 260,779 | ||||||||||||
| B Anderson |
||||||||||||||||
| Fiscal Year 2016 |
244,935 | 72,605 | - | 317,540 | ||||||||||||
| Fiscal Year 2015 |
238,199 | - | - | 238,199 | ||||||||||||
| D Harrison |
||||||||||||||||
| Fiscal Year 2016 |
238,934 | 49,308 | 7,307 | 295,549 | ||||||||||||
| Fiscal Year 2015 |
235,199 | - | 11,991 | 247,190 | ||||||||||||
| A Littley |
||||||||||||||||
| Fiscal Year 2016 |
179,184 | - | - | 179,184 | ||||||||||||
| Fiscal Year 2015 |
167,449 | - | - | 167,449 | ||||||||||||
| J Osborne |
||||||||||||||||
| Fiscal Year 2016 |
179,184 | - | - | 179,184 | ||||||||||||
| Fiscal Year 2015 |
170,449 | - | - | 170,449 | ||||||||||||
| R Van Der Meer |
||||||||||||||||
| Fiscal Year 2016 |
188,847 | - | - | 188,847 | ||||||||||||
| Fiscal Year 2015 |
161,449 | - | - | 161,449 | ||||||||||||
| James Hardie 2016 Annual Report on Form 20-F | 63 |
| Total Remuneration for Non-Executive Directors (continued) | ||||||||
|
(US dollars) Name |
Primary Directors’ Fees1 |
Other Payments2 | Other Benefits3 | TOTAL | ||||||||||||
| R Chenu 4 |
||||||||||||||||
| Fiscal Year 2016 |
170,184 | - | - | 170,184 | ||||||||||||
| Fiscal Year 2015 |
101,717 | - | 22,879 | 124,596 | ||||||||||||
| A Gisle Joosen5 |
||||||||||||||||
| Fiscal Year 2016 |
173,184 | - | - | 173,184 | ||||||||||||
| Fiscal Year 2015 |
5,363 | - | - | 5,363 | ||||||||||||
|
Total Compensation for Non-Executive Directors |
| |||||||||||||||
| Fiscal Year 2016 |
2,081,358 | 217,960 | 39,788 | 2,339,106 | ||||||||||||
| Fiscal Year 2015 |
1,785,914 | - | 74,029 | 1,859,943 | ||||||||||||
| 1 | Amount includes base, Chairman, Deputy Chairman, Committee Chairman fees, as well as fees for attendance at ad hoc sub-committee meetings. |
| 2 | Amount relates to a one-off payment to partially compensate non-executive directors who have received a reduction in net compensation following the Company’s re-domicile from the Netherlands to Ireland. The impact of the re-domicile meant that US based non-executive directors incurred an increased income tax burden since the Irish tax rate is significantly higher than the US tax rate. The Board deferred consideration of such tax equalization measure for the affected non-executive directors until: (i) it fully understood the tax implications for the affected directors; and (ii) there was a clear improvement in the US housing market and business results began to improve. |
| 3 | Amount includes the cost of non-executive directors’ fiscal compliance in Ireland and other costs connected with Board-related events paid for by the Company. In addition to these costs, travel and subsistence expenses incurred by non-executive directors in attending board meetings held in Ireland which are paid or reimbursed by the Company have, pursuant to a direction from the Irish Revenue Commissioners effective from February 2014, been grossed up and subjected to Irish income taxes. The aggregate cost to the Company, including income taxes, for these costs in fiscal year 2016 and 2015 were US$282,789 and US$447,355, respectively. New Irish tax legislation was enacted with effect from January 2016 that specifically exempts travel and subsistence expenses incurred by non-executive directors in attending board meetings from Irish income taxes. |
| 4 | Appointed to the Board on 15 August 2014. In addition to the compensation set forth above, Mr Chenu continues to receive certain tax services from the Company, and remains eligible for certain tax equalization benefits relative to the vesting of previously granted equity awards, stemming from his prior service as an executive officer of the Company. |
| 5 | Appointed to the Board on 20 March 2015. |
Director Remuneration for the years ended 31 March 2016 and 2015
For Irish reporting purposes, the breakdown of director’s remuneration between managerial services (which only relate to Mr Gries) and director services is:
| Years Ended 31 March | ||||||||
| (In US dollars) | 2016 | 2015 | ||||||
| Managerial Services 1 |
$ | 10,866,287 | $ | 11,577,188 | ||||
| Director Services 2 |
2,792,080 | 2,468,747 | ||||||
|
|
|
|
|
|||||
| $ | 13,658,367 | $ | 14,045,935 | |||||
|
|
|
|
|
|||||
| James Hardie 2016 Annual Report on Form 20-F | 64 |
| 1 | Includes cash payments, non-cash benefits (examples include medical and life insurance benefits, car allowances, membership in executive wellness programs, financial planning and tax services), 401(k) benefits, and amounts expensed for outstanding equity awards for L Gries. |
| 2 | Includes compensation for all non-executive directors, which includes base, Chairman, Deputy Chairman, Committee Chairman and cost of non-employee directors’ fiscal compliance in Ireland, other costs connected with Board-related events paid for by the Company, travel and subsistence expenses incurred by non-executive directors in attending board meetings held in Ireland paid or reimbursed by the Company which have, pursuant to a direction from the Irish Revenue Commissioners effective from February 2014, been grossed up and subjected to Irish income taxes and a proportion of the CEO’s remuneration paid as fees for his service on the JHI plc Board in fiscal years 2016 and 2015. New Irish tax legislation was enacted with effect from January 2016 that specifically exempts travel and subsistence expenses incurred by non-executive directors in attending board meetings from Irish income taxes. |
Share Ownership and Stock Based Compensation Arrangements
As of 30 April 2016 and 30 April 2015, the number of CUFS and RSUs beneficially owned by Senior Executive Officers is set forth below:
| Name | CUFS at 30 April 2016 |
CUFS at 30 April 2015 |
RSUs at 30 April 2016 |
RSUs at 30 April 2015 |
||||||||||||
| L Gries |
454,334 | 522,278 | 1,960,484 | 2,161,187 | ||||||||||||
| M Marsh |
- | - | 316,103 | 193,029 | ||||||||||||
| R Sullivan |
15,459 | 7,427 | 251,111 | 144,338 | ||||||||||||
| M Fisher |
91,767 | 149,689 | 264,847 | 260,785 | ||||||||||||
| J Blasko |
18,917 | - | 149,327 | 134,602 | ||||||||||||
As of 30 April 2016 and 30 April 2015, the number of CUFS and RSUs beneficially owned by non-executive directors is set forth below:
| Name | CUFS at 30 April 2016 |
CUFS at 30 April 2015 |
||||||
| M Hammes 1 |
44,109 | 40,462 | ||||||
| D McGauchie |
8,372 | 20,372 | ||||||
| B Anderson 2 |
18,920 | 16,995 | ||||||
| R Chenu 3 |
93,712 | 156,306 | ||||||
| A Gisle Joosen 4 |
1,000 | - | ||||||
| D Harrison 5 |
19,259 | 17,184 | ||||||
| A Littley 6 |
2,045 | - | ||||||
| J Osborne 7 |
11,951 | 11,951 | ||||||
| R van der Meer |
17,290 | 17,290 | ||||||
| 1 | 35,109 CUFS held in the name of Mr and Mrs Hammes and 9,000 CUFS held as American Depositary Shares (“ADSs”) in the name of Mr and Mrs Hammes. |
| James Hardie 2016 Annual Report on Form 20-F | 65 |
| 2 | 7,635 CUFS held in the name of Mr Anderson, 390 CUFS held as ADSs in the name of Mr Anderson and 10,895 CUFS held as ADSs in the name of Mr and Mrs Anderson. |
| 3 | Appointed to the Board on 15 August 2014. Mr Chenu also holds 32,306 RSUs as of 30 April 2016, over which he has no voting or investment control. These RSUs were previously granted to Mr Chenu during the term of his prior service as an executive officer of the Company. The vesting of these RSUs remains subject to the achievement of applicable performance criteria, as set forth under the terms of the applicable award agreement. |
| 4 | Appointed to the Board on 20 March 2015. |
| 5 | 2,384 CUFS held in the name of Mr Harrison, 1,000 CUFS held as ADSs in the name of Mr Harrison and 15,875 CUFS held in the name of Mr and Mrs Harrison. |
| 6 | 2,045 CUFS held as ADSs in the name of Ms Littley. |
| 7 | 2,551 CUFS held in the name of Mr Osborne and 9,400 CUFS held in the name of Aurum Nominees Limited and held on behalf of Mr Osborne as beneficial owner. |
Based on 445,580,065 shares of common stock outstanding at 30 April 2016 (all of which are subject to CUFS), no director or Senior Executive Officer beneficially owned 1% or more of the outstanding shares of the Company at 30 April 2016 and none of the shares held by directors or Senior Executive Officers have any special voting rights. As of 30 April 2016, there were no options outstanding under any of the Company’s stock-based compensation arrangements. Individual’s holding RSUs have no voting or investment power over these units.
Stock-Based Compensation Arrangements
At 31 March 2016, we had the following equity award plans:
| • | the LTIP; and |
| • | the 2001 Plan. |
LTIP
The Company uses the LTIP as the plan for LTI grants to Senior Executive Officers and selected members of executive management. Participants in the LTIP receive grants of RSUs and Scorecard LTI, each of which is subject to performance goals. Participants and award levels are approved by the Remuneration Committee based on local market standards, and the individual’s responsibility, performance and potential to enhance shareholder value. The LTIP was first approved at our 2006 AGM, and our shareholders have subsequently approved amendments to the LTIP in 2008, 2009, 2010, 2012 and 2015.
The LTIP provides for plan participants’ early exercise of certain benefits or early payout under the plan in the event of a “change in control,” takeover by certain organizations or liquidation. For RSUs, a “change of control” is deemed to occur if (1) a takeover bid is made to acquire all of the shares of the Company and it is recommended by the Board or becomes unconditional, (2) a transaction is announced which would result in one person owning all the issued shares in the Company, (3) a person owns or controls sufficient shares to enable them to influence the composition of the Board, or (4) a similar transaction occurs which the Board determines to be a control event. On a change of control, the Board can determine that all or some RSUs have vested on any conditions it determines, any remaining RSUs lapse.
| James Hardie 2016 Annual Report on Form 20-F | 66 |
RSUs - From fiscal year 2009, the Company commenced using RSUs granted under the LTIP. RSUs issued under the LTIP are unfunded and unsecured contractual entitlements and generally provide for settlement in shares of our common stock, subject to performance vesting hurdles prior to vesting. Additionally, the Company has on occasion issued a small number of cash settled awards.
As of 31 March 2016, there were 3,347,644 RSUs outstanding under the LTIP, divided as follows:
| Restricted Stock Units | ||||||||||||||
| Grant Type |
Grant Date | Granted | Vested as of 31 March 2016 |
Outstanding as of 31 March 2016 |
||||||||||
| TSR |
September 2011 | 954,705 | 445,833 | 389,575 | ||||||||||
| TSR |
September 2012 | 432,654 | 306,214 | 91,474 | ||||||||||
| TSR |
September 2013 | 489,888 | - | 477,297 | ||||||||||
| ROCE |
September 2013 | 461,019 | - | 443,059 | ||||||||||
| TSR |
September 2014 | 459,317 | - | 459,317 | ||||||||||
| ROCE |
September 2014 | 403,716 | - | 403,716 | ||||||||||
| TSR |
September 2015 | 579,262 | - | 579,262 | ||||||||||
| ROCE |
September 2015 | 503,944 | - | 503,944 | ||||||||||
| Total Outstanding | 3,347,644 | |||||||||||||
Scorecard LTI - From fiscal year 2010, the Company commenced using Scorecard LTI units granted under the LTIP. The Scorecard LTI is used by the Remuneration Committee to set strategic objectives which change from year to year, and for which performance can only be assessed over a period of time. The vesting of Scorecard LTI units is subject to the Remuneration Committee’s exercise of negative discretion. The cash payment paid to award recipients is based on JHI plc’s share price on the vesting date (which was amended from fiscal year 2012 to be based on a 20 trading-day closing average price).
As of 31 March 2016, there were 1,519,556 Scorecard LTI units outstanding under the LTIP, divided as follows:
| Grant Type |
Grant Date | Granted | Vested as of 31 March 2016 |
Outstanding as of 31 March 2016 |
||||||||||
| Scorecard |
September 2013 | 518,647 | - | 498,441 | ||||||||||
| Scorecard |
September 2014 | 454,179 | - | 454,179 | ||||||||||
|
Scorecard |
September 2015 | 566,936 | - | 566,936 | ||||||||||
|
Total Outstanding |
|
1,519,556 | ||||||||||||
For additional information regarding the LTIP and award grants made thereunder, see Note 16 to our consolidated financial statements.
| James Hardie 2016 Annual Report on Form 20-F | 67 |
2001 Plan
The 2001 Plan is intended to promote the Company’s long-term financial interests by encouraging management below the senior executive level to acquire an ownership position in the Company and align their interests with our shareholders. Selected employees under the 2001 Plan are eligible to receive awards in the form of RSUs, nonqualified stock options, performance awards, restricted stock grants, stock appreciation rights, dividend equivalent rights, phantom stock or other stock-based benefits. Award levels are determined based on the Remuneration Committee’s review of local market standards and the individual’s responsibility, performance and potential to enhance shareholder value.
The 2001 Plan was first approved by our shareholders and Board in 2001 and reapproved to continue until September 2021 at the 2011 AGM. An aggregate of 45,077,100 shares of common stock were made available for issuance under the 2001 Plan, subject to adjustment in the event of a number of prescribed events set out on the 2001 Plan. All of the outstanding options and RSUs granted under the 2001 Plan vest at the rate of 25% on the 1st anniversary of the grant, 25% on the 2nd anniversary date and 50% on the 3rd anniversary date, with the exception of the 16 September 2013 grant to the CFO which cliff vests on the third anniversary of the grant date.
The 2001 Plan is administered by our Remuneration Committee, and the Remuneration Committee or its delegate is authorized to determine: (i) who may participate in the 2001 Plan; (ii) the number and types of awards made to each participant; and (iii) the terms, conditions and limitations applicable to each award. The Remuneration Committee has the exclusive power to interpret and adopt rules and regulations to administer the 2001 Plan, including a limited power to amend, modify or terminate the 2001 Plan to meet any changes in legal requirements or for any other purpose permitted by law.
The purchase or exercise price of any award granted under the 2001 Plan may be paid in cash or other consideration at the discretion of our Remuneration Committee, including cashless exercises.
The exercise price for all options is the market value of the shares on the date of grant. The Company may not reduce the exercise price of such an option or exchange such an option or stock appreciation right for cash, or other awards or a new option at a reduced exercise price without shareholder approval or as permitted under specific restructuring events.
No unexercised options or unvested RSUs issued under the 2001 Plan are entitled to dividends or dividend equivalent rights.
Although the 2001 Plan permits the Remuneration Committee to grant stock options, performance awards, restricted stock awards, stock appreciation rights, dividend equivalent rights or other stock based benefits; however, no such awards are currently outstanding.
The 2001 Plan provides for the automatic acceleration of certain benefits and the termination of the plan under certain circumstances in the event of a “change in control.” A change in control will be deemed to have occurred if either (1) any person or group acquires beneficial ownership equivalent to 30% of our voting securities, (2) individuals who are currently members of our Board
| James Hardie 2016 Annual Report on Form 20-F | 68 |
cease to constitute at least a majority of the members of our Board, or (3) there occurs the consummation of certain mergers (other than a merger that results in existing voting securities continuing to represent more than 5% of the voting power of the merged entity or a recapitalization or reincorporation that does not result in a material change in the beneficial ownership of the voting securities of the Company), the sale of substantially all of our assets or our complete liquidation or dissolution.
Options—Until fiscal year 2008, the Company issued options to purchase shares of our common stock issued under the 2001 Plan. As of 31 March 2016, there were 104,027 options outstanding under the 2001 Plan, divided as follows:
| Options | ||||||||
| Grant Date | Granted | Outstanding as of 31 March 2016 |
||||||
| November 2006 |
3,499,490 | 43,500 | ||||||
| December 2007 |
5,031,310 | 60,527 | ||||||
| Total Outstanding | 104,027 | |||||||
RSUs—Since fiscal year 2009, the Company has issued restricted stock units under the 2001 plan, which are unfunded and unsecured contractual entitlements for shares to be issued in the future and may be subject to time vesting or performance hurdles prior to vesting. On vesting, restricted stock units convert into shares. We granted 327,354, 329,192 and 315,749 restricted stock units under the 2001 Plan in the years ended 31 March 2016, 2015 and 2014, respectively. Additionally, the Company has on occasion issued a small number of cash settled awards. As of 31 March 2016, there were 701,810 restricted stock units outstanding under this plan, divided as follows:
| Restricted Stock Units | ||||||||||||
| Grant Date | Granted | Vested as of 31 March 2016 |
Outstanding as of 31 March 2016 |
|||||||||
| September 2013 |
56,128 | - | 56,128 | |||||||||
| December 2013 |
259,621 | 114,253 | 102,462 | |||||||||
| December 2014 |
329,192 | 78,054 | 223,117 | |||||||||
|
December 2015 |
327,354 | 111 | 320,103 | |||||||||
| Total Outstanding | 701,810 | |||||||||||
For additional information regarding the 2001 Plan and award grants made thereunder, see Note 16 to our consolidated financial statements.
| James Hardie 2016 Annual Report on Form 20-F | 69 |
Corporate Governance Statement
The Company believes strong corporate governance is essential to achieving both its short and long-term performance goals and to maintaining the trust and confidence of investors, employees, regulatory agencies and other stakeholders. The Board follows, both formally and informally, corporate governance principles designed to assure that the Board, through its membership, composition, Board committee structure and governance practices, is able to provide informed, competent and independent guidance and oversight and thereby promote long- term shareholder value. This Corporate Governance Statement (this “Statement”) describes the key aspects of the Company’s corporate governance framework.
During fiscal year 2016, the Board evaluated the Company’s corporate governance framework and practices and approved this Corporate Governance Statement. This Corporate Governance Statement is current as at 19 May 2016.
Overall Approach to Corporate Governance
The Company operates under the regulatory requirements of numerous jurisdictions, including those of its corporate domicile (Ireland) and its principal stock exchange listings (Australia and the United States). In presenting this Statement, the Board has evaluated the Company’s corporate governance framework in relation to the ASX Corporate Governance Council’s Corporate Governance Principles and Recommendations (3rd Edition) (the “ASX Principles”), as well as the NYSE Corporate Governance Standards (the “NYSE Standards”).
ASX Principles
Pursuant to ASX Listing Rule 4.10.3, the Company is required to disclose in this Annual Report the extent to which it has followed the ASX Principles for fiscal year 2016 and must identify any areas where the Company has determined not to follow the ASX Principles and provide the reasons for not following them.
NYSE Standards
As a foreign private issuer with ADS listed on the NYSE, the Company is required to disclose in this Annual Report any significant ways in which its corporate governance practices differ from those followed by domestic companies under NYSE listing standards. Based on the requirements of the NYSE Standards, the Company believes that its corporate governance framework and practices were consistent with the NYSE Standards during fiscal year 2016, except as otherwise noted below:
| • | Generally, in the United States an audit committee of a public company is directly responsible for appointing the company’s independent registered public accounting firm, with such appointment being subsequently ratified by shareholders. Under Irish law, the independent registered public accounting firm is directly appointed by the shareholders where there is a new appointment. Otherwise, the appointment is deemed to continue unless the firm retires, is asked to retire or is unable to perform their duties; and |
| James Hardie 2016 Annual Report on Form 20-F | 70 |
| • | NYSE rules require each issuer to have an audit committee, a compensation committee (equivalent to a remuneration committee) and a nominating committee composed entirely of independent directors. As a foreign private issuer, the Company does not have to comply with this requirement; however, the Board committee charters reflect Australian and Irish practices, in that such Board committees have a majority of independent directors, unless a higher number is mandatory. |
Availability of Key Governance Documents
This Statement, as well as the Company’s Constitution, Board committee charters and the other key governance and corporate policies referenced in this Statement, as updated from time to time, are available in the Corporate Governance section of the Company’s investor relations website (www.ir.jameshardie.com.au) or by requesting a copy from the Company Secretary at the Company’s corporate headquarters, Europa House, 2nd Floor, Harcourt Centre, Harcourt Street, Dublin 2.
The Board committee charters and other key governance and corporate policies referenced in this Statement were reviewed by the Board during fiscal year 2016.
Discussion of Corporate Governance Framework and Practices
The following discussion of the Company’s corporate governance framework and practices incorporates the disclosures required by the ASX Principles, and generally follows the order of the ASX Principles.
Principle 1: Lay Solid Foundations for Management and Oversight
The Role of the Board and Management
The principal role of the Board is to promote and protect shareholder value by providing strategic guidance to management and overseeing management’s implementation of the Company’s strategic goals and objectives. On an annual basis, the Board reviews the Company’s strategic priorities with management, including the Company’s business plan, and leads discussions on execution strategy, including budgetary considerations, to ensure that the Company has the appropriate resources to deliver the agreed strategy. The Board also monitors management, operational and financial performance against the Company’s goals on an ongoing basis through the year. To enable it to do this, the Board receives operational and financial updates at every scheduled Board meeting.
Given the size of the Company, it is not possible or appropriate for the Board to be involved in managing the Company’s day-to-day activities. However, the Board is accountable to shareholders by whom they are elected for delivering long-term shareholder value. To achieve this, the Board ensures that the Company has in place a framework of controls, which enables management to appraise and manage risk effectively with oversight from the Board, through clear and robust procedures and delegated authorities.
In accordance with the provisions of the Company’s Constitution, the Board committee charters and other applicable governance and corporate policies, the Board has delegated a number of
| James Hardie 2016 Annual Report on Form 20-F | 71 |
powers to Board committees and responsibility for the day-to-day management of the Company’s affairs and the implementation of corporate strategy to the CEO. The responsibilities delegated to the CEO are established by the Board and include limits on the way in which the CEO can exercise such authority. In addition, the Board has also reserved certain matters to itself for decision, including:
| • | appointing, removing and assessing the performance and remuneration of the CEO and CFO; |
| • | succession planning for the Board and senior management and defining the Company’s management structure and responsibilities; |
| • | approving the overall strategy for the Company, including the business plan and annual operating and capital expenditure budgets; |
| • | ensuring that the Company has in place an appropriate risk management framework and that the risk appetite and tolerances are set at an appropriate level; |
| • | convening and monitoring the operation of shareholder meetings and approving matters to be submitted to shareholders for their consideration; |
| • | approving annual and periodic reports, results announcements and related media releases, and notices of shareholder meetings; |
| • | approving the dividend policy and interim dividends and, when appropriate, making recommendations to shareholders regarding the annual dividend; |
| • | reviewing the authority levels of the CEO and management; |
| • | approving the remuneration framework for the Company; |
| • | overseeing corporate governance matters for the Company; |
| • | approving corporate-level Company policies; |
| • | considering management’s recommendations on various matters which are above the authority levels delegated to the CEO or management; and |
| • | any other matter which the Board considers appropriate to be approved by the Board. |
In discharging its duties, the Board aims to take into account, within the context of the industry in which the Company operates, the interests of the Company (including the interests of its employees), shareholders, and other stakeholders, and where possible, aligns its activities with current best practices in the jurisdictions in which the Company operates.
The full list of those matters reserved to the Board is formalized in our Board Charter. The Board Charter is available in the Corporate Governance section of our investor relations website (www.ir.jameshardie.com.au).
Board Committees
In order to ensure that the Board properly discharges its responsibilities and fulfills its oversight role, the Board has established the following standing Board committees:
| • | Audit Committee; |
| • | Remuneration Committee; and |
| • | Nominating and Governance Committee. |
Additionally, from time to time, the Board may establish ad hoc Board committees to address particular matters. Each standing Board committee meets at least quarterly and has scheduled an annual calendar of meetings and discussion topics to assist it to properly discharge all of its
| James Hardie 2016 Annual Report on Form 20-F | 72 |
responsibilities. Each Board committee Chairman reports to the Board at each scheduled Board meeting on their activities.
Each of the standing Board committees operates under a written charter adopted by the Board. On an annual basis, each committee, with the assistance of the Nominating and Governance Committee, undertakes a review of its charter for consistency with applicable regulatory requirements and current corporate governance principles and practices. Each of the standing Board committee charters is available on the Corporate Governance section of the Company’s investor relations website (www.ir.jameshardie.com.au).
Full discussions of the role and oversight responsibilities for each standing committee are provided below under Principle 2 (Nominating and Governance Committee), Principle 4 (Audit Committee) and Principle 8 (Remuneration Committee).
Board and Board Committee Meetings
The Board and each of the standing Board committees meet formally at least four times a year and on an ad hoc basis as deemed necessary or appropriate. Scheduled Board meetings are normally held over a period of one or two days, with Board committee meetings also taking place during such time. This meeting structure enhances the effectiveness of the Board and the Board committees. Board and Board committee meetings are generally held at the Company’s corporate headquarters in Ireland. At each scheduled meeting, the Board meets in executive session without management present for at least part of the meeting.
Prior to each scheduled Board or Board committee meeting, directors are provided timely and necessary information by Company management to allow them to fulfill their duties. The Nominating and Governance Committee periodically reviews the format, timeliness and content of information provided to the Board and Board committees. All directors receive access to all Board committee materials and may attend any Board committee meeting, whether or not they are members of such committee. Directors also receive the minutes of each committee’s deliberations and findings, as well as oral reports from each Board committee Chairman, at each scheduled Board meeting.
In discharging their duties, directors are provided with direct access to executive management and outside advisors and auditors.
The Board has regular discussions with the CEO and executive management regarding the Company’s strategy and performance, during which Board members formally review the Company’s progress. During the year, the Board and each Board committee develop and review an annual work plan created from the standing Board committee charters so that responsibilities of each Board committee are addressed at appropriate times throughout the year.
| James Hardie 2016 Annual Report on Form 20-F | 73 |
The following table provides the composition of each standing Board committee during fiscal year 2016, as well as sets out the number of Board and Board committee meetings held, and each director’s attendance:
| Board | Audit | Remuneration | Nominating & Governance |
|||||||||||||||||||||||||||||||||||
| Name | H | A | Member | H | A | Member | H | A | Member | H | A | |||||||||||||||||||||||||||
| M Hammes |
4 | 4 | ● | 4 | 4 | ● | 5 | 5 | ● | 4 | 4 | |||||||||||||||||||||||||||
| D McGauchie |
4 | 4 | ● | 4 | 4 | |||||||||||||||||||||||||||||||||
| B Anderson |
4 | 4 | C | 4 | 4 | ● | 5 | 5 | ||||||||||||||||||||||||||||||
| R Chenu |
4 | 4 | ● | 5 | 5 | ● | 2 | 2 | ||||||||||||||||||||||||||||||
| D Harrison |
4 | 4 | ● | 4 | 4 | C | 5 | 5 | ||||||||||||||||||||||||||||||
| A Gisle Joosen |
4 | 4 | ● | 4 | 4 | |||||||||||||||||||||||||||||||||
| A Littley |
4 | 4 | ● | 4 | 4 | ● | 5 | 5 | ||||||||||||||||||||||||||||||
| J Osborne |
4 | 4 | ● | 4 | 4 | |||||||||||||||||||||||||||||||||
| R van der Meer |
4 | 4 | C | 4 | 4 | |||||||||||||||||||||||||||||||||
| ● | Board Committee member |
| C | Board Committee chair |
| H | Number of meetings held during the time the director held office or was a member of the Board committee during the fiscal year. |
| A | Number of meetings attended during the time the director held office or was a member of the Board committee during the fiscal year. Non-committee members may also attend Board committee meetings from time to time; these attendances are not shown. |
Company Secretary
The Company Secretary is accountable to the Board through the Chairman on all matters relative to the proper functioning of the Board. The Company Secretary is also responsible for ensuring that Board procedures are complied with. All directors have access to the Company Secretary for advice and services. The Board appoints and removes the Company Secretary.
Evaluation of Director Candidates
Before appointing a director or nominating a candidate to shareholders for election as a director, the Company undertakes background checks including checks as to the candidate’s education, experience, criminal history and bankruptcy. To facilitate shareholders making an informed decision on whether or not to elect or re-elect a director, the Board details in the Notice of Meeting all material information it possesses relevant to the decision.
Agreements with Directors and Senior Executives
Each incoming director receives a letter of appointment setting out the key terms and conditions of his or her appointment and the Company’s expectations of them in that role. No benefits are provided to our non-executive directors upon termination of appointment. The Company has executive agreements in place with certain senior executives where it is in the Company’s strategic interest. Certain senior executives have more specific written agreements and details of such agreements can be found in the Company’s Remuneration Report contained in “Section 1 – Remuneration.”
| James Hardie 2016 Annual Report on Form 20-F | 74 |
Management Performance Evaluations
On an annual basis, the Remuneration Committee, and subsequently the Board review the performance of the CEO against performance measures approved by the Board and Remuneration Committee. The CEO annually reviews the performance of each of the CEO’s direct reports, assessing their performance against performance measures approved by the Remuneration Committee and the Board and reports to the Board through the Remuneration Committee on the outcome of those reviews. Performance evaluations for fiscal year 2016 were conducted in accordance with the process outlined above in April 2016 and May 2016. Further details on the assessment criteria for the CEO and other senior executive officers are set out in “Section 1 – Remuneration.”
Board Performance Evaluation
The Nominating and Governance Committee oversees the Board evaluation process and makes recommendations to the Board. During fiscal year 2016, the process, which was undertaken in February and March 2016, involved completion of a purpose-designed survey by each director and a private discussion between the Chairman and each director, and the results were reviewed and discussed by the Nominating and Governance Committee and the Board.
The Deputy Chairman discussed with the Board, the Chairman’s performance and contribution to the effectiveness of the Board.
Workplace Diversity
The Company recognizes the value of having a workforce that reflects the diverse communities and marketplaces in which we operate and serve. The Company believes that a skilled and diverse workforce, which encompasses a wealth of different viewpoints, skills, attributes, and life experiences, along with the unique strengths of each employee, contribute to the business performance at the Company.
The Company has implemented a Workplace Diversity Policy that reflects a broader view of diversity than those covered by the ASX Principles and supports certain of our core organizational values, including Operating with Respect and Building Organizational Advantage. The policy, which is located in the Corporate Governance section of the Company’s investor relations website (www.ir.jameshardie.com.au), applies to all individuals recruited or employed by the Company and reflects the organization’s inclusive view of diversity, which includes individual differences related to race, gender, age, national origin, religion, sexual orientation or disability.
The Board, with assistance from management, is responsible for approving and monitoring the Company’s diversity policy and measurable objectives in the context of the Company’s unique circumstances and industry. The Board assesses the policy and objectives annually and the Company’s progress in achieving them.
The Board has delegated responsibility to the Nominating and Governance Committee for monitoring the effectiveness of this policy to the extent it relates to diversity of the Board’s composition, senior leadership, management, and the organization as a whole and for reviewing and recommending any updates to this policy, as deemed necessary.
| James Hardie 2016 Annual Report on Form 20-F | 75 |
Details of diversity composition across various levels of the organization at the end of fiscal year 2016 are set out below:
| Level | Percentage of female employees |
Percentage of employees with diversity characteristics | ||
| James Hardie Board1 |
22% (2 of 9) | 33% (3 of 9) | ||
|
US BUSINESS 2 | ||||
| Senior leadership positions3 |
12% (16 of 132) | 28% (37 of 132) | ||
| All management positions |
15% (52 of 340) | 33% (111 of 340) | ||
| Total workforce |
12% (264 of 2,285) | 35% (791 of 2,285) | ||
|
NON-US BUSINESSES 4 | ||||
| Senior leadership positions |
16% (5 of 32) | |||
| All management positions |
19% (24 of 124) | |||
| Total workforce |
18% (179 of 1,002) | |||
| 1 | Includes gender and race diversity characteristics for Board. |
| 2 | Includes US employees with diversity characteristics including gender, race or national origin. |
| 3 | Senior Leaders are defined as individuals at senior manager and director level and above who participate in JHI plc’s Company and Individual Performance (CIP) Plan. |
| 4 | Race/national origin diversity characteristics vary between countries and are therefore not captured in aggregate for Non-US Businesses. |
The Board has a goal to maintain:
| • | diversity characteristics in excess of 30%; and |
| • | women in excess of 20% among non-executive directors. |
With regard to the Company’s senior leadership, management, and the organization as a whole, the following table outlines the organization’s five primary objectives in promoting diversity during fiscal year 2016, the actions in place or undertaken to achieve these objectives, and the progress made against these objectives during fiscal year 2016.
| Objectives | Fiscal year 2015 actions | FY2016 and FY2017 plans | ||
| To promote a culture of diversity (which includes gender, skills, experience, and cultural background) | • All U.S. employees were registered for a new anti-discrimination and harassment training in early December 2014 with a 99% completion rate. • All global employees were registered for Code of Conduct and Business Ethics training in FY15 with an 84% completion rate.
|
• We re-administered Code of Conduct and Business Ethics training in March 2016. • In FY17, all employees will be required to complete the e-module: Diversity: Skills for Collaboration. | ||
| To ensure that recruitment and selection processes are based on merit | • In FY15, the structured interview evaluation process used in sales was expanded for salaried manufacturing and corporate applicants. | • MBA Leadership Program recruiting, targeted to bring future general management talent into the organization, has resulted in 20 hires since its inception in 2011, with 20% female and 55% non-Caucasian hires.
|
| James Hardie 2016 Annual Report on Form 20-F | 76 |
| Objectives | Fiscal year 2015 actions | FY2016 and FY2017 plans | ||
| To provide talent management and development opportunities which provide equal opportunities for all current employees | • Individual development plans were well integrated into the review process. • Between January 2014 and January 2015, 47 employees were offered new roles/promotions as a result of the internal posting and interviewing process. Of these, 15 were women (32%), and 17 (36%) were non-Caucasian. • In FY15, based on the quantitative testing for high potential talent, we have a senior management development program whereby 20% of the participants were female and 20% were non-Caucasian. |
• We increased our internal posting consistency across divisions, as a result between January 2015 and January 2016, 128 employees were offered new roles/promotions. Of these, 31 were women (24%), with 10 of the 31 (32%) both women and non-Caucasian; 32 (25%) were non-Caucasian. • Beginning in April 2016, we commenced a second group of high potentials through our senior management development program. For this second group, 11% are female and 21% are non-Caucasian. • In FY17, we will put in place additional structures to support diversity, including women’s engagement forum and development support, as needed, for non-native English speakers.
| ||
| To reward and remunerate fairly | • No change in reward and remuneration programs noted in FY15. • The organization communicated pay grades and criteria for promotion across the sales departments to help ensure there is no discrepancy in pay by role. • Hourly manufacturing wages were tied to completed certifications. All employees are provided access to training to complete certifications.
|
• As part of the California Fair Pay Act, management is conducting a review of California employees for disparate pay treatment. | ||
| To provide flexible work practices | • Flexible working arrangements are discussed with each employee and individual arrangements are offered as job requirements permit.
|
No change. |
Principle 2: Structure the Board to Add Value
Composition of the Board
The Board currently comprises nine non-executive directors and one executive director (being the CEO). In accordance with the Company’s Constitution, the Board must have no less than three and not more than twelve directors, with the precise number to be determined by the Board.
Directors may be elected by our shareholders at general meetings or appointed by the Board and elected at the next general meeting if there is a vacancy. A person appointed as a director by the Board must submit him or herself for re-election at the next AGM. The Board and our shareholders have the right to nominate candidates for the Board. Directors may be dismissed by our shareholders at a general meeting. In accordance with the Company’s Constitution and the ASX Listing Rules, no director (other than the CEO) shall hold office for a continuous period of more than three years without being re-elected by shareholders at an AGM. The Company’s Constitution provides that at each AGM, one-third of the directors (excluding the CEO) must retire and, if eligible, may offer themselves for re-election.
| James Hardie 2016 Annual Report on Form 20-F | 77 |
The Board’s overriding desire is to maximize its effectiveness by appointing the best candidates for vacancies and closely reviewing the performance of directors subject to re-election. Directors are not automatically nominated for re-election at the end of their term. Nomination for re-election is based on a number of factors, including an assessment of their individual performance, independence, tenure, and their skills and experience relative to the needs of the Company. The Nominating and Governance Committee and the Board discuss the performance of each director due to stand for re-election at the next AGM before deciding whether to recommend their re-election.
As part of the appointment process, the Nominating and Governance Committee, in consultation with the Board, considers the size and composition of the Board, the current range of skills, competencies and experience and the desired range of skills, as well as Board renewal, succession and diversity plans. The Nominating and Governance Committee identifies suitable candidates, with assistance from an external consultant, where appropriate, and a number of directors meet with those candidates before the Board selects the most suitable candidate, based on a recommendation from the Nominating and Governance Committee.
Director Independence
In accordance with the ASX Principles and the NYSE Standards, the Company requires that a majority of directors on the Board and the Board committees, as well as the Chairman of the Board and each committee, be independent, unless a greater number is required to be independent under the rules and regulations of the ASX, the NYSE or other applicable regulatory body.
All directors are expected to bring their independent views and judgment to the Board and Board committees and must declare any potential or actual conflicts of interest. For a director to be considered independent, the Board must determine the director does not have any direct or indirect business or other relationship that could materially interfere with such director’s exercise of independent judgment. In assessing the independence of each director, the Board considers the standards for determining director independence set forth in the ASX Principles and the NYSE Standards and evaluates all potential conflicting relationships on a case-by-case basis, considering the materiality of each potential or actual conflict of interest.
During fiscal year 2016, the Board, with the assistance of the Nominating and Governance Committee, undertook an independence assessment of each director. The Board determined that, with the exception of Louis Gries, as CEO of the Company, and Russell Chenu, each of Michael Hammes, Donald McGauchie, Brian Anderson, Andrea Gisle Joosen, David Harrison, Alison Littley, James Osborne and Rudolph van der Meer is independent. Mr Chenu is not considered independent, based upon the nature of his previous employment as CFO of the Company.
Prior to determining the independence of Brian Anderson, the Board considered his role as a director of PulteGroup, a home builder in the United States. PulteGroup does not buy any of the Company’s products directly from the Company, although it does buy the Company’s products through some of the Company’s customers. PulteGroup receives a rebate from the Company or the Company’s suppliers in respect of some of its purchases in accordance with a rebate program applicable to similar home builders. These transactions are conducted on an arm’s length basis,
| James Hardie 2016 Annual Report on Form 20-F | 78 |
are similar to the transactions the Company has entered into with other similarly situated home builders, are in accordance with the Company’s normal terms and conditions and are not material to PulteGroup or to the Company. The rebate program existed and was disclosed to the Board before Mr Anderson became a director. It is not considered that Mr Anderson has any influence over these transactions.
The Board believes that, notwithstanding the length of Mr McGauchie’s tenure, he remains independent in character and judgment and has not formed an association with management that could interfere with his ability to exercise independent judgment.
Director Qualifications and Board Diversity
The Board seeks to achieve a mix of skills, experience and expertise to maximize the effectiveness of the Board and utilizes a skills matrix in reviewing Board composition and in succession planning. The following lists the mix of skills, experience and diversity the Board has and is looking to achieve, taking into consideration the strategic objectives of the Company.
Key Board Skills and Experience
| Executive Leadership | Board Experience | Succession Planning | Governance | |||
|
Strategy |
Financial Acumen | Corporate Finance | Risk Management | |||
|
Global Experience |
Health, Safety and Environmental | Executive Remuneration |
Manufacturing | |||
|
Market Experience |
Information regarding Board diversity can be found in “Workplace Diversity” section above.
Directors must be able to devote a sufficient amount of time to prepare for, and effectively participate in, Board and Board committee meetings. The Nominating and Governance Committee reviews the other commitments of directors annually and otherwise, as required. In fiscal year 2016, as part of the review, the Nominating and Governance Committee noted that Mr Anderson serves on a total of four public company audit committees (including the Company’s Audit Committee). The Board has determined that such simultaneous service does not impair the ability of Mr Anderson to effectively serve as chairman of the Company’s Audit Committee.
Biographical information for each member of the Board, along with the skills, qualifications, experience and relevant expertise for each director, and his or her date and term of appointment, are summarized in the Board biography section of this Annual Report and also appear in the Corporate Governance section of the Company’s investor relations website (www.ir.jameshardie.com.au).
Nominating and Governance Committee
The Board has established the Nominating and Governance Committee to identify and recommend to the Board individuals qualified to become members of the Board, develop and recommend to the Board a set of corporate governance principles, and perform a leadership role
| James Hardie 2016 Annual Report on Form 20-F | 79 |
in shaping the Company’s corporate governance policies. The duties and responsibilities of the Nominating and Governance Committee include:
| • | identifying and recommending to the Board individuals qualified to become directors; |
| • | overseeing the evaluation of the Board and senior management; |
| • | assessing the independence of each director; |
| • | reviewing the conduct of the AGM; and |
| • | performing a leadership role in shaping the Company’s corporate governance policies. |
A more complete description of these and other Nominating and Governance Committee functions is contained in the Nominating and Governance Committee’s Charter, a copy of which is available in the Corporate Governance section of the Company’s investor relations website (www.ir.jameshardie.com.au).
The current members of the Nominating and Governance Committee are Rudolf van der Meer (Chairman), Russell Chenu, Michael Hammes, Donald McGauchie and James Osborne, the majority of whom are independent non-executive directors.
Succession Planning
The Board, together with the Nominating and Governance Committee, has developed, and periodically reviews with the CEO, management succession plans, policies and procedures for the CEO and certain other members of executive management.
Retirement and Tenure Policy
The Company does not have a retirement and tenure policy. The length of tenure of individual directors is one of many factors considered by the Board when assessing the independence, performance and contribution of a director, in succession planning, and as part of the Board’s decision-making process when considering whether a director should be recommended by the Board for re-election.
Related Party Transactions
Other than the compensation arrangements with our executive officers and directors, which are disclosed in “Section 1 – Remuneration” of this Annual Report, the Company has not entered into any related party transactions requiring disclosure during fiscal year 2016.
Induction and Continuing Development
The Company has an induction program for new directors. This program includes an overview of the Company’s governance arrangements and directors’ duties in Ireland, the United States and Australia, plant and market tours to understand the Company’s strategic plans and impart relevant industry knowledge, briefings on the Company’s risk management and control framework, financial results and key risks and issues, and meeting other directors, the CEO and members of management. New directors are also provided with comprehensive orientation materials including relevant corporate documents and policies.
| James Hardie 2016 Annual Report on Form 20-F | 80 |
In addition, the Company regularly schedules time at Board meetings to develop the Board’s understanding of the Company’s operations and regulatory environment, including updates on topical developments from management and external experts.
Board Leadership Structure
In an effort to promote the efficient undertaking of its roles and responsibilities, the Board has appointed one of its independent, non-executive members, Michael Hammes, as Chairman. In his role as Chairman, Mr Hammes co-ordinates the Board’s duties and responsibilities and acts as an active liaison between management and the Company’s non-executive directors, maintaining frequent contact with the CEO and being advised generally on the progress of Board and Board committee meetings. In his role as Chairman, Mr Hammes also:
| • | provides leadership to the Board; |
| • | chairs Board and shareholder meetings; |
| • | facilitates Board discussion; |
| • | monitors, evaluates and assesses the performance of the Board and Board committees; and |
| • | is a member of and attends meetings of all Board committees. |
The Board has appointed Donald McGauchie as the Deputy Chairman to help assist Mr Hammes in his role as Chairman and fulfill the obligations of the Chairman in his absence.
Remuneration
For a detailed discussion of the Company’s remuneration policies for directors and executives, and the link between remuneration and overall corporate performance, see “Section 1 – Remuneration” of this Annual Report.
Board Accumulation Guidelines
Non-executive directors are encouraged to accumulate up to 1.5 times (and 2 times for the Chairman) the base Board member fee) in the Company’s shares (either personally, in the name of their spouse, or through a personal superannuation or pension plan) over a reasonable time following their appointment. The Remuneration Committee reviews the guidelines and non-executive directors’ share holdings on a periodic basis.
Independent Advice and Access to Information
In addition to their access to the Company Secretary and senior management, the Board, the Board committees and individual directors may all seek independent professional advice at the Company’s expense for the proper performance of their duties.
Indemnification
The Company’s Constitution provides for indemnification of any person who is (or who was) a director, the Company Secretary, or an employee or any other person deemed by the Board to be an agent of the Company, who suffers any loss as a result of any action in discharge of their
| James Hardie 2016 Annual Report on Form 20-F | 81 |
duties, in the absence of a willful act or default and subject to the provisions of the Irish Companies Acts.
The Company and certain of its subsidiaries have provided Deeds of Access, Insurance and Indemnity to directors and executives who are directors or officers of the Company or its subsidiaries.
Principle 3: Act Ethically and Responsibly
Global Code of Business Conduct
The Company seeks to maintain high standards of integrity and is committed to ensuring that the Company conducts its business in accordance with high standards of ethical behavior. The Company requires its employees to comply with both the spirit and the letter of all laws and other statutory requirements governing the conduct of the Company’s activities in each country in which we operate. The Company has adopted a Global Code of Business Conduct (the “Code of Conduct”) which applies to all of the Company’s employees and directors. The Code of Conduct covers many aspects of corporate policy and addresses compliance with legal and other responsibilities to stakeholders. All directors and employees of the Company worldwide are required to review the Code of Conduct on an annual basis. As part of its oversight functions, the Audit Committee oversees the Code of Conduct and reviews the policy on an annual basis. A copy of the Code of Conduct is available in the Corporate Governance section of the Company’s investor relations website (www.ir.jameshardie.com.au).
The Company did not grant any waivers from the provisions of the Code of Conduct during fiscal year 2016.
Complaints/Ethics Hotline
The Code of Conduct provides employees with advice about who they should contact if they have information or questions regarding potential violations of the policy. Globally, the Company maintains an ethics hotline operated telephonically (except in France) by an independent external provider which allows employees to report anonymously any concerns. All Company employees worldwide are reminded annually of the existence of the ethics hotline.
All complaints, whether to the ethics hotline or otherwise, are initially reported directly to the General Counsel and Chief Compliance Officer, US Employment Counsel and the Director of Internal Audit (except in cases where the complaint refers to one of them). The material complaints are referred immediately to the Chairman of the Board and the Audit Committee. Less serious complaints are reported to the Audit Committee on a quarterly basis.
Interested parties who have a concern about the Company’s conduct, including accounting, internal accounting controls or audit matters, may communicate directly with the Company’s Chairman, Deputy Chairman, directors as a group, the Chairman of the Audit Committee or Audit Committee members. These communications may be confidential or anonymous, and may be submitted in writing to the Company Secretary at the Company’s corporate headquarters or submitted by phone on +353 (0)1 411 6924. All concerns will be forwarded to the appropriate
| James Hardie 2016 Annual Report on Form 20-F | 82 |
directors for their review and will be simultaneously reviewed and addressed by the Company’s General Counsel and Chief Compliance Officer in the same way that other concerns are addressed. The Company’s Code of Conduct, which is described above, prohibits any employee from retaliating or taking any adverse action against anyone for raising or helping to resolve a concern about integrity.
Insider Trading
All directors and employees of the Company are subject to the Company’s Insider Trading Policy. Under the Insider Trading Policy, employees and directors may generally conduct transactions in the Company’s securities during a four week period beginning two days after the announcement of quarterly or full year results, or such other periods as may be designated by the Board; provided that such persons are not in possession of material, non-public information. The Insider Trading Policy also contains preclearance requirements for certain designated senior employees and directors, as well as general prohibitions on hedging activities or selling any shares for short-swing profit. There is a general prohibition on hedging unvested shares, options or RSUs.
The Board recognizes that it is the individual responsibility of each director and employee to ensure he or she complies with the Insider Trading Policy and applicable insider trading laws.
A copy of the Insider Trading Policy is available in the Corporate Governance section of the Company’s investor relations website (www.ir.jameshardie.com.au).
Principle 4: Safeguard Integrity in Corporate Reporting
Audit Committee
The Board has established the Audit Committee to oversee the adequacy and effectiveness of the Company’s accounting and financial policies and controls. The Audit Committee provides advice and assistance to the Board in fulfilling its responsibilities and, amongst other matters:
| • | overseeing the Company’s financial reporting process and reports on the results of its activities to the Board; |
| • | reviewing with management and the external auditor the Company’s annual and quarterly financial statements and reports to shareholders; discussing earnings releases as well as information and earnings guidance provided to analysts; |
| • | reviewing and assessing the Company’s risk management strategy, policies and procedures and the adequacy of the Company’s, policies, processes and frameworks for managing risk; |
| • | exercising general oversight of the appointment and provision of all external audit services to the Company, the remuneration paid to the external auditor, and the performance of the Company’s internal audit function; |
| • | reviewing the adequacy and effectiveness of the Company’s internal compliance and control procedures; |
| • | reviewing the Company’s compliance with legal and regulatory requirements; and |
| • | establishing procedures for complaints regarding accounting, internal accounting controls and auditing matters, including any complaints from whistle-blowers. |
| James Hardie 2016 Annual Report on Form 20-F | 83 |
A more complete description of these and other Audit Committee functions is contained in the Audit Committee’s Charter, a copy of which is available in the Corporate Governance section of the Company’s investor relations website (www.ir.jameshardie.com.au).
The Audit Committee meets at least quarterly in a separate executive session with the external auditor and internal auditor, respectively. The Chairman of the Audit Committee reports to the full Board following each Audit committee meeting. As part of such report, the Chairman of the Audit Committee will inform the Board of any general issues that arise with respect to the quality or integrity of the Company’s financial statements, the Company’s compliance with legal or regulatory requirements, the Company’s risk management framework, the performance and independence of the external auditor, or the performance of the internal audit function.
The current members of the Audit Committee are Brian Anderson (Chairman), Michael Hammes, David Harrison, Andrea Gisle Joosen and Alison Littley, all of whom are independent non-executive directors. All members of the Audit Committee are financially literate and have sufficient business, industry and financial expertise to act effectively as members of the Audit Committee. In addition, in accordance with the SEC rules, the Nominating and Governance Committee and the Board have determined that Mr Anderson and Mr Harrison qualify as “audit committee financial experts.” The skills, qualifications, experience and relevant expertise for each member are summarized in the Board biography section of this Annual Report.
Internal Audit
The Vice President of Internal Audit heads the internal audit department. It is the role of the internal audit department to provide assurance, independent of management, that the Company’s internal processes, controls and procedures are operating to provide an effective financial reporting and risk management framework. The Internal Audit Charter sets out the independence of the internal audit department, its scope of work, responsibilities and audit plan. The internal audit department’s work plan is approved annually by the Audit Committee. The Vice President of Internal Audit reports to the Chairman of the Audit Committee and meets quarterly with the Audit Committee in executive sessions.
External Audit
Ernst & Young LLP has served as the Company’s external auditors since fiscal year 2009. The external auditor reviews each quarterly and half-year consolidated financial statements and audits the full year consolidated financial statements. The external auditor attends each meeting of the Audit Committee, including an executive session where members of the Audit Committee are present. The Audit Committee has approved policies to ensure that all non-audit services performed by the external auditor, including the amount of fees payable for those services, receive prior approval. The Audit Committee also reviews the remuneration paid to the external auditor and makes recommendations to the Board regarding the maximum compensation to be paid to the external auditor and concerning their reappointment as external auditor. The lead audit engagement partner is required to rotate every five years.
The Audit Committee reviews and approves management representations made to the external auditor as part of the audit of the full year results.
| James Hardie 2016 Annual Report on Form 20-F | 84 |
Representatives of Ernst & Young LLP are present at each AGM to make a statement if they desire to do so and are available to respond to appropriate questions from shareholders.
Consistent with applicable SEC rules, the CEO and CFO of the Company have provided the certifications required by Section 302 and 906 of the Sarbanes Oxley Act 2002, which, among other things, certify that to the best of each individual’s knowledge:
| • | the financial statements, and other financial information included in this Annual Report, fairly present in all material respects the financial condition, results of operations and cash flows of the Company as of, and for, the periods presented in this Annual Report; and |
| • | this Annual Report does not contain any untrue statement of a material fact or omit to state a material fact necessary to make the statements made, in light of the circumstances under which such statements were made, not misleading with respect to the period covered by this Annual Report. |
Principle 5: Make Timely and Balanced Disclosure
Continuous Disclosure and Market Communication
We strive to comply with all relevant disclosure laws and listing rules in Australia (ASX and ASIC) and the United States (SEC and NYSE).
Our Continuous Disclosure and Market Communication Policy aims to ensure timely communications so that investors can readily:
| • | understand the Company’s strategy and assess the quality of its management; |
| • | examine the Company’s financial position and the strength of its growth prospects; and |
| • | receive any news or information that might reasonably be expected to materially affect the price or market for the Company securities. |
The CEO is responsible for ensuring the Company complies with its continuous disclosure obligations. A Disclosure Committee comprised of senior management (CEO, CFO, General Counsel and the Vice President—Investor and Media Relations) is responsible for all decisions regarding market disclosure obligations outside of the Company’s normal financial reporting calendar. Both the Audit Committee and Nominating and Governance Committee reviewed the Company’s disclosure practices under the Continuous Disclosure and Market Communication policy during fiscal year 2016. A copy of the Continuous Disclosure and Market Communication policy is available in the Corporate Governance section of the Company’s investor relations website (www.ir.jameshardie.com.au).
Principle 6: Respect the Rights of Shareholders
Communication
The Company is committed to communicating effectively with the Company’s shareholders and engaging them through a range of communication channels in a program that includes:
| • | making management briefings and presentations accessible via a live webcast and/or teleconference following the release of quarterly and annual results; |
| • | audio webcasts of other management briefings and the annual shareholder meeting; |
| James Hardie 2016 Annual Report on Form 20-F | 85 |
| • | a comprehensive investor relations website that displays all announcements and notices (promptly after they have been cleared by the ASX), major management and investor road show presentations; |
| • | site visits and briefings on strategy for investment analysts; |
| • | regular engagement with institutional shareholders to discuss a wide range of governance issues; |
| • | an email alert service to advise shareholders and other interested parties of announcements and other events; and |
| • | equality of access for shareholders and investment analysts to briefings, presentations and meetings and equality of media access to the Company, on a reasonable basis. |
Shareholders can also elect to receive communications from the Company and its share registry, by electronic means. In addition, shareholders can communicate directly with the Company and its registry via the Company’s investor relations website (www.ir.jameshardie.com.au).
Annual General Meeting
The 2015 AGM was held in Ireland and shareholders were able to participate in the AGM via teleconference of proceedings on the Company’s investor relations website. The 2016 AGM will also be held in Ireland, and shareholders not present in Ireland who wish to participate in the meeting, including asking questions about the management of the Company, can do so via a teleconference of the meeting. In addition, shareholders have the opportunity to submit questions to the Company online or by returning the question form enclosed with the Notice of Meeting in advance of the meeting. Questions received from shareholders will be collated and the Chairman will address as many questions as possible at the meeting. Shareholders also have the opportunity to ask questions of the external auditor at the AGM about the conduct of the audit and the preparation of the auditor’s report.
Notices of Meeting are accompanied by explanatory notes which provide clear and concise information regarding the business to be transacted at the meeting.
Further details regarding the 2016 AGM will be set out in the 2016 AGM Notice of Meeting. This will be posted to all shareholders and made available on the Company’s website.
Each shareholder (other than an ADS holder) has the right to:
| • | attend the AGM either in person or by proxy; |
| • | speak at the AGM; and |
| • | exercise voting rights, including at the AGM, subject to their instructions on the Voting Instruction Form. |
While ADS holders cannot vote directly, ADS holders can direct the voting of their underlying shares through the ADS depositary.
Principle 7: Recognize and Manage Risk
Risk Management Objectives
The Company believes that sound risk management policies, procedures and controls produce a system of risk oversight, risk management and internal control that is fundamental to good
| James Hardie 2016 Annual Report on Form 20-F | 86 |
corporate governance and compliance and creation of shareholder value. The objective of the Company’s risk management policies, procedures and controls is to ensure that:
| • | the Company’s principal strategic, operational and financial risks are identified and assessed; |
| • | the Company’s risk appetite for each risk is considered; |
| • | effective systems are in place to monitor and manage risks; and |
| • | reporting systems, internal controls and arrangements for monitoring compliance with laws and regulations are adequate. |
Risk management does not involve avoiding all risks. The Company’s risk management policies seek to strike a balance between ensuring that the Company continues to generate financial returns while simultaneously managing risks appropriately by setting appropriate strategies, objectives, controls and tolerance levels.
The Company’s business, operations and financial condition are subject to various risks and uncertainties, including risks related to economic and regulatory concerns. See “Section 3 – Risk Factors” for a discussion of significant factors that may adversely affect our business, operations, financial performance and condition or industry, and for a discussion regarding how the Company manages certain of these risks.
Risk Management Framework
The Board and its standing Board committees oversee the Company’s overall strategic direction, including setting risk management strategy, processes, tolerance and parameters. Generally, the Audit Committee is responsible for oversight of the Company’s risk management strategy, policies, procedures and controls. The Audit Committee reviews, monitors and discusses these matters with the CEO, CFO, General Counsel, Vice President of Internal Audit and other senior business leaders. The Audit Committee, CEO, CFO and General Counsel report periodically to the Board on the Company’s risk management policies, processes and controls. The Audit Committee and the Board review and evaluate the Company’s risk management strategies and processes on an on-going basis throughout the course of each fiscal year.
The Audit Committee is supported in its oversight role by the policies put in place by management to oversee and manage material business risks, as well as the roles played by internal risk management committees, as described below, and internal and external audit functions. The internal and external audit functions are separate from and independent of each other and each has a direct reporting line to the Audit Committee. The CEO and the CEO’s direct reports are the primary management forum for risk assessment and management within the Company.
Consistent with its oversight functions, the Audit Committee reviewed the Company’s risk management framework and internal controls during fiscal year 2016. As part of the review, information was reported by management to the Audit Committee to enable it to assess the effectiveness of the Company’s risk management and internal control systems. In addition, consistent with the requirements of Section 404 of the Sarbanes-Oxley Act of 2002, during fiscal year 2016, management assessed the effectiveness of the Company’s internal controls over financial reporting and the effectiveness of the Company’s internal control over financial reporting has been audited by Ernst & Young LLP. Based on its assessment, management concluded that the Company’s internal controls over financial reporting were effective as of 31 March 2016. For additional information, see “Section 3 – Controls and Procedures” of this Annual Report.
| James Hardie 2016 Annual Report on Form 20-F | 87 |
Risk Management Committees
The Company maintains two separate management level risk committees, one for operation-related risks and one for corporate-related risks (the “Risk Management Committees”). This structure allows each committee to focus on individual risks in greater detail. Each committee comprises a cross-functional group of employees who review and monitor the risks facing the Company from the perspective of their area of responsibility. These Risk Management Committees are coordinated by Internal Audit and the General Counsel. The Vice President of Internal Audit and the General Counsel also provide quarterly reports to the Audit Committee on key risks and the procedures in place for mitigating them.
Financial Statements Disclosure Committee
The Financial Statements Disclosure Committee is a management committee comprised of senior finance, accounting, compliance, legal, tax, treasury and investor relations executives in the Company, which meets with the CEO, CFO and General Counsel prior to the Board’s consideration of any quarterly or annual results. The Financial Statements Disclosure Committee is a forum for the CEO, CFO and General Counsel to discuss, and, on the basis of those discussions, report to the Audit Committee, about a range of risk management procedures, policies and controls, covering the draft results materials, business unit financial performance and the current status of legal, tax, treasury, accounting, compliance, internal audit, complaints and disclosure control matters.
Policies for Management of Material Business Risks
Management has put in place a number of key policies, processes and independent controls to provide assurance as to the integrity of the Company’s systems of internal control and risk management. In addition to the measures described elsewhere in this Annual Report, the more significant policies, processes or controls adopted by the Company for oversight and management of material business risks are:
| • | engagement with members of the Risk Management Committees at least quarterly to assess the key strategic, operations, reporting and compliance risks facing the Company, the level of risk and the processes implemented to manage each of these key risks over the upcoming twelve months; |
| • | quarterly reporting to executive management, the Audit Committee, and annual reporting to the Board, of the Risk Management Committees’ assessment regarding the key strategic, operations, reporting and compliance risks facing the Company; |
| • | a program for the Audit Committee to review in detail each year the Company’s general risk tolerance and all items identified by the Risk Management Committees as high focus risks; |
| • | quarterly meetings of the Financial Statements Disclosure Committee to review all quarterly and annual financial statements and results; |
| • | an internal audit department with a direct reporting line to the Chairman of the Audit Committee; |
| • | regular monitoring of the liquidity and status of the Company’s finance facilities; |
| • | maintaining an appropriate global insurance program; |
| • | maintaining policies and procedures in relation to treasury operations, including the use of financial derivatives and issuing procedures requiring significant capital and recurring expenditure approvals; and |
| James Hardie 2016 Annual Report on Form 20-F | 88 |
| • | implementing and maintaining training programs in relation to legal and regulatory compliance issues such as trade practices/antitrust, insider trading, foreign corrupt practices and anti-bribery, employment law matters, trade secrecy and intellectual property protection. |
Limitations of Control Systems
Due to the inherent limitations in all control systems and the fact that there are resource constraints in the design of any control system, management does not expect that the Company’s internal risk management and control systems will prevent or detect all error and all fraud. No matter how well it is designed and operated, no evaluation of controls can provide absolute assurance that misstatements due to error or fraud will not occur or that all control issues and instances of fraud, if any, within the Company have been detected.
The inherent limitations in all control systems include the realities that judgments in decision making can be faulty and that breakdowns can occur because of simple error or mistake. Controls can also be circumvented by the individual acts of some persons, by collusion of two or more people, or by management override of the controls. The design of any system of controls is based in part on certain assumptions about the likelihood of future events, and there can be no assurance that any design will succeed in achieving its stated goals under all potential future conditions. Projections of any evaluation of controls’ effectiveness to future periods are subject to risks. Over time, controls may become inadequate because of changes in conditions or deterioration in the degree of compliance with policies or procedures.
Principle 8: Remunerate Fairly and Responsibly
Remuneration Committee
The Remuneration Committee oversees the Company’s overall remuneration structure, policies and programs, assesses whether the Company’s remuneration structure establishes appropriate incentives for management and employees, and approves any significant changes in the Company’s remuneration structure, policies and programs. Amongst other things, the Remuneration Committee:
| • | administers and makes recommendations on the Company’s incentive compensation and equity-based remuneration plans; |
| • | reviews the remuneration of directors; |
| • | reviews the remuneration framework for the Company; and |
| • | makes recommendations to the Board on the Company’s recruitment, retention and termination policies and procedures for senior management. |
The current members of the Remuneration Committee are David Harrison (Chairman), Brian Anderson, Russell Chenu, Michael Hammes and Alison Littley, the majority of whom are independent non-executive directors.
A more complete description of these and other Remuneration Committee functions is contained in the Remuneration Committee’s Charter, a copy of which is available in the Corporate Governance section of the Company’s investor relations website (www.ir.jameshardie.com.au), and in “Section 1 – Remuneration”. In addition, details of the Company’s remuneration philosophy, policies, plans and procedures during fiscal year 2016 are set out in “Section 1 – Remuneration”.
| James Hardie 2016 Annual Report on Form 20-F | 89 |
Forward-Looking Statements
This Annual Report contains forward-looking statements. James Hardie may from time to time make forward-looking statements in its periodic reports filed with or furnished to the SEC, on Forms 20-F and 6-K, in its annual reports to shareholders, in offering circulars, invitation memoranda and prospectuses, in media releases and other written materials and in oral statements made by the Company’s officers, directors or employees to analysts, institutional investors, existing and potential lenders, representatives of the media and others. Statements that are not historical facts are forward-looking statements and such forward-looking statements are statements made pursuant to the safe harbor provisions of the Private Securities Litigation Reform Act of 1995.
Examples of forward-looking statements include:
| • | statements about the Company’s future performance; |
| • | projections of the Company’s results of operations or financial condition; |
| • | statements regarding the Company’s plans, objectives or goals, including those relating to strategies, initiatives, competition, acquisitions, dispositions and/or its products; |
| • | expectations concerning the costs associated with the suspension or closure of operations at any of the Company’s plants and future plans with respect to any such plants; |
| • | expectations concerning the costs associated with the significant capital expenditure projects at any of the Company’s plants and future plans with respect to any such projects; |
| • | expectations regarding the extension or renewal of the Company’s credit facilities including changes to terms, covenants or ratios; |
| • | expectations concerning dividend payments and share buy-backs; |
| • | statements concerning the Company’s corporate and tax domiciles and structures and potential changes to them, including potential tax charges; |
| • | statements regarding tax liabilities and related audits, reviews and proceedings; |
| • | expectations about the timing and amount of contributions to (AICF), a special purpose fund for the compensation of proven Australian asbestos-related personal injury and death claims; |
| • | expectations concerning the adequacy of the Company’s warranty provisions and estimates for future warranty-related costs; |
| • | statements regarding the Company’s ability to manage legal and regulatory matters (including, but not limited to, product liability, environmental, intellectual property and competition law matters) and to resolve any such pending legal and regulatory matters within current estimates and in anticipation of certain third-party recoveries; and |
| • | statements about economic conditions, such as changes in the US economic or housing recovery or changes in the market conditions in the Asia Pacific region, the levels of new home construction and home renovations, unemployment levels, changes in consumer income, changes or stability in housing values, the availability of mortgages and other |
| James Hardie 2016 Annual Report on Form 20-F | 90 |
| financing, mortgage and other interest rates, housing affordability and supply, the levels of foreclosures and home resales, currency exchange rates, and builder and consumer confidence. |
Words such as “believe,” “anticipate,” “plan,” “expect,” “intend,” “target,” “estimate,” “project,” “predict,” “forecast,” “guideline,” “aim,” “will,” “should,” “likely,” “continue,” “may,” “objective,” “outlook” and similar expressions are intended to identify forward-looking statements but are not the exclusive means of identifying such statements. Readers are cautioned not to place undue reliance on these forward-looking statements and all such forward-looking statements are qualified in their entirety by reference to the following cautionary statements.
Forward-looking statements are based on the Company’s current expectations, estimates and assumptions and because forward-looking statements address future results, events and conditions, they, by their very nature, involve inherent risks and uncertainties, many of which are unforeseeable and beyond the Company’s control. Such known and unknown risks, uncertainties and other factors may cause actual results, performance or other achievements to differ materially from the anticipated results, performance or achievements expressed, projected or implied by these forward-looking statements. These factors, some of which are discussed under “Risk Factors” in Section 3 of this Annual Report, include, but are not limited to: all matters relating to or arising out of the prior manufacture of products that contained asbestos by current and former James Hardie subsidiaries; required contributions to AICF, any shortfall in AICF funding and the effect of currency exchange rate movements on the amount recorded in the Company’s financial statements as an asbestos liability; the continuation or termination of the governmental loan facility to AICF; compliance with and changes in tax laws and treatments; competition and product pricing in the markets in which the Company operates; the consequences of product failures or defects; exposure to environmental, asbestos, putative consumer possible outcome or other legal proceedings; general economic and market conditions; the supply and cost of raw materials; possible increases in competition and the potential that competitors could copy the Company’s products; reliance on a small number of customers; a customer’s inability to pay; compliance with and changes in environmental and health and safety laws; risks of conducting business internationally; compliance with and changes in laws and regulations; currency exchange risks; dependence on customer preference and the concentration of the Company’s customer base on large format retail customers, distributors and dealers; dependence on residential and commercial construction markets; the effect of adverse changes in climate or weather patterns; possible inability to renew credit facilities on terms favorable to the Company, or at all; acquisition or sale of businesses and business segments; changes in the Company’s key management personnel; inherent limitations on internal controls; use of accounting estimates; and all other risks identified in the Company’s reports filed with Australian, Irish and US securities regulatory agencies and exchanges (as appropriate). The Company cautions you that the foregoing list of factors is not exhaustive and that other risks and uncertainties may cause actual results to differ materially from those referenced in the Company’s forward-looking statements. Forward-looking statements speak only as of the date they are made and are statements of the Company’s current expectations concerning future results, events and conditions. The Company assumes no obligation to update any forward-looking statements or information except as required by law.
| James Hardie 2016 Annual Report on Form 20-F | 91 |
MANAGEMENT’S DISCUSSION AND ANALYSIS
The following discussion of our financial condition and results of operations should be read in conjunction with our consolidated financial statements and the related notes, including the accounting policies affecting our financial condition and results of operations, which are fully described in Note 2 to our consolidated financial statements, presented later in this Annual Report.
In the following discussion and analysis, we intend to provide management’s explanation of the factors that have affected our financial condition and results of operations for the fiscal years covered by the financial statements included in this Annual Report, as well as management’s assessment of the factors and trends which are anticipated to have a material effect on our financial condition and results of operations in future periods.
The following discussion and analysis includes several non-GAAP measures to provide additional information concerning our performance. We believe that these non-GAAP measures enhance an investor’s overall understanding of our financial performance by being more reflective of our core operational activities and more comparable with our financial results over various periods. In addition, management use non-GAAP financial measures internally for strategic decision making, forecasting future results and evaluating current performance. Non-GAAP financial measures discussed include:
| • | Adjusted operating income and operating income margin |
| • | Adjusted net income |
| • | Adjusted effective tax rate |
| • | Adjusted selling, general and administrative expenses |
We have reconciled these non-GAAP financial measures to the most directly comparable US GAAP financial measure for fiscal years 2016, 2015 and 2014 in the “Glossary of Abbreviations and Definitions” in Section 4 of this Annual Report. These non-GAAP financial measures are not prepared in accordance with US GAAP; therefore, the information is not necessarily comparable to other companies’ financial information and should be considered as a supplement to, not a substitute for, or superior to, the corresponding measures calculated in accordance with US GAAP.
Application of Critical Accounting Policies
The preparation of our financial statements requires management to make estimates and judgments that affect the reported amounts of assets and liabilities, the disclosure of contingent liabilities at the date of the financial statements and the reported revenue and expenses during the periods presented therein. On an ongoing basis, management evaluates its estimates and judgments in relation to assets, liabilities, contingent liabilities, revenue and expenses. Management bases its estimates and judgments on historical experience and on various other factors it believes to be reasonable under the circumstances, the results of which form the basis of making judgments about the carrying values of assets and liabilities that are not readily apparent from other sources. Actual results may differ from these estimates under different assumptions and conditions.
| James Hardie 2016 Annual Report on Form 20-F | 92 |
We have identified the following critical accounting policies under which significant judgments, estimates and assumptions are made and where actual results may differ from these estimates under different assumptions and conditions and may materially affect financial results or the financial position reported in future periods:
Accounting for the AFFA
The AFFA was approved by shareholders in February 2007 to provide long-term funding to AICF. For a discussion of the AFFA and the accounting policies utilized by the Company related to the AFFA and AICF, see Note 2 in the consolidated financial statements.
The amount of the asbestos liability has been recognized by reference to (but not exclusively based upon) the most recent actuarial estimate of projected future cash flows as calculated by KPMGA Pty Ltd (“KPMGA”), who are engaged and appointed by AICF under the terms of the AFFA. Based on their assumptions, KPMGA arrived at a range of possible total future cash flows and calculated a central estimate, which is intended to reflect a probability-weighted expected outcome of those actuarially estimated future cash flows projected by the actuary to occur through 2077. We recognize the asbestos liability in the consolidated financial statements by reference to (but not exclusively based upon) the central estimate.
Adjustments in the asbestos liability due to changes in the actuarial estimate of projected future cash flows and changes in the estimate of future operating costs of AICF are reflected in the consolidated statements of operations and comprehensive income during the period in which they occur. Claims paid by AICF and claims-handling costs incurred by AICF are treated as reductions in the accrued balances previously reflected in the consolidated balance sheets.
In estimating the potential financial exposure, KPMGA has made a number of assumptions, including, but not limited to, assumptions related to the total number of claims that are reasonably estimated to be asserted through 2077, the typical cost of settlement (which is sensitive to, among other factors, the industry in which a plaintiff claims exposure, the alleged disease type and the jurisdiction in which the action is brought), the legal costs incurred in the litigation of such claims, the rate of receipt of claims, the settlement strategy in dealing with outstanding claims and the timing of settlements.
Due to inherent uncertainties in the legal and medical environment, the number and timing of future claim notifications and settlements, the recoverability of claims against insurance contracts, and estimates of future trends in average claim awards, as well as the extent to which the above named entities will contribute to the overall settlements, the actual amount of liability could differ materially from that which is currently projected.
We recognize the asbestos liability in the consolidated financial statements on an undiscounted and uninflated basis. We considered discounting when determining the best estimate under US GAAP. We have recognized the asbestos liability by reference to (but not exclusively based upon) the central estimate as undiscounted on the basis that it is our view that the timing and amounts of such cash flows are not fixed or readily determinable. We considered inflation when determining the best estimate under US GAAP. It is our view that there are material uncertainties in estimating an appropriate rate of inflation over the extended period of the AFFA. We view the undiscounted and uninflated central estimate as the best estimate under US GAAP.
| James Hardie 2016 Annual Report on Form 20-F | 93 |
An updated actuarial assessment is performed as of 31 March each year. Any changes in the estimate will be reflected as a charge or credit to the consolidated statements of operations for the year then ended. Material adverse changes to the actuarial estimate would have an adverse effect on our business, results of operations and financial condition. A copy of KPMGA’s actuarial assessment as at 31 March 2016 is available on the Investor Relations area of our website (www.ir.jameshardie.com.au).
Sales Rebates and Discounts
We record estimated reductions to sales for customer rebates and discounts including volume, promotional, cash and other rebates and discounts. Rebates and discounts are recorded based on management’s best estimate when products are sold. The estimates are based on historical experience for similar programs and products. Management reviews these rebates and discounts on an ongoing basis and the related accruals are adjusted, if necessary, as additional information becomes available.
Accounts Receivable
We evaluate the collectability of accounts receivable on an ongoing basis based on historical bad debts, customer credit-worthiness, current economic trends and changes in our customer payment activity. An allowance for doubtful accounts is provided for known and estimated bad debts. Although credit losses have historically been within our expectations, we cannot guarantee that we will continue to experience the same credit loss rates that we have in the past. Because our accounts receivable are concentrated in a relatively small number of customers, a significant change in the liquidity or financial position of any of these customers could impact their ability to make payments and result in the need for additional allowances which would decrease our net sales.
Inventory
Inventories are recorded at the lower of cost or market. In order to determine market, management regularly reviews inventory quantities on hand and evaluates significant items to determine whether they are excess, slow-moving or obsolete. The estimated value of excess, slow-moving and obsolete inventory is recorded as a reduction to inventory and an expense in cost of sales in the period in which it is identified. This estimate requires management to make judgments about the future demand for inventory and is therefore at risk to change from period to period. If our estimate for the future demand for inventory is greater than actual demand and we fail to reduce manufacturing output accordingly, we could be required to record additional inventory reserves, which would have a negative impact on our gross profit.
Further, we have distributor arrangements that we maintain with certain customers where we own inventory that is physically located in a customer’s or third party’s warehouse. As a result, our ability to effectively manage inventory levels may be impaired, which would cause our total inventory turns to decrease. In that event, our expenses associated with excess and obsolete inventory could increase and our cash flow could be negatively impacted.
| James Hardie 2016 Annual Report on Form 20-F | 94 |
Accrued Warranty Reserve
We have offered, and continue to offer, various warranties on our products, including a 30-year limited warranty on certain of our fiber cement siding products in the United States. Because our fiber cement products have only been used in North America since the early 1990s, there is a risk that these products will not perform in accordance with our expectations over an extended period of time. A typical warranty program requires that we replace defective products within a specified time period from the date of sale. We record an estimate for future warranty-related costs based on an analysis by us, which includes the historical relationship of warranty costs to installed product. Based on this analysis and other factors, we adjust the amount of our warranty provisions as necessary. Although our warranty costs have historically been within calculated estimates, if our experience is significantly different from our estimates, it could result in the need for additional reserves.
Accounting for Income Tax
We recognize deferred tax assets and deferred tax liabilities for the expected tax consequences of temporary differences between the tax bases of assets and liabilities and their reported amounts using enacted tax rates in effect for the year in which we expect the differences to reverse. We record a valuation allowance to reduce the deferred tax assets to the amount that we are more likely than not to realize. We must assess whether, and to what extent, we can recover our deferred tax assets. If full or partial recovery is unlikely, we must increase our income tax expense by recording a valuation allowance against the portion of deferred tax assets that we cannot recover. We believe that we will recover all of the deferred tax assets recorded (net of valuation allowance) on our consolidated balance sheet at 31 March 2016. However, if facts later indicate that we will be unable to recover all or a portion of our net deferred tax assets, our income tax expense would increase in the period in which we determine that recovery is unlikely.
We evaluate our uncertain tax positions in accordance with the guidance for accounting for uncertainty in income taxes. We believe that our reserve for uncertain tax positions, including related interest, is adequate. Due to our size and the nature of our business, we are subject to ongoing reviews by taxing jurisdictions on various tax matters, including challenges to various positions we assert on our income tax returns. The amounts ultimately paid upon resolution of these matters could be materially different from the amounts previously included in our income tax expense and therefore could have a material impact on our tax provision, net income and cash flows. Positions taken by an entity in its income tax returns must satisfy a more-likely-than-not recognition threshold, assuming that the positions will be examined by taxing authorities with full knowledge of all relevant information, in order for the positions to be recognized in the consolidated financial statements. Each quarter we evaluate the income tax positions taken, or expected to be taken, to determine whether these positions meet the more-likely-than-not threshold. We are required to make subjective judgments and assumptions regarding our income tax exposures and must consider a variety of factors, including the current tax statutes and the current status of audits performed by tax authorities in each tax jurisdiction. To the extent an uncertain tax position is resolved for an amount that varies from the recorded estimated liability, our income tax expense in a given financial statement period could be materially affected.
| James Hardie 2016 Annual Report on Form 20-F | 95 |
Impairment of Long-Lived Assets
Long-lived assets, such as property, plant and equipment, are evaluated each quarter for events or changes in circumstances that indicate that an asset might be impaired because the carrying amount of the asset may not be recoverable. These include, without limitation, a significant adverse change in the extent or manner in which a long-lived asset or asset group is being used, a current period operating or cash flow loss combined with a history of operating or cash flow losses, a projection or forecast that demonstrates continuing losses associated with the use of a long-lived asset or asset group and/or a current expectation that it is more likely than not that a long-lived asset or asset group will be sold or otherwise disposed of significantly before the end of its previously estimated useful life. Identifying these events and changes in circumstances, and assessing their impact on the appropriate valuation of the affected assets requires us to make judgments, assumptions and estimates.
When such indicators of potential impairment are identified, recoverability is tested by grouping long-lived assets that are used together and represent the lowest level for which cash flows are identifiable and distinct from the cash flows of other long-lived assets, which is typically at the production line or plant facility level, depending on the type of long-lived asset subject to an impairment review. Recoverability is measured by a comparison of the carrying amount of the asset group to the estimated undiscounted future cash flows expected to be generated by the asset group. If the carrying amount exceeds the estimated undiscounted future cash flows, an impairment charge is recognized at the amount by which the carrying amount exceeds the estimated fair value of the asset group.
The methodology used to estimate the fair value of the asset group is typically based on a discounted cash flow analysis that considers the asset group’s highest and best use that would maximize the value of the asset group. In addition, the estimated fair value of an asset group also considers, to the extent practicable, a market participant’s expectations and assumptions in estimating the fair value of the asset group. If the estimated fair value of the asset group is less than the carrying value, an impairment loss is recognized at an amount equal to the excess of the carrying value over the estimated fair value of the asset group.
During the years ended 31 March 2016, 2015 and 2014, the Company recorded US$3.5 million, US$3.7 million and nil of impairment charges related to individual assets which is included in Cost of goods sold on the consolidated statements of operations and comprehensive income.
In estimating the fair value of the asset group, we are required to make certain estimates and assumptions that include forecasting the useful lives of the assets, selecting an appropriate discount rate that reflects the risk inherent in future cash flows, forecasting market demand for our products and recommissioning idle assets to meet anticipated capacity constraints in the future. We have not made any material changes in the accounting methodology we use to assess impairment loss during the past three fiscal years. However, if actual results are not consistent with our estimates and assumptions used in estimating future cash flows and asset fair values, we may be exposed to material impairment losses in future periods.
| James Hardie 2016 Annual Report on Form 20-F | 96 |
Operating Results
Year ended 31 March 2016 compared to year ended 31 March 2015
Operating results for the consolidated group were as follows:
| US$ Millions | FY16 | FY15 | Change % | |||||||||
| Net sales |
$ | 1,728.2 | $ | 1,656.9 | 4 | |||||||
| Cost of goods sold |
(1,096.0 | ) | (1,078.1 | ) | (2 | ) | ||||||
|
Gross profit |
632.2 | 578.8 | 9 | |||||||||
| Selling, general and administrative expenses |
(254.2 | ) | (245.5 | ) | (4 | ) | ||||||
| Research and development expenses |
(29.5 | ) | (31.7 | ) | 7 | |||||||
| Asbestos adjustments |
5.5 | 33.4 | (84 | ) | ||||||||
|
Operating income |
354.0 | 335.0 | 6 | |||||||||
| Net interest expense |
(25.6 | ) | (7.5 | ) | ||||||||
| Other income (expense) |
2.1 | (4.9 | ) | |||||||||
| Income before income taxes |
330.5 | 322.6 | 2 | |||||||||
| Income tax expense |
(86.1 | ) | (31.3 | ) | ||||||||
|
Net income |
$ | 244.4 | $ | 291.3 | (16 | ) | ||||||
| James Hardie 2016 Annual Report on Form 20-F | 97 |
North America and Europe Fiber Cement Results
Operating results for the North America and Europe Fiber Cement segment were as follows:
| FY16 | FY15 | Change % | ||||||||||
| Volume (mmsf) |
2,000.5 | 1,849.7 | 8% | |||||||||
| Average net sales price per unit (per msf) |
US$676 | US$675 | FLAT | |||||||||
| Net sales (US$ millions) |
1,386.3 | 1,276.5 | 9% | |||||||||
| Gross profit |
15% | |||||||||||
| Gross margin (%) |
2.2 pts | |||||||||||
| Operating income (US$ millions) |
340.6 | 285.9 | 19% | |||||||||
| Operating income margin (%) |
24.6 | 22.4 | 2.2 pts | |||||||||
Net sales for fiscal year 2016 were favorably impacted by higher volumes. The increase in our sales volume in fiscal year 2016 compared to fiscal year 2015 was primarily driven by growth in the repair and remodel and new construction markets and modest market penetration. For fiscal year 2016 average net sales price was flat, when compared fiscal year 2015. For fiscal year 2016 gross price was up in line with our price increase effective 1 March 2015; offset by the unfavorable impact of foreign exchange, mix and the overall price performance in Europe.
We note that there are a number of data sources that measure US housing market growth, most of which have reported steady double-digit growth in recent quarters when compared to prior corresponding periods. However, at the time of filing our fiscal year 2016 results, only US Census Bureau data was available. According to the US Census Bureau, single family housing starts for the year ended 31 March 2016, single family housing starts were 745,700, or 17% above the year ended 31 March 2015.
While we have provided US Census Bureau data above, we note that it typically trends higher than other indices we use to measure US housing market growth, namely the McGraw-Hill Construction Residential Starts Data (also known as Dodge), the National Association of Home Builders and Fannie Mae.
The increase in gross margin of 2.2 percentage points for fiscal year 2016 is due to the following components:
| Higher average net sales price |
0.4 pts | |||
| Lower production costs |
1.8 pts | |||
|
|
|
|||
| Total percentage point change in gross margin |
2.2 pts | |||
|
|
|
Production costs for fiscal year 2016 were lower than fiscal year 2015, primarily as a result of our manufacturing plant network’s improved performance when compared to fiscal year 2015, as well as lower freight and lower input costs for pulp and utilities.
| James Hardie 2016 Annual Report on Form 20-F | 98 |
For fiscal year 2016, operating income of US$340.6 million, increased 19% over fiscal year 2015, reflecting lower freight, improved plant performance, lower unit costs and increased volumes; unfavorably impacted by higher segment SG&A expenses, primarily reflecting higher employee costs and marketing expenses. As a percentage of segment sales, fiscal year 2016 SG&A remained flat compared to fiscal year 2015.
Operating income margin for fiscal year 2016 increased 2.2 percentage points to 24.6% from 22.4% in fiscal year 2015, driven by higher net sales and lower production costs; partially offset by the adverse impact of the strengthening US dollar and overall performance of the European business.
Asia Pacific Fiber Cement Results
Operating results for the Asia Pacific Fiber Cement segment in US dollars were as follows:
| FY16 | FY15 | Change % | ||||||||||
|
Volume (mmsf) |
449.6 | 456.2 | (1%) | |||||||||
| Volume (mmsf) excluding the Pipes Australian business |
439.8 | 414.7 | 6% | |||||||||
| Net sales (US$ millions) |
341.9 | 380.4 | (10%) | |||||||||
| US$ Gross profit |
(11%) | |||||||||||
| US$ Gross margin (%) |
(0.5 pts) | |||||||||||
| Operating income (US$ millions) |
80.9 | 94.1 | (14%) | |||||||||
| New Zealand weathertightness claims (US$ millions) |
(0.5) | 4.3 | ||||||||||
| Operating income excluding NZ weathertightness claims (US$ millions) |
81.4 | 89.8 | (9%) | |||||||||
| US$ Operating income margin (%) |
23.7 | 24.7 | (1.0 pts) | |||||||||
|
US$ Operating income margin excluding NZ weathertightness claims (%) |
23.8 | 23.6 | 0.2 pts | |||||||||
| James Hardie 2016 Annual Report on Form 20-F | 99 |
For the fiscal year 2016, the Asia Pacific Fiber Cement segment results in US dollars were unfavorably impacted for a 19% change in the weighted average AUD/USD foreign exchange rate relative to fiscal year 2015. Operating results for the Asia Pacific Fiber Cement segment in Australian dollars were as follows:
| FY16 | FY15 | Change % | ||||||||||
| Volume (mmsf) |
449.6 | 456.2 | (1%) | |||||||||
| Volume (mmsf) excluding the Pipes Australian business |
439.8 | 414.7 | 6% | |||||||||
| Average net sales price per unit (per msf) |
A$ | 1,020 | A$942 | 8% | ||||||||
| Net sales (A$ millions) |
464.2 | 434.5 | 7% | |||||||||
| A$ Gross profit |
5% | |||||||||||
| A$ Gross margin (%) |
(0.5 pts) | |||||||||||
| Operating income (A$ millions) |
110.0 | 107.4 | 2% | |||||||||
| New Zealand weathertightness claims (A$ millions) |
(0.7) | 4.9 | ||||||||||
| Operating income excluding NZ weathertightness claims (A$ millions) |
110.7 | 102.5 | 8% | |||||||||
| A$ Operating income margin (%) |
23.7 | 24.7 | (1.0 pts) | |||||||||
| A$ Operating income margin excluding NZ weathertightness claims (%) |
23.8 | 23.6 | 0.2 pts | |||||||||
Volume for fiscal year 2016 was lower than fiscal year 2015 due to the sale of the Australian Pipes business at the end of the first quarter of fiscal year 2016. Net sales in Australian dollars for fiscal year 2016 were higher than fiscal year 2015 primarily due to a higher average net sales price. The increase in our net sales price in fiscal year 2016 reflects the effects of our annual price increase, favorable product and regional mix and the appreciation of the Philippines currency against the Australian dollar, when compared to fiscal year 2015.
In our Australian business the key drivers of net sales growth, for fiscal year 2016, were favorable conditions in our addressable markets, the favorable impact of our price increase and favorable product mix. In our New Zealand business, volume grew across most regions; however, net sales growth was partially offset by a lower average net selling price due to unfavorable product mix. In our Philippines business, net sales in fiscal year 2016 were higher than fiscal year 2015 driven by growth in our addressable markets, continued market penetration and favorable impact of our price increase.
According to Australian Bureau of Statistics data, approvals for detached houses, which are a key driver of the Asia Pacific business’ sales volume, were 116,962 for the year ended 31 March 2016, a slight decrease, compared to fiscal year 2015. The other key driver of our sales volume is the alterations and additions market, which increased 5% for the 12 months ended 31 March 2016, compared to the fiscal year 2015.
| James Hardie 2016 Annual Report on Form 20-F | 100 |
According to Statistics New Zealand data, consents for dwellings excluding apartments, which are the primary driver of the New Zealand business’ net sales, were 15,167 for the year ended 31 March 2016, an increase of 13% over fiscal year 2015.
In Australian dollars, the decrease in gross margin of 0.5 percentage point for fiscal year 2016 is due to the following components:
| Higher average net sales price |
5.5 pts | |||
| Higher production costs |
(6.0 pts) | |||
|
|
|
|||
| Total percentage point change in gross margin |
(0.5 pts) | |||
|
|
|
Production costs for fiscal year 2016 were higher compared to fiscal year 2015, largely due to the cost associated with the startup of our Carole Park sheet machine and higher input prices driven by the unfavorable impact of the weakening of the Australian dollar on the price of USD denominated pulp. Additionally, during December 2014, we purchased the land and buildings previously leased at our Rosehill, New South Wales facility for A$45.0 million. As a result of the purchase we released remediation and straight line rent provisions required as a lessee, resulting in a favorable impact to cost of goods sold of US$3.0 for fiscal year 2015. As a result, production costs in fiscal year 2016 were higher than fiscal year 2015.
In Australian dollars, operating income (including New Zealand weathertightness claims) for fiscal year 2016 increased 2% over fiscal year 2015, driven by improved gross profit; partially offset by New Zealand weathertightness and higher SG&A expenses primarily related to marketing and compensation costs. For fiscal year 2016 we recorded an expense related to New Zealand Weathertightness, compared to a benefit in fiscal year 2015. SG&A as a percentage of net sales for fiscal year 2016 increased 0.6 percentage points compared to fiscal year 2015.
In Australian dollars, operating income (excluding New Zealand weathertightness claims) for fiscal year 2016 increased by 8% compared to fiscal year 2015
In the first quarter of fiscal year 2016, we finalized the sale of our Australian Pipes business, recognizing a gain on the sale of US$1.7 million, recorded in other (expense) income in the consolidated statement of operations and comprehensive income for fiscal year 2016. Due to the immaterial contribution of the Australian Pipes business to the segment results, the results of operations from the Australian Pipes business have not been presented as discontinued operations in the consolidated financial statements.
Research and Development Segment
We record R&D expenses depending on whether they are core R&D projects that are designed to benefit all business units, which are recorded in our R&D segment; or commercialization projects for the benefit of a particular business unit, which are recorded in the individual business unit’s segment results. The table below details the expenses of our R&D segment:
| US$ Millions | FY16 | FY15 | Change % | |||||||||
|
Segment R&D expenses |
$ | (21.7 | ) | $ | (24.2 | ) | 10 | |||||
|
Segment R&D SG&A expenses |
(2.2 | ) | (1.8 | ) | (22 | ) | ||||||
|
Total R&D operating loss |
$ | (23.9 | ) | $ | (26.0 | ) | 8 | |||||
| James Hardie 2016 Annual Report on Form 20-F | 101 |
The change in segment R&D expenses from fiscal year 2015 to fiscal year 2016 is a result of the adverse impact of the strengthening US dollar and the number of core R&D projects being worked on by the R&D team. The expense will fluctuate period to period depending on the nature and number of core R&D projects being worked on and the average AUD/USD exchange rates during the period.
Other R&D expenses associated with commercialization projects were US$7.8 million for fiscal year 2016, compared to US$7.5 million for fiscal year 2015.
General Corporate
Results for General Corporate for fiscal years 2016 and 2015 are as follows:
| US$ Millions | FY16 | FY15 | Change % | |||||||||
|
General Corporate SG&A expenses |
$ | (47.4 | ) | $ | (49.9 | ) | 5 | |||||
| Asbestos: |
||||||||||||
| Asbestos Adjustments |
5.5 | 33.4 | (84 | ) | ||||||||
|
AICF SG&A Expenses1 |
(1.7 | ) | (2.5 | ) | 32 | |||||||
|
General Corporate operating loss |
$ | (43.6 | ) | $ | (19.0 | ) | ||||||
| 1 | Relates to non-claims related operating costs incurred by AICF, which we consolidate into our financial results due to our pecuniary and contractual interests in AICF. Readers are referred to Notes 2 and 11 of our consolidated financial statements for further information on the Asbestos Adjustments. |
For fiscal year 2016, General Corporate SG&A expenses decreased by US$2.5 million, compared to fiscal year 2015. The decrease in General Corporate SG&A expenses is primarily driven by the non-recurring stamp duty of US$4.2 million incurred in the fourth quarter of fiscal year 2015; partially offset by higher stock compensation expenses of US$2.6 million driven by an increase in the US$ stock price.
Asbestos adjustments reflect a change in the actuarial estimate of the asbestos liability, insurance receivables, AICF claims handling costs and the foreign exchange translation impact of the Australian denominated asbestos related assets and liabilities being recorded on our consolidated balance sheet in US dollar at the reporting date for each respective period.
The AUD/USD spot exchange rates are shown in the table below:
| FY16 | FY15 | |||||||||
| 31 March 2015 |
0.7636 | 31 March 2014 | 0.9220 | |||||||
| 31 March 2016 |
0.7657 | 31 March 2015 | 0.7636 | |||||||
| Change ($) |
0.0021 | Change ($) | (0.1584 | ) | ||||||
| Change (%) |
- | Change (%) | (17% | ) | ||||||
| James Hardie 2016 Annual Report on Form 20-F | 102 |
For fiscal years 2016 and 2015, the asbestos adjustments recorded by the Company were made up of the following components:
| US$ Millions | FY16 | FY15 | Change % | |||||||||
|
Change in actuarial estimates |
$ | 8.1 | $ | (111.3 | ) | |||||||
|
Effect of foreign exchange rate movements |
(2.6 | ) | 144.7 | |||||||||
|
Asbestos adjustments |
$ | 5.5 | $ | 33.4 | (84 | ) | ||||||
Readers are referred to Notes 2 and 11 of our consolidated financial statements for further information on asbestos adjustments.
Per the KPMGA actuarial report, the undiscounted and uninflated central estimate net of insurance recoveries decreased to A$1.434 billion at 31 March 2016 from A$1.566 billion at 31 March 2015. The change in the undiscounted and uninflated central estimate of A$132.0 million or 8% is primarily due to the decrease in the projected future number of non-mesothelioma claims and lower average claims sizes and lower average defense legal cost assumptions for most disease types. This was partially offset by the change in legislation in Victoria, which allowed for gratuitous services costs to be included in certain types of future claims which had a A$56.9 million adverse impact on the central estimate.
During fiscal year 2016, mesothelioma claims reporting activity was marginally below actuarial expectations for the first year in the past four years. One of the more significant assumptions is the estimated peak period of mesothelioma disease claims, which is currently assumed to occur in the period 2014/2015 to 2016/2017. Potential variation in this estimate has an impact much greater than the other assumptions used to derive the discounted central estimate. In performing the sensitivity assessment of the estimated period of peak claims reporting for mesothelioma, if the peak claims reporting period was shifted two years from the currently assumed 2016/2017 (i.e. assuming that claim reporting begins to reduce after 2018/2019), together with increased claims reporting from 2026/2027 onwards, relative to current actuarial projections, the discounted central estimate could increase by approximately 30% on a discounted basis.
At 31 March 2016, KPMGA has formed the view that, due to the stable claims reporting in fiscal year 2016, no change to the assumption of mesothelioma claims is required. However, changes to the valuation assumptions may be necessary in future periods should mesothelioma claims reporting escalate or decline. Due to the uncertainty over the past four years, further volatility in relation to the valuation should be anticipated for at least the next few years.
The following is an analysis of claims data for the fiscal years ended 31 March:
| FY16 | FY15 | Change % | ||||||||||
|
Claims received |
577 | 665 | 13 | |||||||||
| Actuarial estimate for the period |
658 | 610 | (8 | ) | ||||||||
| Difference in claims received to actuarial estimate |
81 | (55 | ) | |||||||||
| Average claim settlement1 (A$) |
248,000 | 254,000 | 2 | |||||||||
| Actuarial estimate for the period2 (A$) |
302,000 | 289,000 | (4 | ) | ||||||||
|
Difference in claims paid to actuarial estimate (A$) |
54,000 | 35,000 | (54 | ) | ||||||||
| James Hardie 2016 Annual Report on Form 20-F | 103 |
| 1 | Average claims settlement is derived as the total amount paid divided by the number of non-nil claim settlements |
| 2 | This actuarial estimate is a function of the assumed experience by disease type and the relative mix of settlements assumed by disease type. Any variances in the assumed mix of settlements by disease type will have an impact on the average claim settlement experience. |
For the full year ended 31 March 2016, we noted the following related to asbestos-related claims:
| • | Claims received during fiscal year 2016 were 12% and 13% below actuarial estimates and fiscal year 2015 respectively; |
| • | Mesothelioma claims reported for the fiscal year 2016 are 1% below expectations and are 4% below fiscal year 2015; |
| • | The average claim settlement for fiscal year 2016 is lower by 18%, versus actuarial estimates; |
| • | Average claim settlement sizes are generally lower across all disease types compared to actuarial expectations for fiscal year 2016; and |
| • | The decrease in average claim settlement for the full year versus actuarial estimates is largely attributable to a lower number of large mesothelioma claims being settled compared to fiscal year 2015. |
Asbestos claims paid of A$154.7 million for fiscal year 2016 were lower than the actuarial expectation of A$176.3 million. All figures provided in this Claims Data section are gross of insurance and other recoveries
Net interest expense
Gross interest expense for fiscal year 2016 increased US$17.3 million, compared to fiscal year 2015, primarily as a result of interest incurred on our senior notes, which we issued in February 2015.
Other income (expense)
For fiscal year 2016 other income (expense) moved from a loss of US$4.9 million in fiscal year 2015 to a gain of US$2.1 million. The US$7.0 million favorable change in other (expense) income is due to a US$3.3 million favorable change in net foreign exchange forward contracts, a US$2.0 million favorable change in the unrealized gains and losses related to our interest rate swaps and US$1.7 million gain on the sale of the Australian Pipes business in the first quarter of fiscal year 2016.
Income tax expense
Total income tax expense for fiscal year 2016 increased by US$54.8 million from fiscal year 2015. The change was primarily due to a reduction in the change in actuarial estimate compared to fiscal year 2015.
Readers are referred to Note 15 of our consolidated financial statements for further information related to income tax.
| James Hardie 2016 Annual Report on Form 20-F | 104 |
Net income
Net income decreased from US$291.3 million in fiscal year 2015 to US$244.4 million in fiscal year 2016. Net income excluding asbestos, New Zealand weathertightness claims, non-recurring stamp duty and other tax adjustments increased 10% from US$221.4 million in fiscal year 2015 to US$242.9 million in fiscal year 2015.
Year ended 31 March 2015 compared to year ended 31 March 2014
Operating results for the consolidated group were as follows:
| US$ Millions | FY15 | FY14 | Change % | |||||||||
|
Net sales |
$ | 1,656.9 | $ | 1,493.8 | 11 | |||||||
|
Cost of goods sold |
(1,078.1 | ) | (987.4 | ) | (9 | ) | ||||||
|
Gross profit |
578.8 | 506.4 | 14 | |||||||||
| Selling, general and administrative expenses |
(245.5 | ) | (224.4 | ) | (9 | ) | ||||||
| Research and development expenses |
(31.7 | ) | (33.1 | ) | 4 | |||||||
|
Asbestos adjustments |
33.4 | (195.8 | ) | |||||||||
|
Operating income |
335.0 | 53.1 | ||||||||||
| Net interest expense |
(7.5 | ) | (1.1 | ) | ||||||||
|
Other (expense) income |
(4.9 | ) | 2.6 | |||||||||
| Income before income taxes |
322.6 | 54.6 | ||||||||||
|
Income tax (expense) benefit |
(31.3 | ) | 44.9 | |||||||||
|
Net income |
$ | 291.3 | $ | 99.5 | ||||||||
| James Hardie 2016 Annual Report on Form 20-F | 105 |
North America and Europe Fiber Cement Results
Operating results for the North America and Europe Fiber Cement segment were as follows:
| FY15 | FY14 | Change % | ||||||||||
| Volume (mmsf) |
1,849.7 | 1,696.9 | 9% | |||||||||
| Average net sales price per unit (per msf) |
US$675 | US$652 | 4% | |||||||||
| Net sales (US$ millions) |
1,276.5 | 1,127.6 | 13% | |||||||||
| Gross profit |
17% | |||||||||||
| Gross margin (%) |
1.1 pts | |||||||||||
| Operating income (US$ millions) |
285.9 | 237.0 | 21% | |||||||||
| Operating income margin (%) |
22.4 | 21.0 | 1.4 pts | |||||||||
Net sales for fiscal year 2015 were favorably impacted by higher volumes and a higher average net sales price. The increase in our sales volume in fiscal year 2015 compared to fiscal year 2014 was primarily driven by further market penetration and modest growth in the repair and remodel market and new construction market. Further, the increase in our average net sales price in fiscal year 2015 reflects the ongoing execution of our pricing strategies, favorable product mix and the reduction of pricing inefficiencies, when compared to the prior year.
We note that there are a number of indicators that measure US housing market growth, most of which have reported between low single digit growth and slight contraction in recent quarters when compared to prior corresponding periods. However, at the time of filing our fiscal year 2015 results, only the US Census Bureau data is available. According to the US Census Bureau, single family housing starts for the year ended 31 March 2015 were 638,800, 3% above fiscal year 2014.
While we have provided US Census Bureau data above, we note that it typically trends higher than other indices we use to measure US housing market growth, namely the McGraw-Hill Construction Residential Starts Data (also known as Dodge), the National Association of Home Builders and Fannie Mae.
| James Hardie 2016 Annual Report on Form 20-F | 106 |
The increase in gross margin of 1.1 percentage points for fiscal year 2015 is due to the following components:
| Higher average net sales price |
2.7 pts | |||
| Higher production costs |
(1.6 pts) | |||
|
|
|
|||
| Total percentage point change in gross margin |
1.1 pts | |||
|
|
|
Production costs for fiscal year 2015 were higher than fiscal year 2014, primarily due to higher input costs driven by the market prices for pulp, gas, silica and the costs incurred with starting up our Fontana, California plant in fiscal year 2015; partially offset by economies of scale achieved through a 9% increase in volume.
Fiscal year 2015 operating income of US$285.9 million, an increase of 21% over fiscal year 2014, primarily reflects increased volumes and a higher average net sales price; partially offset by higher SG&A, primarily reflecting higher compensation expenses due to increased headcount. As a percentage of segment sales, fiscal year 2015 SG&A expenses increased by 0.1 percentage points compared to fiscal year 2014.
Operating income margin for fiscal year 2015 increased 1.4 percentage points to 22.4% from 21.0% in fiscal year 2014, driven by higher net sales; partially offset by higher production costs.
Asia Pacific Fiber Cement Results
Operating results for the Asia Pacific Fiber Cement segment in US dollars were as follows:
| FY15 | FY14 | Change % | ||||||||||
| Volume (mmsf) |
456.2 | 417.2 | 9% | |||||||||
| Net sales (US$ millions) |
380.4 | 366.2 | 4% | |||||||||
| US$ Gross profit |
7% | |||||||||||
| US$ Gross margin (%) |
1.0 pts | |||||||||||
| Operating income (US$ millions) |
94.1 | 81.1 | 16% | |||||||||
| New Zealand weathertightness claims (US$ millions) |
4.3 | (1.8) | ||||||||||
| Operating income excluding NZ weathertightness claims (US$ millions) |
89.8 | 82.9 | 8% | |||||||||
| US$ Operating income margin (%) |
24.7 | 22.1 | 2.6 pts | |||||||||
| US$ Operating income margin excluding NZ weathertightness claims (%) |
23.6 | 22.6 | 1.0 pts | |||||||||
For fiscal year 2015, the Asia Pacific Fiber Cement segment results in US dollars were unfavorably impacted by the change in the weighted average period AUD/USD exchange rate
| James Hardie 2016 Annual Report on Form 20-F | 107 |
relative to fiscal year 2014. Operating results for the Asia Pacific Fiber Cement segment in Australian dollars were as follows:
| FY15 | FY14 | Change % | ||||||||||
| Volume (mmsf) |
456.2 | 417.2 | 9% | |||||||||
| Average net sales price per unit (per msf) |
A$942 | A$930 | 1% | |||||||||
| Net sales (A$ millions) |
434.5 | 392.4 | 11% | |||||||||
| A$ Gross profit |
14% | |||||||||||
| A$ Gross margin (%) |
1.0 pts | |||||||||||
| Operating income (A$ millions) |
107.4 | 86.9 | 24% | |||||||||
| New Zealand weathertightness claims (A$ millions) |
4.9 | (1.9) | ||||||||||
| Operating income excluding NZ weathertightness claims (A$ millions) |
102.5 | 88.8 | 15% | |||||||||
| A$ Operating income margin (%) |
24.7 | 22.1 | 2.6 pts | |||||||||
| A$ Operating income margin excluding NZ weathertightness claims (%) |
23.6 | 22.6 | 1.0 pts | |||||||||
Net sales in Australian dollars for fiscal year 2015 increased largely due to higher sales volumes and higher average net sales price, when compared to fiscal year 2014. In our Australian business, the key drivers of net sales growth were favorable conditions in our addressable markets and a favorable product mix. In our New Zealand business, volume grew across all regions; however, net sales growth was partially offset by a lower average selling price due to product mix. In our Philippines business, net sales were driven higher by growth in our addressable markets and continued market penetration.
According to Australian Bureau of Statistics data, approvals for detached houses, which are a key driver of the Asia Pacific business’ sales volume, were 114,676 for the year ended 31 March 2015, an increase of 9%, compared to fiscal year 2014. The other key driver of our sales volume is the alterations and additions market, which was flat for the 12 months ended 31 December 2014, compared to prior corresponding period.
According to Statistics New Zealand data, consents for dwellings excluding apartments, which are the primary driver of the New Zealand business’ net sales, were 23,168 for the year ended 31 March 2015, an increase of 12% over fiscal year 2014.
In Australian dollars, the increase in gross margin of 1.0 percentage point for fiscal year 2015 is due to the following components:
| Higher average net sales price |
1.0 pts | |||
| Flat production costs |
- | |||
|
|
|
|||
| Total percentage point change in gross margin |
1.0 pts | |||
|
|
|
| James Hardie 2016 Annual Report on Form 20-F | 108 |
Production costs for fiscal year 2015 were flat compared to fiscal year 2014, due to higher input costs driven by higher market prices of pulp, offset by improved plant performance and the financial impact of purchasing our Rosehill facility.
During the third quarter of fiscal year 2015, we purchased the land and buildings previously leased at our Rosehill, New South Wales facility for A$45.0 million. As a result of the purchase, we released remediation and straight line rent provisions required as a lessee, resulting in a benefit to cost of goods sold of A$3.0 million for the full year.
In Australian dollars, operating income (including New Zealand weathertightness claims) for fiscal year 2015 increased 24% over fiscal year 2014, driven by higher net sales; partially offset by higher SG&A, which as a percentage of net sales increased by 3.2 percentage points compared to fiscal year 2014, largely due to higher compensation and marketing related expenses.
For fiscal year 2015, we recorded a benefit related to New Zealand weathertightness claims, compared to an expense in the prior year. The benefit in the current year is driven by a decrease in the provision, a result of a higher rate of claim resolution, fewer open claims at the end of the period and a continued reduction in the number of new claims received when compared to fiscal year 2014.
In Australian dollars, operating income (excluding New Zealand weathertightness claims) for fiscal year 2015 increased by 15% comparted to fiscal year 2014.
Research and Development Segment
We record R&D expenses depending on whether they are core R&D projects that are designed to benefit all business units, which are recorded in our R&D Segment; or commercialization projects for the benefit of a particular business unit which are recorded in the individual business unit’s segment results. The table below details the expenses of our R&D Segment:
| US$ Millions | FY15 | FY14 | Change % | |||||||||
|
Segment R&D expenses |
$ | (24.2 | ) | $ | (22.2 | ) | (9 | ) | ||||
|
Segment R&D SG&A expenses |
(1.8 | ) | (2.2 | ) | 18 | |||||||
|
Total R&D operating loss |
$ | (26.0 | ) | $ | (24.4 | ) | (7 | ) | ||||
The change in Segment R&D expenses from fiscal year 2014 to fiscal year 2015 is a result of the number of core R&D projects being worked on by the R&D team. The expense fluctuates period to period depending on the nature and number of core R&D projects being worked on during the period.
Other R&D expenses associated with commercialization projects in business units are recorded in the results of the respective business unit segment. In total, these costs were US$7.5 million for fiscal year 2015, compared to US$10.9 million for fiscal year 2014.
| James Hardie 2016 Annual Report on Form 20-F | 109 |
General Corporate
Results for the General Corporate Segment for fiscal years 2015 and 2014 are as follows:
| US$ Millions | FY15 | FY14 | Change % | |||||||||
|
General Corporate SG&A expenses |
$ | (49.9) | $ | (42.7) | (17) | |||||||
| Asbestos: |
||||||||||||
| Asbestos Adjustments |
33.4 | (195.8) | ||||||||||
|
AICF SG&A Expenses1 |
(2.5) | (2.1) | (19) | |||||||||
|
General Corporate operating loss |
$ | (19.0) | $ | (240.6) | 92 | |||||||
| 1 | Relates to non-claims related operating costs incurred by AICF, which we consolidate into our financial results due to our pecuniary and contractual interests in AICF. Readers are referred to Notes 2 and 11 of our consolidated financial statements for further information on the asbestos adjustments. |
For fiscal year 2015, General Corporate SG&A Expenses increased by US$7.2 million, compared to fiscal year 2014. The increase in General Corporate SG&A is driven by a non-recurring stamp duty of US$4.2 million, US$2.0 million in compensation related expenses and US$1.6 million of recognized foreign exchange losses. The increase in compensation related expenses was largely driven by company performance-based incentive bonuses and higher headcount.
Asbestos adjustments reflect a change in the actuarial estimate of the asbestos liability, insurance receivables, AICF claims handling costs and the foreign exchange translation impact of the Australian denominated asbestos related assets and liabilities being recorded on our consolidated balance sheet in US dollar at the reporting date for each respective period. For fiscal year 2015, the Australian dollar spot exchange rate against the US dollar depreciated 17% to US$0.76
For fiscal years 2015 and 2014, the asbestos adjustments recorded by the Company were made up of the following components:
| US$ Millions | FY15 | FY14 | Change % | |||||||||
|
Change in actuarial estimates |
$ | (111.3 | ) | $ | (308.2 | ) | 64 | |||||
| Recovery of insurance receivables |
- | 15.2 | ||||||||||
|
Effect of foreign exchange rate movements |
144.7 | 97.2 | 49 | |||||||||
|
Asbestos adjustments |
$ | 33.4 | $ | (195.8 | ) | |||||||
Readers are referred to Notes 2 and 11 of our consolidated financial statements for further information on asbestos adjustments.
Per the KPMGA actuarial report, the undiscounted and uninflated central estimate net of insurance recoveries remained relatively flat at A$1.566 billion at 31 March 2015 compared to A$1.547 billion at 31 March 2014. The change in the undiscounted and uninflated central estimate of A$19.2 million or 1% is primarily due to an increase in the projected future number of mesothelioma claims, reflecting both a higher numbers of claims and a change in the incidence pattern for mesothelioma, lower nil settlement rates being assumed for lung cancer, partially offset by lower average claims sizes and lower average defense legal cost assumptions for most disease types.
| James Hardie 2016 Annual Report on Form 20-F | 110 |
During the 2015 fiscal year, mesothelioma claims reporting activity was above actuarial expectations for the third consecutive year. One of the critical assumptions is the estimated peak year of mesothelioma disease claims, which is currently assumed to occur in the period 2014/2015 to 2016/2017. Potential variation in this estimate has a much greater impact than the other assumptions used to derive the discounted central estimate. In performing the sensitivity assessment of the estimated period of peak claims reporting for mesothelioma, KPMGA determined that if claims reporting does not begin to reduce until after 2018/19 together with increased claims reporting from 2026/27 onwards, the discounted central estimate could increase by approximately 26% on a discounted basis. At 31 March 2015, KPMGA formed the view that the higher claims reporting activity assumed in the short and medium term is not necessarily indicative of longer term impacts, as at this stage it is too early to form such a long-term conclusion on the basis of two years of experience.
Following is an analysis of claims data for the years ended 31 March:
| FY15 | FY14 | Change % | ||||||||||
|
Claims received |
665 | 608 | (9 | ) | ||||||||
| Actuarial estimate for the period |
610 | 540 | (13 | ) | ||||||||
| Difference in claims received to actuarial estimate |
(55 | ) | (68 | ) | 19 | |||||||
| Average claim settlement1 (A$) |
254,000 | 253,000 | - | |||||||||
| Actuarial estimate for the period2 (A$) |
289,000 | 262,000 | (10 | ) | ||||||||
|
Difference in claims paid to actuarial estimate (A$) |
35,000 | 9,000 | ||||||||||
| 1 | Average claims settlement is derived as the total amount paid divided by the number of non-nil claim settlements |
| 2 | This actuarial estimate is a function of the assumed experience by disease type and the relative mix of settlements assumed by disease type. Any variances in the assumed mix of settlements by disease type will have an impact on the average claim settlement experience. |
For the full year ended 31 March 2015, we noted the following related to asbestos-related claims:
| • | Claims received during fiscal year 2015 were 9% above actuarial estimates and prior year; |
| • | The higher reported mesothelioma claims experience noted during fiscal 2014 continued into fiscal year 2015; |
| • | The A$ average claim settlement is flat for fiscal year 2015, compared to fiscal year 2014; |
| • | The A$ average claim settlement for fiscal year 2015 is 12% lower compared to actuarial estimates; |
| • | Average claim settlement sizes are generally lower across all disease types compared to actuarial expectations for fiscal year 2015; and |
| • | The decrease in average claim settlement for fiscal year 2015 versus actuarial estimates is largely attributable to a lower number of large mesothelioma claims being settled compared to fiscal year 2014. |
Asbestos claims paid of A$154.3 million for fiscal year 2015 were higher than the actuarial expectation of A$148.9 million. All figures provided in this Claims Data section are gross of insurance and other recoveries.
| James Hardie 2016 Annual Report on Form 20-F | 111 |
Net interest expense
Gross interest expense for fiscal year 2015 increased US$5.8 million compared to fiscal year 2014, primarily as a result of higher average balances of funds drawn on our debt facilities and interest incurred on our senior notes which were issued in the fourth quarter of fiscal year 2015. Capitalized interest for fiscal year 2015 totaled US$1.7 million compared to nil for fiscal year 2014, as we were in a net cash position in fiscal year 2014.
For fiscal year 2015, AICF net interest income decreased US$1.5 million compared to fiscal year 2014, primarily a result of the combined impact of higher interest expense incurred as a result of the drawdowns made on the AICF loan facility and a decrease in interest income as a result of lower investment balances held by AICF in fiscal year 2015 compared to fiscal year 2014.
Other (expense) income
For fiscal year 2015, other (expense) income moved from income of US$2.6 million in fiscal year 2014 to an expense of US$4.9 million due to the timing of foreign exchange gains and losses and the unrealized gains and losses resulting from the changes in the fair value of our interest rate swaps at the balance sheet dates.
Income tax (expense) benefit
Total income tax expense for fiscal year 2015 increased by US$76.2 million from fiscal year 2014. The change is primarily due to a reduction in the unfavorable asbestos adjustments and an unfavorable change in tax adjustments compared to fiscal year 2014 relating to a non-recurring receipt of interest from the Australian Taxation Office (“ATO”) in the third quarter of fiscal year 2014; resulting from the finalization of a successful appeal of disputed amended tax assessment.
Readers are referred to Note 15 of our consolidated financial statements for further information related to income tax.
Net income
Net income increased from US$99.5 million in fiscal year 2014 to US$291.3 million in fiscal year 2015. Net income excluding asbestos, New Zealand weathertightness claims, non-recurring stamp duty and other tax adjustments increased 12% from US$197.2 million in fiscal year 2014 to US$221.4 million in fiscal year 2015.
| James Hardie 2016 Annual Report on Form 20-F | 112 |
Liquidity and Capital Allocation
Overview
Our treasury policy regarding liquidity management, foreign exchange risk management, interest rate risk management and cash management is administered by our treasury department which is centralized in Ireland. The policy is reviewed annually and is designed to ensure that we have sufficient liquidity to support our business activities and meet future business requirements in the countries in which we operate. We aim to mitigate certain risks associated with fluctuations in interest rates and foreign currency fluctuations. Our strategies to reduce such risks may result in us entering into non-speculative interest rate swaps and foreign currency forward contracts. For a more detailed discussion on our financial instruments, see Note 12 to our consolidated financial statements in Section 2. For a more detailed discussion on foreign currency exchange rate and interest rate risks, see ‘Quantitative and Qualitative Disclosures About Market Risk’ in Section 3 of this document.
We moved to a net debt position of US$405.7 million at 31 March 2016 compared to a net debt position of US$330.5 million at 31 March 2015 (excluding AICF’s drawdown on its standby loan facility with the NSW Government, in respect of which we are not a party to, guarantor of or security provider).
Sources of Liquidity
During fiscal year 2016, we met our liquidity and capital requirements through a mix of external debt facilities, cash reserves and cash flows from operations. These internal and external sources of liquidity were primarily used during fiscal year 2016 to fund the expansion, renovation and maintenance of existing production facilities, the purchase and construction of new facilities, fund our annual contribution to AICF in accordance with the terms of the AFFA, and fund our working capital requirements, consisting primarily of inventory, accounts receivable and accounts payable. While our working capital requirements fluctuate seasonally during months of the year when overall construction and renovation volumes increase, such fluctuations, generally, have not had a significant impact on our short-term or long-term liquidity.
There are certain restrictions that are either imposed upon us as an Irish plc operating under Irish law, or imposed upon us as a party to the AFFA, which may restrict the ability of subsidiaries to transfer funds to us in the form of cash dividends, loans or advances. For more detailed discussion on these restrictions, see “Section 3 – Risk Factors.” Even with these restrictions, we anticipate that our cash on hand, cash flows from operations, net of estimated payments under the AFFA, and available unutilized credit facilities will be sufficient to fund our planned capital expenditures and working capital requirements for at least the next 12 month period.
Cash Flow — Year Ended 31 March 2016
Operating Activities
Cash provided by operating activities increased US$80.9 million to US$260.4 million. The increase in cash provided by operating activities was primarily driven by a US$44.1 million
| James Hardie 2016 Annual Report on Form 20-F | 113 |
increase in net income adjusted for non-cash items and a lower contribution to AICF as compared to fiscal year 2015, partially offset by an unfavorable change in working capital of US$12.7 million. The unfavorable change in working capital was due to normal variations related to timing in accounts receivable and accounts payable of US$67.4 million as the result of timing of collections and payments between periods. This was partially offset by a US$54.7 million change in cash provided by inventory, driven by inventory management strategies, which decreased inventory balances by US$16.2 million in the current period as opposed to an increase in the inventory balances of US$38.5 million in fiscal year 2015.
Investing Activities
Cash used in investing activities decreased US$211.3 million to US$66.6 million, as we completed our Australian capacity expansion projects and are nearing completion of our US capacity expansion projects, while continuing to invest in maintenance capital expenditure programs. Included in investing activities in fiscal year 2016 was US$10.4 million in proceeds from the previously announced sale of the Blandon facility and the Australian Pipes business.
Financing Activities
Cash used in financing activities increased US$149.8 million to US$154.4 million. The increase in cash used in financing activities was primarily driven by a US$282.4 million decrease in net proceeds from borrowings, partially offset by a US$143.6 million decrease in dividends paid.
Borrowings
Unsecured Revolving Credit Facility
As of 31 March 2016, we had available to us US$500 million of unsecured revolving credit facility (the “Unsecured Revolving Credit Facility”) which can be drawn in US dollars with variable interest rates based on London Interbank Offered Rate (“LIBOR”) plus margin which can be repaid and redrawn up to the maturity in December 2020. The principal drawn on this facility at 31 March 2016 was US$190 million. This facility was put in place on 10 December 2015 and replaced a number of bilateral facilities with differing maturity dates ranging from March 2016 to May 2019.
The weighted average interest rate on our total outstanding Unsecured Revolving Credit Facility at 31 March 2016 was 2.0%. At 31 March 2015, US$75 million was drawn under the bilateral facilities in place at that time and the weighted average interest rate on our total outstanding bilateral facilities was 1.4% at 31 March 2015.
The nature of our operating and capital allocation cycle is such that we typically expect to draw on our facilities in the second and fourth quarters of the fiscal year, with repayments made in the first and third quarters of the fiscal year. When we forecast our capital and operating needs through fiscal year 2019, we see this cycle continuing.
The Unsecured Revolving Credit Facility agreement contains certain covenants that, among other things, restrict James Hardie International Group Limited and its restricted subsidiaries’ ability to incur indebtedness and grant liens other than certain types of permitted indebtedness and
| James Hardie 2016 Annual Report on Form 20-F | 114 |
permitted liens, make certain restricted payments, and undertake certain types of mergers or consolidations actions. In addition, the Unsecured Revolving Credit Facility contains financial covenants that the Company: (i) must not exceed a maximum ratio of net debt to earnings before interest, tax, depreciation and amortization, excluding all asbestos-related liabilities, assets, income, gains, losses and charges other than AICF payments, all AICF selling, general and administrative (“SG&A”) expenses, all Australian Securities and Investment Commission (“ASIC”)-related expenses, all recoveries and asset impairments, and all New Zealand product liability expenses and (ii) must meet or exceed a minimum ratio of earnings before interest, tax, depreciation and amortization to interest charges, excluding all income, expense and other profit and loss statement impacts of asbestos income, gains, losses and charges, all AICF SG&A expenses, all ASIC-related expenses, all recoveries and asset impairments, and all New Zealand product liability expenses. At 31 March 2016, the Company was in compliance with all covenants contained in the Unsecured Revolving Credit Facility agreement.
Senior Unsecured Notes
In February 2015, James Hardie International Finance Limited, a wholly owned subsidiary of JHI plc, completed the sale of US$325.0 million aggregate principal amount of senior unsecured notes due 15 February 2023. Interest is payable semi-annually in arrears on 15 February and 15 August of each year, at a rate of 5.875%.
The senior notes were sold at an offering price of 99.213% of par value, an original issue discount of approximately US$2.6 million. Debt issuance costs of US$8.3 million were recorded in Other Current and Non-Current Assets on our consolidated balance sheet in conjunction with the offering. Both the discount and the debt issuance costs are being amortized as interest expense using the effective interest method over the stated term of 8 years. The discount has an unamortized balance of US$2.2 million and US$2.5 million at 31 March 2016 and 2015, respectively. The debt issuance costs have an unamortized balance of US$7.1 million and US$8.1 million at 31 March 2016 and 2015, respectively.
The senior notes are guaranteed by James Hardie International Group Limited, James Hardie Technology Limited and James Hardie Building Products Inc., each of which are wholly-owned subsidiaries of JHI plc.
The indenture governing the senior notes contains covenants that limit, among other things, the ability of the guarantors and their restricted subsidiaries to incur liens on assets, make certain restricted payments, engage in certain sale and leaseback transactions and merge or consolidate with or into other companies. These covenants are subject to certain exceptions and qualifications as described in the indenture. At 31 March 2016, we are in compliance with all of its requirements under the indenture related to the senior notes.
Global Exchange Market Listing
On 19 March 2015, the senior notes were admitted to listing on the Global Exchange Market (“GEM”) which is operated by the Irish Stock Exchange.
Interest paid on the James Hardie International Finance Limited senior notes quoted on the GEM is not subject to Irish withholding tax.
| James Hardie 2016 Annual Report on Form 20-F | 115 |
Capital Expenditures
Our total capital expenditures for fiscal years 2016, 2015 and 2014 were US$73.2 million, US$276.2 million and US$115.4 million, respectively.
Refer to “Section 1 – Property, Plants and Equipment – Capital Expenditures” for further discussion and a listing of our significant capital expenditures in fiscal years 2016 and 2015. At 31 March 2016, we did not have any material capital expenditures for which we are contractually committed to.
Capital Management and Dividends
The following table summarizes the dividends declared or paid with respect to fiscal years 2016, 2015 and 2014:
| US Cents /Security |
Total US$ (millions) |
Announcement Date |
Record Date | Payment Date | ||||||||||
| FY 2016 second half dividend |
0.29 | 129.1 | 19 May 2016 | 9 June 2016 | 5 August 2016 | |||||||||
| FY 2016 first half dividend |
0.09 | 39.7 | 19 November 2015 | 23 December 2015 | 26 February 2016 | |||||||||
| FY 2015 special dividend |
0.22 | 92.8 | 21 May 2015 | 11 June 2015 | 07 August 2015 | |||||||||
| FY 2015 second half dividend |
0.27 | 114.0 | 21 May 2015 | 11 June 2015 | 07 August 2015 | |||||||||
| FY 2015 first half dividend |
0.08 | 34.2 | 19 November 2014 | 23 December 2014 | 27 February 2015 | |||||||||
| FY 2014 special dividend |
0.20 | 89.0 | 22 May 2014 | 12 June 2014 | 08 August 2014 | |||||||||
| FY 2014 second half dividend |
0.32 | 142.3 | 22 May 2014 | 12 June 2014 | 08 August 2014 | |||||||||
| 125 year anniversary special dividend |
0.28 | 124.6 | 28 February 2014 | 21 March 2014 | 30 May 2014 | |||||||||
| FY 2014 first half dividend |
0.08 | 35.5 | 14 November 2013 | 19 December 2013 | 28 March 2014 | |||||||||
| FY 2013 special dividend |
0.24 | 106.1 | 23 May 2013 | 28 June 2013 | 26 July 2013 | |||||||||
|
FY 2013 second half dividend |
0.13 | 57.5 | 23 May 2013 | 28 June 2013 | 26 July 2013 | |||||||||
During fiscal year 2016, the Company announced a share buyback program (the “fiscal 2016 program”) to acquire up to 5% of its issued capital in the twelve months through May 2016. Under this program, the Company repurchased and cancelled 1,653,247 shares of its common stock during the second quarter of fiscal year 2016. The aggregate cost of the shares repurchased and cancelled was A$30.0 million (US$22.3 million), at an average market price of A$18.14 (US$13.50). Upon the expiration of the fiscal 2016 program, the Company announced a new share buyback program (the “fiscal 2017 program”) to acquire up to US$100.0 million of its issued capital in the twelve months through May 2017.
We will continue to review our capital structure and capital allocation objectives and expect the following prioritization to remain:
| • | invest in R&D and capacity expansion to support organic growth; |
| • | provide ordinary dividend payments within the payout ratio of 50-70% of net income excluding asbestos; |
| • | maintain flexibility for accretive and strategic inorganic growth and/or flexibility to manage through market cycles; and |
| • | consider other shareholder returns when appropriate. |
| James Hardie 2016 Annual Report on Form 20-F | 116 |
Annual AICF contribution
On 1 July 2015, we made a payment of A$81.1 million (US$62.8 million) to AICF, representing 35% of our free cash flow for fiscal year 2015. For the 1 July 2015 payment, free cash flow as defined in the AFFA was equivalent to our fiscal year 2015 operating cash flows of US$179.5 million.
We anticipate that we will make a contribution of approximately US$91.1 million to AICF on 1 July 2016. This amount represents 35% of our free cash flow for fiscal year 2016, as defined by the AFFA.
From the time AICF was established in February 2007 through 19 May 2016, we have contributed approximately A$799.2 million to the fund.
Readers are referred to Notes 2 and 11 of our 31 March 2016 consolidated financial statements for further information on Asbestos.
Outlook and Trend Information
Addressable housing starts in the United States are one of our key leading indicators of performance. We expect to see moderate growth in the US housing market in fiscal year 2017. While housing starts have rebounded from depressed post-crisis levels, they remain well below the 50-year average of approximately 1.5 million starts per year. We believe underlying economic factors and demographics support a return over time towards 1.5 million new housing starts in the United States per year and this is supported by forecasts from institutions such as the Dodge, McGraw Hill and NAHB. A number of factors will contribute to new housing starts demand, including improvement in United States’ GDP, lower unemployment level, improvement in consumer confidence levels, sustainable household debt levels, historically low interest rates, stability in home prices and new household formation.
We are the largest fiber cement producer in North America with nine plants. The scale of our operations and manufacturing capabilities improves our position with distributors who continue to experience increased demand for fiber cement products and seek a partner whom can manufacture and deliver the volume required on a timely basis. The plants are positioned near attractive markets in the United States to help minimize transportation costs for product distribution and raw material sourcing. Input costs including raw materials, labor and freight costs have fluctuated year over year and we are actively engaged in utilizing its platform to mitigate any future increases. We have experienced increases in SG&A costs to align organization capacity with increases in volumes but these costs have remained consistent as a percentage of sales.
Net sales from the Australian business are expected to trend ahead of the average growth of the domestic repair and remodel and single detached housing markets in the eastern states of Australia with total detached starts expected to range from 100,000 to 110,000 in calendar 2016. Similarly, the New Zealand business is expected to deliver improved results supported by a growth in residential markets in the North Island. The Philippines business has experienced growth over the past year, which is expected to continue into fiscal year 2017.
Off-Balance Sheet Arrangements
As of 31 March 2016 and 2015, we did not have any material off-balance sheet arrangements.
| James Hardie 2016 Annual Report on Form 20-F | 117 |
Contractual Obligations
The following table summarizes our contractual obligations at 31 March 2016:
| Payments Due During Fiscal Year Ending 31 March | ||||||||||||||||||||
| US$ Millions | Total | less than 1 year |
1 - 3 years | 3 - 5 years | more than 5 years |
|||||||||||||||
| Asbestos Liability1 |
$ | 1,302.2 | N/A | N/A | N/A | N/A | ||||||||||||||
| Long-Term Debt |
515.0 | - | - | 190.0 | 325.0 | |||||||||||||||
| Estimated interest payments on Long-Term Debt2 | 148.7 | 25.3 | 50.5 | 48.9 | 24.0 | |||||||||||||||
| Long-Term Debt – AICF loan facility3 |
50.7 | 50.7 | - | - | - | |||||||||||||||
| Estimated interest payments on Long-Term Debt – AICF loan facility4 | - | - | - | - | - | |||||||||||||||
| Operating Leases |
60.6 | 18.0 | 26.8 | 11.6 | 4.2 | |||||||||||||||
|
Purchase Obligations5 |
- | - | - | - | - | |||||||||||||||
|
Total |
$ | 2,077.2 | $ | 94.0 | $ | 77.3 | $ | 250.5 | $ | 353.2 | ||||||||||
| 1 | The amount of the asbestos liability reflects the terms of the AFFA, which has been calculated by reference to (but is not exclusively based upon) the most recent actuarial estimate of the projected future asbestos-related cash flows prepared by KPMGA. The asbestos liability also includes an allowance for the future claims-handling costs of AICF. The table above does not include a breakdown of payments due each year as such amounts are not reasonably estimable. See Note 11 to our consolidated financial statements for further information regarding our future obligations under the AFFA. |
| 2 | Interest amounts are estimates based on debt remaining unchanged from the 31 March 2016 balance and interest rates remaining consistent with the rates at 31 March 2016. Interest paid includes interest in relation to our bank debt facilities and bond, as well as the net amount paid relating to interest rate swap agreements. The interest on our bank debt facilities is variable based on a market rate and includes margins agreed to with the various lending banks. Also included in estimated interest payments are commitment fees related to the undrawn amounts of our bank debt facilities. The interest on our interest rate swaps and bond is set at a fixed rate. There are several variables that can affect the amount of interest we may pay in future years, including: (i) new bank debt facilities or bond issuance with rates or margins different from historical rates; (ii) expiration of existing bank debt facilities resulting in a change in the average interest rate; (iii) fluctuations in the market interest rate; (iv) new interest rate swap agreements; and (v) expiration of existing interest rate swap agreements. We have not included estimated interest payments subsequent to fiscal year ending 31 March 2021 as such amounts are not reasonably estimable. |
| 3 | JHI plc and its wholly-owned subsidiaries are not a party to, guarantor of, or security provided in respect of the AICF loan facility. However, because we consolidate AICF due to our pecuniary and contractual interest in AICF, any drawings, repayments or payments of accrued interest by AICF under the AICF loan facility impact our consolidated financial position, results of operations and cash flows. We anticipate the balance outstanding under the AICF loan facility at 31 March 2016 will be repaid on 1 July 2016. Beyond the amount outstanding at 31 March 2016, the Company is unable to reasonably estimate the timing and amount of future drawings, if any, on the AICF loan facility. Accordingly, future payments are deemed to be nil. |
| 4 | We are unable to reasonably estimate the timing and amount of future drawings, if any, on the AICF loan facility. Accordingly, future interest payments are deemed to be nil. |
| 5 | Purchase Obligations are defined as agreements to purchase goods or services that are enforceable and legally-binding on us and that specify all significant terms, including: fixed or minimum quantities to be purchased; fixed, minimum or variable price provisions; and the approximate timing of the transactions. |
See Notes 9, 11 and 14 to our consolidated financial statements for further information regarding our long-term debt, long-term debt – asbestos and operating leases, respectively.
| James Hardie Industries plc – Consolidated Financial Statements | 118 |
INDEX
Page
| 119 |
| 120 |
| Consolidated Statements of Operations and Comprehensive Income for the Years Ended 31 March 2016, 2015 and 2014 | 121 |
| Consolidated Statements of Cash Flows for the Years Ended 31 March 2016, 2015 and 2014 | 122 |
| Consolidated Statements of Changes in Shareholders’ Equity (Deficit) for the Years Ended 31 March 2016, 2015 and 2014 | 123 |
| 124 |
| Report of Independent Registered Public Accounting Firm | 119 |
The Board of Directors and Shareholders of
James Hardie Industries plc
We have audited the accompanying consolidated balance sheets of James Hardie Industries plc as of 31 March 2016 and 2015, and the related consolidated statements of operations and comprehensive income, changes in shareholders’ equity (deficit), and cash flows for each of the three years in the period ended 31 March 2016. These financial statements are the responsibility of the Company’s management. Our responsibility is to express an opinion on these financial statements based on our audits.
We conducted our audits in accordance with the standards of the Public Company Accounting Oversight Board (United States). Those standards require that we plan and perform the audit to obtain reasonable assurance about whether the financial statements are free of material misstatement. An audit includes examining, on a test basis, evidence supporting the amounts and disclosures in the financial statements. An audit also includes assessing the accounting principles used and significant estimates made by management, as well as evaluating the overall financial statement presentation. We believe that our audits provide a reasonable basis for our opinion.
In our opinion, the financial statements referred to above present fairly, in all material respects, the consolidated financial position of James Hardie Industries plc at 31 March 2016 and 2015, and the consolidated results of its operations and its cash flows for each of the three years in the period ended 31 March 2016, in conformity with U.S. generally accepted accounting principles.
We also have audited, in accordance with the standards of the Public Company Accounting Oversight Board (United States), James Hardie Industries plc’s internal control over financial reporting as of 31 March 2016, based on criteria established in Internal Control – Integrated Framework issued by the Committee of Sponsoring Organizations of the Treadway Commission (2013 framework) and our report dated 19 May 2016 expressed an unqualified opinion thereon.
/s/ Ernst & Young LLP
Irvine, California
19 May 2016
| James Hardie Industries plc – Consolidated Balance Sheets | 120 |
| (Millions of US dollars) | ||||||||
| 31 March 2016 |
31 March 2015 |
|||||||
| Assets |
||||||||
| Current assets: |
||||||||
| Cash and cash equivalents |
$ | 107.1 | $ | 67.0 | ||||
| Restricted cash and cash equivalents |
5.0 | 5.0 | ||||||
| Restricted cash and cash equivalents - Asbestos |
17.0 | 22.0 | ||||||
| Accounts and other receivables, net of allowance for doubtful accounts of US$1.1 million and US$0.8 million as of 31 March 2016 and 31 March 2015, respectively |
173.3 | 133.3 | ||||||
| Inventories |
193.0 | 218.0 | ||||||
| Prepaid expenses and other current assets |
19.7 | 24.3 | ||||||
| Insurance receivable - Asbestos |
16.7 | 16.7 | ||||||
| Workers’ compensation - Asbestos |
4.1 | 4.5 | ||||||
| Deferred income taxes |
- | 17.3 | ||||||
| Deferred income taxes - Asbestos |
- | 15.9 | ||||||
|
|
|
|
|
|||||
| Total current assets |
535.9 | 524.0 | ||||||
| Property, plant and equipment, net |
867.0 | 880.1 | ||||||
| Insurance receivable - Asbestos |
149.0 | 161.9 | ||||||
| Workers’ compensation - Asbestos |
46.8 | 45.5 | ||||||
| Deferred income taxes |
25.9 | 12.9 | ||||||
| Deferred income taxes - Asbestos |
384.9 | 389.3 | ||||||
| Other assets |
30.9 | 30.8 | ||||||
|
|
|
|
|
|||||
| Total assets |
$ | 2,040.4 | $ | 2,044.5 | ||||
|
|
|
|
|
|||||
| Liabilities and Shareholders’ Deficit |
||||||||
| Current liabilities: |
||||||||
| Accounts payable and accrued liabilities |
$ | 127.2 | $ | 149.6 | ||||
| Short-term debt - Asbestos |
50.7 | 13.6 | ||||||
| Accrued payroll and employee benefits |
63.0 | 60.6 | ||||||
| Accrued product warranties |
12.2 | 8.9 | ||||||
| Income taxes payable |
4.8 | 1.8 | ||||||
| Asbestos liability |
125.9 | 131.6 | ||||||
| Workers’ compensation - Asbestos |
4.1 | 4.5 | ||||||
| Other liabilities |
11.9 | 7.3 | ||||||
|
|
|
|
|
|||||
| Total current liabilities |
399.8 | 377.9 | ||||||
| Long-term debt |
512.8 | 397.5 | ||||||
| Deferred income taxes |
82.1 | 88.9 | ||||||
| Accrued product warranties |
33.1 | 26.3 | ||||||
| Asbestos liability |
1,176.3 | 1,290.0 | ||||||
| Workers’ compensation - Asbestos |
46.8 | 45.5 | ||||||
| Other liabilities |
14.7 | 21.0 | ||||||
|
|
|
|
|
|||||
| Total liabilities |
2,265.6 | 2,247.1 | ||||||
|
|
|
|
|
|||||
| Commitments and contingencies (Note 14) |
||||||||
| Shareholders’ deficit: |
||||||||
| Common stock, Euro 0.59 par value, 2.0 billion shares authorized; 445,579,351 shares issued at 31 March 2016 and 445,680,673 shares issued at 31 March 2015 |
231.4 | 231.2 | ||||||
| Additional paid-in capital |
164.4 | 153.2 | ||||||
| Accumulated deficit |
(621.8) | (586.6) | ||||||
| Accumulated other comprehensive income (loss) |
0.8 | (0.4) | ||||||
|
|
|
|
|
|||||
| Total shareholders’ deficit |
(225.2) | (202.6) | ||||||
|
|
|
|
|
|||||
| Total liabilities and shareholders’ deficit |
$ | 2,040.4 | $ | 2,044.5 | ||||
|
|
|
|
|
|||||
The accompanying notes are an integral part of these consolidated financial statements.
| James Hardie Industries plc – Consolidated Statements of Operations and Comprehensive Income | 121 |
| Years Ended 31 March | ||||||||||||
| (Millions of US dollars, except per share data) | 2016 | 2015 | 2014 | |||||||||
| Net sales |
$ | 1,728.2 | $ | 1,656.9 | $ | 1,493.8 | ||||||
| Cost of goods sold |
(1,096.0) | (1,078.1) | (987.4) | |||||||||
|
|
|
|
|
|
|
|||||||
| Gross profit |
632.2 | 578.8 | 506.4 | |||||||||
| Selling, general and administrative expenses |
(254.2) | (245.5) | (224.4) | |||||||||
| Research and development expenses |
(29.5) | (31.7) | (33.1) | |||||||||
| Asbestos adjustments |
5.5 | 33.4 | (195.8) | |||||||||
|
|
|
|
|
|
|
|||||||
| Operating income |
354.0 | 335.0 | 53.1 | |||||||||
| Interest expense, net of capitalized interest |
(26.6) | (9.8) | (4.5) | |||||||||
| Interest income |
1.0 | 2.3 | 3.4 | |||||||||
| Other income (expense) |
2.1 | (4.9) | 2.6 | |||||||||
|
|
|
|
|
|
|
|||||||
| Income before income taxes |
330.5 | 322.6 | 54.6 | |||||||||
| Income tax (expense) benefit |
(86.1) | (31.3) | 44.9 | |||||||||
|
|
|
|
|
|
|
|||||||
| Net income |
$ | 244.4 | $ | 291.3 | $ | 99.5 | ||||||
|
|
|
|
|
|
|
|||||||
| Income per share - basic: |
||||||||||||
| Basic |
$ | 0.55 | $ | 0.65 | $ | 0.22 | ||||||
| Diluted |
$ | 0.55 | $ | 0.65 | $ | 0.22 | ||||||
| Weighted average common shares outstanding (Millions): |
||||||||||||
| Basic |
445.3 | 445.0 | 442.6 | |||||||||
| Diluted |
447.2 | 446.4 | 444.6 | |||||||||
| Comprehensive income, net of tax: |
||||||||||||
| Net income |
$ | 244.4 | $ | 291.3 | $ | 99.5 | ||||||
| Pension and post-retirement benefit adjustments |
0.3 | - | - | |||||||||
| Cash flow hedges |
- | (0.6) | 0.9 | |||||||||
| Currency translation adjustments |
0.9 | (32.9) | (15.2) | |||||||||
|
|
|
|
|
|
|
|||||||
| Comprehensive income: |
$ | 245.6 | $ | 257.8 | $ | 85.2 | ||||||
|
|
|
|
|
|
|
|||||||
The accompanying notes are an integral part of these consolidated financial statements.
| James Hardie Industries plc – Consolidated Statements of Cash Flows | 122 |
| Years Ended 31 March | ||||||||||||
| (Millions of US dollars) | 2016 | 2015 | 2014 | |||||||||
| Cash Flows From Operating Activities |
||||||||||||
| Net income |
$ | 244.4 | $ | 291.3 | $ | 99.5 | ||||||
| Adjustments to reconcile net income to net cash provided by operating activities |
||||||||||||
| Depreciation and amortization |
79.8 | 70.9 | 61.4 | |||||||||
| Deferred income taxes |
(0.1) | (37.4) | (70.7) | |||||||||
| Stock-based compensation |
10.3 | 9.2 | 8.5 | |||||||||
| Asbestos adjustments |
(5.5) | (33.4) | 195.8 | |||||||||
| Excess tax benefits from share-based awards |
(0.4) | (1.4) | (5.6) | |||||||||
| Loss on disposal of property, plant and equipment, net |
14.8 | - | - | |||||||||
| Changes in operating assets and liabilities: |
||||||||||||
| Restricted cash and cash equivalents |
100.3 | 107.8 | 99.9 | |||||||||
| Restricted short-term investments - Asbestos |
- | 0.2 | 6.3 | |||||||||
| Payment to AICF |
(62.8) | (113.0) | - | |||||||||
| Accounts and other receivables |
(39.9) | (5.1) | 4.9 | |||||||||
| Inventories |
16.2 | (38.5) | (22.1) | |||||||||
| Prepaid expenses and other assets |
(3.9) | 9.2 | 3.5 | |||||||||
| Insurance receivable - Asbestos |
17.2 | 29.1 | 25.7 | |||||||||
| Accounts payable and accrued liabilities |
(16.9) | 15.7 | 36.2 | |||||||||
| Asbestos liability |
(114.9) | (136.7) | (133.6) | |||||||||
| Other accrued liabilities |
21.8 | 11.6 | 13.1 | |||||||||
|
|
|
|
|
|
|
|||||||
| Net cash provided by operating activities |
$ | 260.4 | $ | 179.5 | $ | 322.8 | ||||||
|
|
|
|
|
|
|
|||||||
| Cash Flows From Investing Activities |
||||||||||||
| Purchases of property, plant and equipment |
$ | (73.2) | $ | (276.2) | $ | (115.4) | ||||||
| Proceeds from sale of property, plant and equipment |
10.4 | - | 0.7 | |||||||||
| Capitalized interest |
(3.2) | (1.7) | - | |||||||||
| Acquisition of assets |
(0.6) | - | (4.1) | |||||||||
|
|
|
|
|
|
|
|||||||
| Net cash used in investing activities |
$ | (66.6) | $ | (277.9) | $ | (118.8) | ||||||
|
|
|
|
|
|
|
|||||||
| Cash Flows From Financing Activities |
||||||||||||
| Proceeds from borrowings |
$ | 528.0 | $ | 717.0 | $ | - | ||||||
| Repayments of borrowings |
(413.0) | (642.0) | - | |||||||||
| Proceeds from senior unsecured notes |
- | 322.4 | - | |||||||||
| Debt issuance costs |
(3.1) | (8.3) | - | |||||||||
| Proceeds from issuance of shares |
2.1 | 4.1 | 29.3 | |||||||||
| Excess tax benefits from share-based awards |
0.4 | 1.4 | 5.6 | |||||||||
| Common stock repurchased and retired |
(22.3) | (9.1) | (22.1) | |||||||||
| Dividends paid |
(246.5) | (390.1) | (199.1) | |||||||||
|
|
|
|
|
|
|
|||||||
| Net cash used in financing activities |
$ | (154.4) | $ | (4.6) | $ | (186.3) | ||||||
|
|
|
|
|
|
|
|||||||
| Effects of exchange rate changes on cash |
$ | 0.7 | $ | 2.5 | $ | (3.9) | ||||||
|
|
|
|
|
|
|
|||||||
| Net increase (decrease) in cash and cash equivalents |
40.1 | (100.5) | 13.8 | |||||||||
| Cash and cash equivalents at beginning of period |
67.0 | 167.5 | 153.7 | |||||||||
|
|
|
|
|
|
|
|||||||
| Cash and cash equivalents at end of period |
$ | 107.1 | $ | 67.0 | $ | 167.5 | ||||||
|
|
|
|
|
|
|
|||||||
| Components of Cash and Cash Equivalents |
||||||||||||
| Cash at bank |
$ | 94.5 | $ | 60.0 | $ | 70.9 | ||||||
| Short-term deposits |
12.6 | 7.0 | 96.6 | |||||||||
|
|
|
|
|
|
|
|||||||
| Cash and cash equivalents at end of period |
$ | 107.1 | $ | 67.0 | $ | 167.5 | ||||||
|
|
|
|
|
|
|
|||||||
| Supplemental Disclosure of Cash Flow Activities |
||||||||||||
| Cash paid during the year for interest |
$ | 20.5 | $ | 4.6 | $ | - | ||||||
| Cash paid during the year for income taxes, net |
$ | 57.8 | $ | 35.6 | $ | 11.6 | ||||||
The accompanying notes are an integral part of these consolidated financial statements.
| James Hardie Industries plc – Consolidated Statements of Changes in Shareholders’ Equity (Deficit) | 123 |
| (Millions of US dollars) | Common Stock |
Additional Paid-in Capital |
Accumulated Deficit |
Treasury Stock |
Accumulated Other Comprehensive Income (loss) |
Total | ||||||||||||||||||
| Balances as of 31 March 2013 |
$ | 227.3 | $ | 101.1 | $ | (357.6) | $ | - | $ | 47.4 | 18.2 | |||||||||||||
|
|
|
|
|
|
|
|
|
|
|
|
|
|||||||||||||
| Net Income |
- | - | 99.5 | - | - | 99.5 | ||||||||||||||||||
| Other comprehensive loss |
- | - | - | - | (14.3) | (14.3) | ||||||||||||||||||
| Stock-based compensation |
1.0 | 7.5 | - | - | - | 8.5 | ||||||||||||||||||
| Tax benefit from stock options exercised |
- | 5.6 | - | - | - | 5.6 | ||||||||||||||||||
| Equity awards exercised |
3.3 | 26.0 | - | - | - | 29.3 | ||||||||||||||||||
| Dividends declared |
- | - | (323.7) | - | - | (323.7) | ||||||||||||||||||
| Treasury stock purchased |
- | - | - | (22.1) | - | (22.1) | ||||||||||||||||||
| Treasury stock retired |
(1.0) | (0.5) | (20.6) | 22.1 | - | - | ||||||||||||||||||
|
|
|
|
|
|
|
|
|
|
|
|
|
|||||||||||||
| Balances as of 31 March 2014 |
$ | 230.6 | $ | 139.7 | $ | (602.4) | $ | - | $ | 33.1 | (199.0) | |||||||||||||
|
|
|
|
|
|
|
|
|
|
|
|
|
|||||||||||||
| Net Income |
- | - | 291.3 | - | - | 291.3 | ||||||||||||||||||
| Other comprehensive loss |
- | - | - | - | (33.5) | (33.5) | ||||||||||||||||||
| Stock-based compensation |
0.6 | 8.6 | - | - | - | 9.2 | ||||||||||||||||||
| Tax benefit from stock options exercised |
- | 1.4 | - | - | - | 1.4 | ||||||||||||||||||
| Equity awards exercised |
0.4 | 3.7 | - | - | - | 4.1 | ||||||||||||||||||
| Dividends declared |
- | - | (267.0) | - | - | (267.0) | ||||||||||||||||||
| Treasury stock purchased |
- | - | - | (9.1) | - | (9.1) | ||||||||||||||||||
| Treasury stock retired |
(0.4) | (0.2) | (8.5) | 9.1 | - | - | ||||||||||||||||||
|
|
|
|
|
|
|
|
|
|
|
|
|
|||||||||||||
| Balances as of 31 March 2015 |
$ | 231.2 | $ | 153.2 | $ | (586.6) | $ | - | $ | (0.4) | $ | (202.6) | ||||||||||||
|
|
|
|
|
|
|
|
|
|
|
|
|
|||||||||||||
| Net income |
- | - | 244.4 | - | - | 244.4 | ||||||||||||||||||
| Other comprehensive income |
- | - | - | - | 1.2 | 1.2 | ||||||||||||||||||
| Stock-based compensation |
0.8 | 9.5 | - | - | - | 10.3 | ||||||||||||||||||
| Tax benefit from stock options exercised |
- | 0.4 | - | - | - | 0.4 | ||||||||||||||||||
| Equity awards exercised |
0.2 | 1.9 | - | - | - | 2.1 | ||||||||||||||||||
| Dividends declared |
- | - | (258.7) | - | - | (258.7) | ||||||||||||||||||
| Treasury stock purchased |
- | - | - | (22.3) | - | (22.3) | ||||||||||||||||||
| Treasury stock retired |
(0.8) | (0.6) | (20.9) | 22.3 | - | - | ||||||||||||||||||
|
|
|
|
|
|
|
|
|
|
|
|
|
|||||||||||||
| Balances as of 31 March 2016 |
$ | 231.4 | $ | 164.4 | $ | (621.8) | $ | - | $ | 0.8 | $ | (225.2) | ||||||||||||
|
|
|
|
|
|
|
|
|
|
|
|
|
|||||||||||||
The accompanying notes are an integral part of these consolidated financial statements.
| James Hardie Industries plc – Notes to Consolidated Financial Statements | 124 |
1. Background and Basis of Presentation
Nature of Operations
James Hardie Industries plc (“JHI plc”) manufactures and sells fiber cement building products for interior and exterior building construction applications, primarily in the United States, Canada, Australia, New Zealand, the Philippines and Europe.
Basis of Presentation
The consolidated financial statements represent the financial position, results of operations and cash flows of JHI plc and its wholly-owned subsidiaries and variable interest entity (“VIE”). Unless the context indicates otherwise, JHI plc and its direct and indirect wholly-owned subsidiaries and VIE (as of the time relevant to the applicable reference) are collectively referred to as “James Hardie”, the “James Hardie Group” or the “Company”. The consolidated financial statements are prepared in accordance with accounting principles generally accepted in the United States of America (“US GAAP”). The US dollar is used as the reporting currency.
Reporting Segments
During the year ended 31 March 2016, the Company changed the name of its USA and Europe segment to the North America and Europe segment to better reflect the segment’s geographic nature; however, the composition of the segment remained the same. Refer to Note 18 for further details on segment reporting.
2. Summary of Significant Accounting Policies
Reclassifications
In the Consolidated Statements of Cash Flows for the years ended 31 March 2015 and 2014, the Company reclassified certain tax accounts between Accounts payable and accrued liabilities and Other accrued liabilities, both of which are included in operating assets and liabilities within the operating activities section of the cash flow, to conform to the current year presentation.
Within the financing activities section of the Consolidated Statement of Cash Flows for the year ended 31 March 2015, the Company reclassified deferred financing fees which were previously included within Proceeds from senior unsecured notes, net of deferred financing fees, and separated these costs in Debt issuance costs, to conform to current year presentation.
Principles of Consolidation
The consolidated financial statements of the Company include the accounts of JHI plc, its wholly-owned subsidiaries and VIE. All intercompany balances and transactions have been eliminated in consolidation.
A VIE is an entity that is evaluated for consolidation using more than a simple analysis of voting control. The analysis is based on (i) what party has the power to direct the most significant
| James Hardie Industries plc – Notes to Consolidated Financial Statements (Continued) | 125 |
activities of the VIE that impact its economic performance, and (ii) what party has rights to receive benefits or is obligated to absorb losses that are significant to the VIE. The analysis of the party that consolidates a VIE is a continual assessment.
In February 2007, the Company’s shareholders approved the Amended and Restated Final Funding Agreement (the “AFFA”), an agreement pursuant to which the Company provides long-term funding to Asbestos Injuries Compensation Fund (“AICF”), a special purpose fund that provides compensation for the Australian-related personal injuries for which certain former subsidiary companies of James Hardie in Australia (being Amaca Pty Ltd (“Amaca”), Amaba Pty Ltd (“Amaba”) and ABN 60 Pty Limited (“ABN 60”) (collectively, the “Former James Hardie Companies”)) are found liable. JHI plc owns 100% of James Hardie 117 Pty Ltd (the “Performing Subsidiary”), which, under the terms of the AFFA, has an obligation to make payments to AICF on an annual basis subject to the provisions of the AFFA. JHI plc guarantees the Performing Subsidiary’s obligation. Additionally, the Company appoints three AICF directors and the New South Wales (“NSW”) Government appoints two AICF directors.
Although the Company has no ownership interest in AICF, for financial reporting purposes the Company consolidates AICF as a VIE as defined under US GAAP due to its pecuniary and contractual interests in AICF as a result of the funding arrangements outlined in the AFFA. The Company’s consolidation of AICF results in certain assets and liabilities being recorded on its consolidated balance sheets and certain income and expense transactions being recorded in the consolidated statements of operations and comprehensive income. These items are Australian dollar-denominated and are subject to remeasurement into US dollars at each reporting date.
For the fiscal years ended 31 March 2016 and 2015, the Company did not provide financial or other support to AICF that it was not previously contractually required to provide.
Use of Estimates
The preparation of financial statements in conformity with US GAAP requires management to make estimates and assumptions. These estimates and assumptions affect the reported amounts of assets and liabilities and the disclosure of contingent assets and liabilities at the date of the financial statements, and the reported amounts of revenues and expenses during the reporting period. Actual results could differ from these estimates.
Foreign Currency Translation
All assets and liabilities are translated or remeasured into US dollars at current exchange rates while revenues and expenses are translated or remeasured at average exchange rates in effect for the period. The effects of foreign currency translation adjustments are included directly in other comprehensive income in shareholders’ equity (deficit). Gains and losses arising from foreign currency transactions are recognized in income currently.
The Company has recorded on its balance sheets certain Australian assets and liabilities, including asbestos-related assets and liabilities under the terms of the AFFA, that are denominated in Australian dollars and subject to translation (Australian entities) or remeasurement (AICF entity) into US dollars at each reporting date.
| James Hardie Industries plc – Notes to Consolidated Financial Statements (Continued) | 126 |
Unless otherwise noted, the exchange rates used to convert Australian dollar denominated amounts into US dollars in the consolidated financial statements are as follows:
| 31 March | ||||||||||||
| (US$1 = A$) | 2016 | 2015 | 2014 | |||||||||
| Assets and liabilities |
1.3060 | 1.3096 | 1.0845 | |||||||||
| Statements of operations |
1.3577 | 1.1419 | 1.0716 | |||||||||
| Cash flows - beginning cash |
1.3096 | 1.0845 | 0.9597 | |||||||||
| Cash flows - ending cash |
1.3060 | 1.3096 | 1.0845 | |||||||||
| Cash flows - current period movements |
1.3577 | 1.1419 | 1.0716 | |||||||||
Restricted Cash and Cash Equivalents
Restricted cash and cash equivalents generally relate to amounts subject to letters of credit with insurance companies, which restrict the cash from use for general corporate purposes.
Inventories
Inventories are valued at the lower of cost or market. Cost is generally determined under the first-in, first-out method, except that the cost of raw materials and supplies is determined using actual or average costs. Cost includes the costs of materials, labor and applied factory overhead. On a regular basis, the Company evaluates its inventory balances for excess quantities and obsolescence by analyzing demand, inventory on hand, sales levels and other information. Based on these evaluations, inventory costs are adjusted to net realizable value, if necessary.
Property, Plant and Equipment
Property, plant and equipment are stated at cost. Property, plant and equipment of businesses acquired are recorded at their estimated fair value at the date of acquisition. Depreciation of property, plant and equipment is computed using the straight-line method over the following estimated useful lives:
| Years | ||||
| Buildings |
40 | |||
| Building improvements |
5 to 10 | |||
| Manufacturing machinery |
5 to 20 | |||
| General equipment |
5 to 10 | |||
| Office furniture and equipment |
3 to 10 | |||
| Computer equipment, software, and software development |
3 to 7 | |||
Depreciation and Amortization
The Company records depreciation and amortization under both cost of goods sold and selling, general and administrative expenses, depending on the asset’s business use. All depreciation and amortization related to plant building, machinery and equipment is recorded in cost of goods sold.
| James Hardie Industries plc – Notes to Consolidated Financial Statements (Continued) | 127 |
Impairment of Long-Lived Assets
Long-lived assets, such as property, plant and equipment, are evaluated each quarter for events or changes in circumstances that indicate that an asset might be impaired because the carrying amount of the asset may not be recoverable. These include, without limitation, a significant adverse change in the extent or manner in which a long-lived asset or asset group is being used, a current period operating or cash flow loss combined with a history of operating or cash flow losses, a projection or forecast that demonstrates continuing losses associated with the use of a long-lived asset or asset group and/or a current expectation that it is more likely than not that a long lived asset or asset group will be sold or otherwise disposed of significantly before the end of its previously estimated useful life.
When such indicators of potential impairment are identified, recoverability is tested by grouping long-lived assets that are used together and represent the lowest level for which cash flows are identifiable and distinct from the cash flows of other long-lived assets, which is typically at the production line or plant facility level, depending on the type of long-lived asset subject to an impairment review.
Recoverability is measured by a comparison of the carrying amount of the asset group to the estimated undiscounted future cash flows expected to be generated by the asset group. If the carrying amount exceeds the estimated undiscounted future cash flows, an impairment charge is recognized at the amount by which the carrying amount exceeds the estimated fair value of the asset group.
The methodology used to estimate the fair value of the asset group is based on a discounted cash flow analysis that considers the asset group’s highest and best use that would maximize the value of the asset group. In addition, the estimated fair value of an asset group also considers, to the extent practicable, a market participant’s expectations and assumptions in estimating the fair value of the asset group. If the estimated fair value of the asset group is less than the carrying value, an impairment loss is recognized at an amount equal to the excess of the carrying value over the estimated fair value of the asset group.
See Note 7 for additional information.
Accrued Product Warranties
An accrual for estimated future warranty costs is recorded based on an analysis by the Company, which includes the historical relationship of warranty costs to installed product at an estimated remediation cost per standard foot. Based on this analysis and other factors, the adequacy of the Company’s warranty provisions is adjusted as necessary.
Debt
The Company’s debt consists of senior unsecured notes and an unsecured revolving credit facility. The senior unsecured notes are recorded at cost net of the original issue discount. The related original issue discount and the borrowing costs are amortized over the term of the borrowing using the effective interest method. The unsecured revolving credit facility is recorded
| James Hardie Industries plc – Notes to Consolidated Financial Statements (Continued) | 128 |
at cost. The related borrowing costs are amortized over the term of the borrowing using the effective interest method. Debt is presented as current if the liability is due to be settled within 12 months after the balance sheet date. See Note 13 for the Company’s fair value considerations.
In addition, the Company consolidates AICF which has a loan facility. Readers are referred to the discussion later in this footnote under Asbestos-related Accounting Policies.
Environmental Remediation and Compliance Expenditures
Environmental remediation and compliance expenditures that relate to current operations are expensed or capitalized, as appropriate. Expenditures that relate to an existing condition caused by past operations, and which do not contribute to current or future revenue generation, are expensed. Liabilities are recorded when environmental assessments and/or remedial efforts are probable and the costs can be reasonably estimated. Estimated liabilities are not discounted to present value. Generally, the timing of these accruals coincides with completion of a feasibility study or the Company’s commitment to a formal plan of action.
Revenue Recognition
The Company recognizes revenue when the risks and obligations of ownership have been transferred to the customer, which generally occurs at the time of delivery to the customer. The Company records estimated reductions in sales for customer rebates and discounts including volume, promotional, cash and other discounts. Rebates and discounts are recorded based on management’s best estimate when products are sold. The estimates are based on historical experience for similar programs and products. Management reviews these rebates and discounts on an ongoing basis and the related accruals are adjusted, if necessary, as additional information becomes available.
A portion of the Company’s revenue is made through distributors under a Vendor Managed Inventory agreement whereby revenue is recognized upon the transfer of title and risk of loss.
Income Taxes
The Company accounts for income taxes under the asset and liability method. Under this method, deferred income taxes are recognized by applying enacted statutory rates applicable to future years to differences between the tax bases and financial reporting amounts of existing assets and liabilities. The effect on deferred taxes of a change in tax rates is recognized in income in the period that includes the enactment date. A valuation allowance is provided when it is more likely than not that all or some portion of deferred tax assets will not be realized. Interest and penalties related to uncertain tax positions are recognized in Income tax expense on the consolidated statements of operations and comprehensive income.
Financial Instruments
The Company calculates the fair value of financial instruments and includes this additional information in the notes to the consolidated financial statements. The estimated fair value amounts have been determined by the Company using available market information and
| James Hardie Industries plc – Notes to Consolidated Financial Statements (Continued) | 129 |
appropriate valuation methodologies. However, considerable judgment is required in interpreting market data to develop the estimates of fair value. Accordingly, the estimates presented herein are not necessarily indicative of the amounts that the Company could realize in a current market exchange. The use of different market assumptions and/or estimation methodologies may have a material effect on the estimated fair value amounts.
Periodically, interest rate swaps, commodity swaps and forward exchange contracts are used to manage market risks and reduce exposure resulting from fluctuations in interest rates, commodity prices and foreign currency exchange rates. Where such contracts are designated as, and are effective as, a hedge, changes in the fair value of derivative instruments designated as cash flow hedges are deferred and recorded in other comprehensive income. These deferred gains or losses are recognized in income when the underlying transactions being hedged impact earnings. The ineffective portion of these hedges is recognized in income currently. Changes in the fair value of derivative instruments that are not designated as hedges for accounting purposes are recognized in income. The Company does not use derivatives for trading purposes. Readers are referred to Note 12 for discussion on financial instruments.
Stock-based Compensation
Stock-based compensation expense represents the estimated fair value of equity-based and liability-classified awards granted to employees, adjusted for estimated forfeitures, and recognized as an expense over the vesting period. Stock-based compensation expense is included in the line item Selling, general and administrative expenses on the consolidated statements of operations and comprehensive income.
Equity awards with vesting based solely on a service condition are typically subject to graded vesting, in that the awards vest 25% after the first year, 25% after the second year and 50% after the third year. For equity awards subject to graded vesting, the Company has elected to use the accelerated recognition method. Accordingly, each vesting tranche is valued separately, and the recognition of stock-based compensation expense is more heavily weighted earlier in the vesting period. Stock-based compensation expense for equity awards that are subject to performance or market vesting conditions are typically recognized ratably over the vesting period. The Company issues new shares to award recipients upon exercise of stock options or when the vesting condition for restricted stock units (“RSU’s”) has been satisfied.
The Company estimates the fair value of stock options on the date of grant using the Black-Scholes option-pricing model.
For RSU’s subject to a service vesting condition, the fair value is equal to the market value of the Company’s common stock on the date of grant, adjusted for the fair value of estimated dividends as the restricted stock holder is not entitled to dividends over the vesting period. For RSU’s subject to a scorecard performance vesting condition, the fair value is adjusted for changes in JHI plc’s common stock price at each balance sheet date until the end of the performance period. For RSU’s subject to a market vesting condition, the fair value is estimated using a Monte Carlo Simulation.
| James Hardie Industries plc – Notes to Consolidated Financial Statements (Continued) | 130 |
Compensation expense recognized for liability-classified awards are based on the fair market value of JHI plc’s common stock on the date of grant and recorded as a liability. The liability is adjusted for subsequent changes in JHI plc’s common stock price at each balance sheet date.
Earnings Per Share
The Company discloses basic and diluted earnings per share (“EPS”). Basic EPS is calculated using net income divided by the weighted average number of common shares outstanding during the period. Diluted EPS is similar to basic EPS except that the weighted average number of common shares outstanding is increased to include the number of additional common shares calculated using the Treasury Method that would have been outstanding if the dilutive potential common shares, such as stock options and RSU’s, had been issued.
Basic and dilutive common shares outstanding used in determining net income per share are as follows:
| Years Ended 31 March | ||||||||||||
| (Millions of shares) | 2016 | 2015 | 2014 | |||||||||
| Basic common shares outstanding |
445.3 | 445.0 | 442.6 | |||||||||
| Dilutive effect of stock awards |
1.9 | 1.4 | 2.0 | |||||||||
|
|
|
|
|
|
|
|||||||
| Diluted common shares outstanding |
447.2 | 446.4 | 444.6 | |||||||||
|
|
|
|
|
|
|
|||||||
| (US dollars) | 2016 | 2015 | 2014 | |||||||||
| Net income per share - basic |
$ | 0.55 | $ | 0.65 | $ | 0.22 | ||||||
| Net income per share - diluted |
$ | 0.55 | $ | 0.65 | $ | 0.22 | ||||||
Potential common shares of 1.3 million, 1.7 million and 1.9 million for the years ended 31 March 2016, 2015 and 2014, respectively, have been excluded from the calculation of diluted common shares outstanding because the effect of their inclusion would be anti-dilutive.
Unless they are anti-dilutive, RSU’s which vest solely based on continued employment are considered to be outstanding as of their issuance date for purposes of computing diluted EPS and are included in the calculation of diluted EPS using the Treasury Method. Once these RSU’s vest, they are included in the basic EPS calculation on a weighted-average basis.
RSU’s which vest based on performance or market conditions are considered contingent shares. At each reporting date prior to the end of the contingency period, the Company determines the number of contingently issuable shares to include in the diluted EPS calculation, as the number of shares that would be issuable under the terms of the RSU arrangement, if the end of the reporting period were the end of the contingency period. Once these RSU’s vest, they are included in the basic EPS calculation on a weighted-average basis.
| James Hardie Industries plc – Notes to Consolidated Financial Statements (Continued) | 131 |
Asbestos-related Accounting Policies
Asbestos Liability
The amount of the asbestos liability has been recognized by reference to (but not exclusively based upon) the most recent actuarial estimate of projected future cash flows as calculated by KPMG Actuarial Pty Ltd (“KPMGA”), who are engaged and appointed by AICF under the terms of the AFFA. Based on their assumptions, KPMGA arrived at a range of possible total future cash flows and calculated a central estimate, which is intended to reflect a probability-weighted expected outcome of those actuarially estimated future cash flows projected by KPMGA to occur through 2077.
The Company recognizes the asbestos liability in the consolidated financial statements by reference to (but not exclusively based upon) the undiscounted and uninflated central estimate. The Company considered discounting when determining the best estimate under US GAAP. The Company has recognized the asbestos liability by reference to (but not exclusively based upon) the central estimate as undiscounted on the basis that it is the Company’s view that the timing and amounts of such cash flows are not fixed or readily determinable. The Company considered inflation when determining the best estimate under US GAAP. It is the Company’s view that there are material uncertainties in estimating an appropriate rate of inflation over the extended period of the AFFA. The Company views the undiscounted and uninflated central estimate as the best estimate under US GAAP.
Adjustments in the asbestos liability due to changes in the actuarial estimate of projected future cash flows and changes in the estimate of future operating costs of AICF are reflected in the consolidated statements of operations and comprehensive income during the period in which they occur. Claims paid by AICF and claims-handling costs incurred by AICF are treated as reductions in the accrued liability balances.
Insurance Receivable
The insurance receivable recorded by the Company has been recognized by reference to (but not exclusively based upon) the most recent actuarial estimate of recoveries expected from insurance policies and insurance companies with exposure to the asbestos claims, as calculated by KPMGA. The assessment of recoveries is based on the expected pattern of claims against such policies less an allowance for credit risk based on credit agency ratings. The insurance receivable generally includes these cash flows as undiscounted and uninflated, however, where the timing of recoveries has been agreed with the insurer, the receivables are recorded on a discounted basis. The Company records insurance receivables that are deemed probable of being realized.
Adjustments in the insurance receivable due to changes in the actuarial estimate, or changes in the Company’s assessment of recoverability are reflected in the consolidated statements of operations and comprehensive income during the period in which they occur. Insurance recoveries are treated as a reduction in the insurance receivable balance.
| James Hardie Industries plc – Notes to Consolidated Financial Statements (Continued) | 132 |
Workers’ Compensation
An estimate of the liability related to workers’ compensation claims is prepared by KPMGA as part of the annual actuarial assessment. This estimate contains two components, amounts that will be met by a workers’ compensation scheme or policy, and amounts that will be met by the Former James Hardie Companies.
The estimated liability is included as part of the asbestos liability and adjustments to the estimate are reflected in the consolidated statements of operations and comprehensive income during the period in which they occur. Amounts that are expected to be paid by the workers’ compensation schemes or policies are recorded as workers’ compensation receivable. Adjustments to the workers’ compensation liability result in an equal adjustment in the workers’ compensation receivable recorded by the Company and have no effect on the consolidated statements of operations and comprehensive income.
Restricted Cash and Cash Equivalents
Cash and cash equivalents of AICF are reflected as restricted assets, as the use of these assets is restricted to the settlement of asbestos claims and payment of the operating costs of AICF. Since cash and cash equivalents are highly liquid, the Company classifies these amounts as a current asset on the consolidated balance sheets.
Restricted Short-Term Investments
Short-term investments consist of highly liquid investments held in the custody of major financial institutions. All short-term investments are classified as available for sale and are recorded at market value using the specific identification method. Unrealized gains and losses on the market value of these investments are included as a separate component of accumulated other comprehensive income (loss). Realized gains and losses on short-term investments are recognized in Other income on the consolidated statements of operations and comprehensive income.
Short-Term Debt
AICF has access to a secured loan facility (the “AICF Loan Facility”) made available by the NSW Government, which can be used by AICF to fund the payment of asbestos claims and certain operating and legal costs of AICF and Former James Hardie Companies (together, the “Obligors”).
Interest accrues daily on amounts outstanding, is calculated based on a 365-day year and is payable monthly. AICF may, at its discretion, elect to accrue interest payable on amounts outstanding under the AICF Loan Facility on the date interest becomes due and payable.
Deferred Income Taxes
The Performing Subsidiary is able to claim a tax deduction for its contributions to AICF over a five-year period commencing in the year the contribution is incurred. Consequently, a deferred tax asset has been recognized equivalent to the anticipated tax benefit over the life of the AFFA.
| James Hardie Industries plc – Notes to Consolidated Financial Statements (Continued) | 133 |
Adjustments are made to the deferred income tax asset as adjustments to the asbestos-related assets and liabilities are recorded.
Asbestos Adjustments
The asbestos adjustments reflected in the consolidated statements of operations and comprehensive income reflect a change in the actuarial estimate of the asbestos liability, insurance receivables and AICF claims handling costs. Additionally, as the asbestos-related assets and liabilities are denominated in Australian dollars, the reported values of these asbestos-related assets and liabilities in the Company’s consolidated balance sheets in US dollars are subject to adjustment depending on the closing exchange rate between the two currencies at the balance sheet dates, the effect of which is also included in Asbestos adjustments in the consolidated statements of operations and comprehensive income.
Asbestos Impact on Statement of Cash Flows
Asbestos Adjustments
The asbestos adjustments, as recorded on the consolidated statements of operations (as described above) is presented as a reconciling item from net income to cash flows from operating activities in the consolidated statements of cash flows.
Operating assets and liabilities related to Asbestos
Movements in the operating assets related to asbestos (asbestos liability, insurance receivable, restricted cash and cash equivalents, restricted short-term investments) recorded on the balance sheets are reflected in the cash flow from operating activities section of the consolidated statements of cash flows as a change in operating assets and liabilities.
Payment to AICF
Payments made to AICF, by the Performing Subsidiary, under the terms of the AFFA are reflected in the consolidated statements of cash flows as a change in operating assets and liabilities.
AICF Loan Facility
Any drawings, repayments, or payments of accrued interest under the AICF Loan Facility, made by AICF, are offset against movement in restricted cash in the cash flow from operating activities section of the consolidated statements of cash flows.
Recent Accounting Pronouncements
In May 2014, the Financial Accounting Standards Board (“FASB”) issued Accounting Standards Update (“ASU”) No. 2014-09, which provides guidance requiring companies to recognize revenue depicting the transfer of goods or services to customers in amounts that reflect the payment to which a company expects to be entitled in exchange for those goods or services. ASU No. 2014-09 also requires additional disclosure about the nature, amount, timing and uncertainty of revenue and
| James Hardie Industries plc – Notes to Consolidated Financial Statements (Continued) | 134 |
cash flows arising from customer contracts, including significant judgments and changes in judgments and assets recognized from costs incurred to obtain or fulfill a contract. ASU No. 2014-09 is effective for annual reporting periods beginning after 15 December 2016, and interim periods within those years, and early adoption is not permitted. In August 2015, the FASB issued ASU No. 2015-14, which deferred the effective date of ASU No. 2014-09 to annual reporting periods beginning after 15 December 2017. Also, early adoption is permitted for annual reporting periods beginning after 15 December 2016. Companies may use either a full retrospective or a modified retrospective approach to adopt ASU No. 2014-09. In April 2016, the FASB issued ASU No. 2016-10, which provides clarification on identifying performance obligations and the licensing implementation guidance, and has the same effective date and transition requirements for ASU No. 2014-09. In May 2016, the FASB issued ASU No. 2016-11, which rescinds certain SEC observer comments in the revenue recognition guidance. The Company is currently evaluating the impact of the new guidance on its financial statements and has not yet selected a transition approach to implement these new standards.
In June 2014, the FASB issued ASU No. 2014-12, which provides explicit guidance on whether to treat a performance target that could be achieved after the requisite service period as a performance condition that affects vesting, or as a nonvesting condition that affects the grant-date fair value of an award. The amendments in ASU No. 2014-12 are effective for fiscal years and interim periods within those years, beginning after 15 December 2015. The Company will adopt ASU 2014-12 prospectively, starting with the fiscal year beginning 1 April 2016. The Company does not expect this new standard to materially impact its consolidated financial statements.
In February 2015, the FASB issued ASU No. 2015-02, which provides explicit guidance about the accounting for consolidation of certain legal entities. The amendments in ASU No. 2015-02 are effective for fiscal years and interim periods within those years, beginning after 15 December 2015, with early adoption permitted. The Company will adopt ASU 2015-02 starting with the fiscal year beginning 1 April 2016. The Company does not expect this new standard to materially impact its consolidated financial statements.
In April 2015, the FASB issued ASU No. 2015-03, which requires that debt issuance costs related to a recognized debt liability be presented in the balance sheet as a direct deduction from the carrying amount of that debt liability, consistent with debt discounts. The amendments in ASU No. 2015-03 are effective for fiscal years and interim periods within those years, beginning after 15 December 2015, with early adoption permitted. The new guidance shall be applied on a retrospective basis, wherein the balance sheet of each individual period presented should be adjusted to reflect the period-specific effects of applying the new guidance. The Company will adopt ASU 2015-03 starting with the fiscal year beginning 1 April 2016. The Company does not expect this new standard to materially impact its consolidated financial statements.
In July 2015, the FASB issued ASU No. 2015-11, which requires inventory to be measured at the lower of cost or realizable value. The amendments in ASU No. 2015-11 are effective for fiscal years and interim periods within those years, beginning after 15 December 2016, with early adoption permitted. The new guidance shall be applied on a prospective basis. The Company will adopt ASU 2015-11 starting with the fiscal year beginning 1 April 2016. The Company does not expect this new standard to materially impact its consolidated financial statements.
| James Hardie Industries plc – Notes to Consolidated Financial Statements (Continued) | 135 |
In November 2015, the FASB issued ASU No. 2015-17, which requires all deferred tax assets and liabilities to be classified as noncurrent on the balance sheet. The amendments in ASU No. 2015-17 are effective for fiscal years and interim periods within those years, beginning after 15 December 2016, with early adoption permitted. The new guidance may be applied either on a prospective or retrospective basis. The Company adopted ASU 2015-17 prospectively, starting with the quarter beginning 1 October 2015. Prior periods were not retrospectively adjusted for this change in accounting principle.
In February 2016, the FASB issued ASU No. 2016-02, which provides guidance on the amount, timing, and uncertainty of cash flows arising from leases. New disclosures will include qualitative and quantitative requirements to provide additional information about the amounts recorded in the financial statements. Lessor accounting will remain largely unchanged from current guidance, however ASU 2016-02 will provide improvements that are intended to align lessor accounting with the lessee model and with updated revenue recognition guidance. The amendments in ASU No. 2016-02 are effective for fiscal years and interim periods within those years, beginning after 15 December 2018, with early adoption permitted. The Company is currently evaluating the impact of the new guidance on its financial statements.
In March 2016, the FASB issued ASU No. 2016-09, which provides guidance to simplify several aspects of the accounting for share-based payment transactions including the income tax consequences, classification of awards as either equity or liabilities, and classification on the statement of cash flows. The amendments in ASU No. 2016-09 are effective for fiscal years and interim periods within those years, beginning after 15 December 2016, with early adoption permitted. An entity that elects early adoption must adopt all of the amendments in the same period. Amendments related to the timing of when excess tax benefits are recognized, minimum statutory withholding requirements, forfeitures, and intrinsic value shall be applied on a modified retrospective basis, wherein the beginning retained earnings in the period in which the guidance is adopted should include a cumulative-effect adjustment to reflect the effects of applying the new guidance. Amendments related to the presentation of employee taxes paid on the statements of cash flows shall be applied retrospectively. Amendments requiring recognition of excess tax benefits and tax deficiencies in the consolidated statements of operations and comprehensive income and the practical expedient for estimating term shall be applied prospectively. An entity may elect to apply the amendments related to the presentation of excess tax benefits on the statements of cash flows using either a prospective transition method or a retrospective transition method. The Company is currently evaluating the impact of the new guidance on its financial statements and has not yet selected the transition approaches to implement this new standard.
3. Cash and Cash Equivalents
Cash and cash equivalents include amounts on deposit in banks and cash invested temporarily in various highly liquid financial instruments with original maturities of three months or less when acquired.
| James Hardie Industries plc – Notes to Consolidated Financial Statements (Continued) | 136 |
Cash and cash equivalents consist of the following components:
| 31 March | ||||||||
| (Millions of US dollars) | 2016 | 2015 | ||||||
| Cash at bank and on hand |
$ | 94.5 | $ | 60.0 | ||||
| Short-term deposits |
12.6 | 7.0 | ||||||
|
|
|
|
|
|||||
| Total cash and cash equivalents |
$ | 107.1 | $ | 67.0 | ||||
|
|
|
|
|
|||||
4. Restricted Cash and Cash Equivalents
Included in restricted cash and cash equivalents is US$5.0 million related to an insurance policy at 31 March 2016 and 2015, which restricts the cash from use for general corporate purposes.
5. Accounts and Other Receivables
Accounts and other receivables consist of the following components:
| 31 March | ||||||||
| (Millions of US dollars) | 2016 | 2015 | ||||||
| Trade receivables |
$ | 169.6 | $ | 131.0 | ||||
| Other receivables and advances |
4.8 | 3.1 | ||||||
| Allowance for doubtful accounts |
(1.1) | (0.8) | ||||||
|
|
|
|
|
|||||
| Total accounts and other receivables |
$ | 173.3 | $ | 133.3 | ||||
|
|
|
|
|
|||||
The collectability of accounts receivable, consisting mainly of trade receivables, is reviewed on an ongoing basis. An allowance for doubtful accounts is provided for known and estimated bad debts by analyzing specific customer accounts and assessing the risk of uncollectability based on insolvency, disputes or other collection issues.
The following are changes in the allowance for doubtful accounts:
| 31 March | ||||||||
| (Millions of US dollars) | 2016 | 2015 | ||||||
| Balance at beginning of period |
$ | 0.8 | $ | 1.0 | ||||
| Adjustment to provision |
0.5 | (0.1) | ||||||
| Write-offs, net of recoveries |
(0.2) | (0.1) | ||||||
|
|
|
|
|
|||||
| Balance at end of period |
$ | 1.1 | $ | 0.8 | ||||
|
|
|
|
|
|||||
| James Hardie Industries plc – Notes to Consolidated Financial Statements (Continued) | 137 |
6. Inventories
Inventories consist of the following components:
| 31 March | ||||||||
| (Millions of US dollars) | 2016 | 2015 | ||||||
| Finished goods |
$ | 144.4 | $ | 150.6 | ||||
| Work-in-process |
5.7 | 6.6 | ||||||
| Raw materials and supplies |
50.7 | 67.5 | ||||||
| Provision for obsolete finished goods and raw materials |
(7.8) | (6.7) | ||||||
|
|
|
|
|
|||||
| Total inventories |
$ | 193.0 | $ | 218.0 | ||||
|
|
|
|
|
|||||
As of 31 March 2016 and 2015, US$32.1 million and US$28.6 million, respectively, of the Company’s finished goods inventory balance was held at third-party locations.
7. Property, Plant and Equipment
Property, plant and equipment consist of the following components:
| Machinery | Construction | |||||||||||||||||||
| (Millions of US dollars) | and | in | ||||||||||||||||||
| Cost or valuation: | Land | Buildings | Equipment | Progress 1 | Total | |||||||||||||||
| At 31 March 2014 |
$ | 28.7 | $ | 212.5 | $ | 961.1 | $ | 115.4 | $ | 1,317.7 | ||||||||||
| Additions 2 |
41.5 | 30.2 | 72.7 | 133.5 | 277.9 | |||||||||||||||
| Disposals 3 |
- | (1.7) | (6.6) | - | (8.3) | |||||||||||||||
| Exchange differences |
- | (1.2) | (52.6) | - | (53.8) | |||||||||||||||
|
|
|
|
|
|
|
|
|
|
|
|||||||||||
| At 31 March 2015 |
$ | 70.2 | $ | 239.8 | $ | 974.6 | $ | 248.9 | $ | 1,533.5 | ||||||||||
| Additions 2 |
- | 27.0 | 155.5 | (103.9) | 78.6 | |||||||||||||||
| Disposals 4 |
- | (0.7) | (65.8) | (1.5) | (68.0) | |||||||||||||||
| Exchange differences |
(0.1) | (0.1) | (1.9) | - | (2.1) | |||||||||||||||
|
|
|
|
|
|
|
|
|
|
|
|||||||||||
| At 31 March 2016 |
$ | 70.1 | $ | 266.0 | $ | 1,062.4 | $ | 143.5 | $ | 1,542.0 | ||||||||||
|
|
|
|
|
|
|
|
|
|
|
|||||||||||
| Accumulated depreciation: |
||||||||||||||||||||
| At 31 March 2014 |
$ | - | $ | (80.9) | $ | (534.0) | $ | - | $ | (614.9) | ||||||||||
| Charge for the year |
- | (9.3) | (60.9) | - | (70.2) | |||||||||||||||
| Disposals 3 |
- | 0.8 | 6.3 | - | 7.1 | |||||||||||||||
| Exchange differences |
- | 1.2 | 23.4 | - | 24.6 | |||||||||||||||
|
|
|
|
|
|
|
|
|
|
|
|||||||||||
| At 31 March 2015 |
$ | - | $ | (88.2) | $ | (565.2) | $ | - | $ | (653.4) | ||||||||||
| Charge for the year |
- | (10.7) | (65.6) | - | (76.3) | |||||||||||||||
| Disposals 4 |
- | 0.5 | 51.1 | - | 51.6 | |||||||||||||||
| Exchange differences |
- | 0.2 | 2.9 | - | 3.1 | |||||||||||||||
|
|
|
|
|
|
|
|
|
|
|
|||||||||||
| At 31 March 2016 |
$ | - | $ | (98.2) | $ | (576.8) | $ | - | $ | (675.0) | ||||||||||
|
|
|
|
|
|
|
|
|
|
|
|||||||||||
| Net book amount: |
||||||||||||||||||||
| At 31 March 2015 |
$ | 70.2 | $ | 151.6 | $ | 409.4 | $ | 248.9 | $ | 880.1 | ||||||||||
| At 31 March 2016 |
$ | 70.1 | $ | 167.8 | $ | 485.6 | $ | 143.5 | $ | 867.0 | ||||||||||
| James Hardie Industries plc – Notes to Consolidated Financial Statements (Continued) | 138 |
| 1 | Construction in progress is presented net of assets transferred into service. |
| 2 | Additions include US$3.2 million and US$1.7 million of capitalized interest for the years ended 31 March 2016 and 2015, respectively. |
| 3 | This includes the accounting impact associated with the purchase of the Company’s previously leased facility at Rosehill. |
| 4 | The US$16.4 million net book value of disposals include US$10.9 million of usage of replacement parts and US$3.5 million of impairment charges on individual assets. The remaining net book value of disposals of US$2.0 million is related to the disposal of assets no longer in use, and do not represent a sale of assets. |
Depreciation expense for the years ended 31 March 2016, 2015 and 2014 was US$76.3 million, US$70.2 million and US$61.3 million, respectively.
Included in property, plant and equipment are restricted assets of AICF with a net book value of US$1.2 million and US$1.3 million as of 31 March 2016 and 2015, respectively.
Impairment of Long-Lived Assets
The Company performs an asset impairment review on a quarterly basis in connection with its assessment of production capabilities and the Company’s ability to meet market demand.
During the years ended 31 March 2016, 2015 and 2014, the Company recorded US$3.5 million, US$3.7 million and nil of impairment charges related to individual assets which is included in Cost of goods sold on the consolidated statements of operations and comprehensive income.
8. Accounts Payable and Accrued Liabilities
Accounts payable and accrued liabilities consist of the following components:
| 31 March | ||||||||
| (Millions of US dollars) | 2016 | 2015 | ||||||
| Trade creditors |
$ | 77.2 | $ | 95.1 | ||||
| Accrued interest |
6.3 | 5.8 | ||||||
| Other creditors and accruals |
43.7 | 48.7 | ||||||
|
|
|
|
|
|||||
| Total accounts payable and accrued liabilities |
$ | 127.2 | $ | 149.6 | ||||
|
|
|
|
|
|||||
9. Long-Term Debt
At 31 March 2016, the Company had two forms of debt; an unsecured revolving credit facility and senior unsecured notes. The effective weighted average interest rate on the Company’s total debt was 4.5% and 5.0% at 31 March 2016 and 31 March 2015, respectively. The weighted average term of all debt, including undrawn facilities, was 5.6 years and 4.4 years at 31 March 2016 and 2015, respectively.
| James Hardie Industries plc – Notes to Consolidated Financial Statements (Continued) | 139 |
Unsecured Revolving Credit Facility
In December 2015, James Hardie International Finance Limited and James Hardie Building Products Inc., each a wholly-owned subsidiary of JHI plc, entered into a new US$500.0 million unsecured revolving credit facility (the “Unsecured Revolving Credit Facility”) with certain commercial banks and HSBC Bank USA, National Association, as administrative agent. The Unsecured Revolving Credit Facility replaced prior bilateral loan facilities of US$590.0 million, which were scheduled to mature in 2016, 2017 and 2019. The Unsecured Revolving Credit Facility expires in December 2020 and the size of the facility may be increased by up to US$250.0 million.
Debt issuance costs in connection with the Unsecured Revolving Credit Facility were recorded in Prepaid expenses and other current assets and Other assets on the Company’s consolidated balance sheets, and will be amortized as interest expense using the effective interest method over the stated term of 5 years. At 31 March 2016, the Company’s total debt issuance costs have an unamortized balance of US$3.9 million.
The amount drawn under the Unsecured Revolving Credit Facility was US$190.0 million at 31 March 2016. The amount drawn under the bilateral credit facilities was US$75.0 million at 31 March 2015.
The effective weighted average interest rate on the Company’s total outstanding Unsecured Revolving Credit Facility was 2.0% at 31 March 2016. The effective weighted average interest rate on the outstanding bilateral facilities was 1.4% at 31 March 2015. The term of the Unsecured Revolving Credit Facility was 4.7 years at 31 March 2016.
Borrowings under the Unsecured Revolving Credit Facility bear interest at per annum rates equal to, at the borrower’s option, either: (i) the London Interbank Offered Rate (“LIBOR”) plus an applicable margin for LIBOR loans; or (ii) a base rate plus an applicable margin for base rate loans. The base rate is calculated as the highest of (x) the rate that the administrative agent announces from time to time as its prime lending rate, as in effect from time to time, (y) 1/2 of 1% in excess of the overnight Federal Funds Rate, and (z) LIBOR for an interest period of one month plus 1.00%. The applicable margin for both base rate and LIBOR loans is calculated based on a pricing grid that in each case is linked to the Company’s consolidated net leverage ratio. For LIBOR Loans, the applicable margin ranges from 1.25% to 2.00%, and for base rate loans it ranges from 0.25% to 1.00%. The Company also pays a commitment fee of between 0.20% and 0.35% on the actual daily amount of the unutilized revolving loans. The applicable commitment fee percentage is based on a pricing grid linked to our consolidated net leverage ratio.
In the event that James Hardie International Finance Limited’s or James Hardie International Group Limited’s, as applicable, long-term senior unsecured non-credit enhanced rating from each of Standard & Poor’s Financial Group, a division of The McGraw Hill Companies (“S&P”), and Moody’s Investors Service, Inc. (“Moody’s”) is at least BBB- from S&P, and at least Baa3 from Moody’s, at James Hardie International Finance Limited’s election, an alternate applicable rate may be applied to new borrowing under the Unsecured Revolving Credit Facility as follows: (a) with respect to the commitment fee, 0.25% per annum; (b) with respect to LIBOR Loans, 1.50% per annum rate; and (c) with respect to base rate loans, 0.50% per annum.
| James Hardie Industries plc – Notes to Consolidated Financial Statements (Continued) | 140 |
The Unsecured Revolving Credit Facility is guaranteed by each of James Hardie International Group Limited and James Hardie Technology Limited, each of which are wholly-owned subsidiaries of JHI plc.
The Unsecured Revolving Credit Facility agreement contains certain covenants that, among other things, restrict James Hardie International Group Limited and its restricted subsidiaries’ ability to incur indebtedness and grant liens other than certain types of permitted indebtedness and permitted liens, make certain restricted payments, and undertake certain types of mergers or consolidations actions. In addition, the Unsecured Revolving Credit Facility contains financial covenants that the Company: (i) must not exceed a maximum ratio of net debt to earnings before interest, tax, depreciation and amortization, excluding all asbestos-related liabilities, assets, income, gains, losses and charges other than AICF payments, all AICF selling, general and administrative (“SG&A”) expenses, all Australian Securities and Investment Commission (“ASIC”)-related expenses, all recoveries and asset impairments, and all New Zealand product liability expenses and (ii) must meet or exceed a minimum ratio of earnings before interest, tax, depreciation and amortization to interest charges, excluding all income, expense and other profit and loss statement impacts of asbestos income, gains, losses and charges, all AICF SG&A expenses, all ASIC-related expenses, all recoveries and asset impairments, and all New Zealand product liability expenses. At 31 March 2016, the Company was in compliance with all covenants contained in the Unsecured Revolving Credit Facility agreement.
Senior Unsecured Notes
In February 2015, James Hardie International Finance Limited, a wholly-owned subsidiary of JHI plc, completed the sale of US$325.0 million aggregate principal amount of senior unsecured notes due 15 February 2023. Interest is payable semi-annually in arrears on 15 February and 15 August of each year, at a rate of 5.875%.
The senior notes were sold at an offering price of 99.213% of par value, an original issue discount of US$2.6 million. Debt issuance costs of US$8.3 million were recorded in Other Current and Other Non-Current Assets on the Company’s consolidated balance sheets in conjunction with the offering. Both the discount and the debt issuance costs are being amortized as interest expense using the effective interest method over the stated term of 8 years. The discount and debt issuance costs have an unamortized balance of US$2.2 million and US$7.1 million at 31 March 2016, respectively.
The senior notes are guaranteed by James Hardie International Group Limited, James Hardie Technology Limited and James Hardie Building Products Inc., each of which are wholly-owned subsidiaries of JHI plc.
The senior notes and guarantees are senior unsecured obligations of the issuer and guarantors and rank equal in right of payment with all of the issuer’s and guarantors’ existing and future senior debt; rank senior in right of payment to all of the issuer’s and guarantors’ existing and future subordinated debt; are structurally subordinated to all liabilities of the Company’s existing and future subsidiaries that do not guarantee the senior notes; and are effectively subordinated in right of payment to all of the issuer’s and the guarantors’ secured indebtedness to the extent of the value of the assets securing such indebtedness.
| James Hardie Industries plc – Notes to Consolidated Financial Statements (Continued) | 141 |
Before 15 February 2018, the issuer may redeem up to 35% of the aggregate principal amount of the senior notes with the net cash proceeds of certain equity offerings at a redemption price of 105.875% of the principal amount plus accrued and unpaid interest, if any, up to but excluding, the redemption date. The issuer may also redeem some or all of the senior notes before 15 February 2018 at a redemption price of 100% of the principal amount, plus accrued and unpaid interest, plus a make whole premium equal to the greater of: (i) 1.0% of the principal amount of such note; and (ii) the excess, if any, of (x) the present value of the sum of the principal amount and premium that would be payable on such note on 15 February 2018 and all remaining interest payments to and including 15 February 2018, discounted on a semi-annual basis from 15 February 2018 to the redemption date at a per annum interest rate equal to the applicable treasury rate plus 50 basis points, over (y) the outstanding principal amount of such note.
On or after 15 February 2018, the issuer may redeem all or a part of the senior notes at any time or from time to time at the redemption prices (expressed as percentages of the principal amount) set forth in the following table plus accrued and unpaid interest, if any, to the applicable redemption date, if redeemed during the 12-month period beginning 15 February, of the years indicated:
|
Year |
Percentage | |
| 2018 |
104.406% | |
| 2019 |
102.938% | |
| 2020 |
101.469% | |
| 2021 and thereafter |
100.000% |
In addition, if a change of control triggering event occurs with respect to the senior notes, as defined in the indenture, the issuer may be required to offer to repurchase the notes at a price equal to 101% of the principal amount of the senior notes, plus accrued and unpaid interest, if any, to, but not including, the date of the purchase.
The indenture governing the senior notes contains covenants that, among other things, limit the ability of the guarantors and their restricted subsidiaries to incur liens on assets, make certain restricted payments, engage in certain sale and leaseback transactions and merge or consolidate with or into other companies. These covenants are subject to certain exceptions and qualifications as described in the indenture. At 31 March 2016, the Company was in compliance with all of its requirements under the indenture related to the senior notes.
Global Exchange Market Listing
On 19 March 2015, the senior notes were admitted to listing on the Global Exchange Market (“GEM”) which is operated by the Irish Stock Exchange. Interest paid on the James Hardie International Finance Limited senior unsecured notes quoted on the GEM is not subject to Irish withholding tax.
| James Hardie Industries plc – Notes to Consolidated Financial Statements (Continued) | 142 |
10. Product Warranties
The Company offers various warranties on its products, including a 30-year limited warranty on certain of its fiber cement siding products in the United States. A typical warranty program requires the Company to replace defective products within a specified time period from the date of sale. It is possible that future warranty costs could differ from those estimates.
The following are the changes in the product warranty provision:
| Years Ended 31 March | ||||||||
| (Millions of US dollars) | 2016 | 2015 | ||||||
| Balance at beginning of period |
$ | 35.2 | $ | 31.4 | ||||
| Accruals for product warranties |
28.0 | 16.0 | ||||||
| Settlements made in cash or in kind |
(17.9) | (12.2) | ||||||
|
|
|
|
|
|||||
| Balance at end of period |
$ | 45.3 | $ | 35.2 | ||||
|
|
|
|
|
|||||
11. Asbestos
The AFFA was approved by shareholders in February 2007 to provide long-term funding to AICF. For a discussion of the AFFA and the accounting policies utilized by the Company related to the AFFA and AICF, see Note 2.
Asbestos Adjustments
The asbestos adjustments included in the consolidated statements of operations and comprehensive income comprise the following:
| Years Ended 31 March | ||||||||||||
| (Millions of US dollars) | 2016 | 2015 | 2014 | |||||||||
| Change in estimates: |
||||||||||||
| Change in actuarial estimate - asbestos liability |
$ | 2.4 | $ | (129.0) | $ | (340.3) | ||||||
| Change in actuarial estimate - insurance receivable |
4.5 | 16.6 | 31.2 | |||||||||
| Change in estimate - AICF claims-handling costs |
1.2 | 1.1 | 0.9 | |||||||||
|
|
|
|
|
|
|
|||||||
| Subtotal - Change in estimates |
8.1 | (111.3) | (308.2) | |||||||||
| Recovery of Insurance Receivables |
- | - | 15.2 | |||||||||
| (Loss) gain on foreign currency exchange |
(2.6) | 144.7 | 97.2 | |||||||||
|
|
|
|
|
|
|
|||||||
| Total Asbestos Adjustments |
$ | 5.5 | $ | 33.4 | $ | (195.8) | ||||||
|
|
|
|
|
|
|
|||||||
| James Hardie Industries plc – Notes to Consolidated Financial Statements (Continued) | 143 |
Actuarial Study; Claims Estimate
AICF commissioned an updated actuarial study of potential asbestos-related liabilities as of 31 March 2016. Based on KPMGA’s assumptions, KPMGA arrived at a range of possible total cash flows and calculated a central estimate, which is intended to reflect a probability-weighted expected outcome of those actuarially estimated future cash flows.
The following table sets forth the central estimates, net of insurance recoveries, calculated by KPMGA as of 31 March 2016:
| Year Ended 31 March 2016 | ||||||||
| (Billions of US and Australian dollars, respectively) | US$ | A$ | ||||||
| Central Estimate - Discounted and Inflated |
1.458 | 1.904 | ||||||
| Central Estimate - Undiscounted but Inflated |
1.858 | 2.427 | ||||||
| Central Estimate - Undiscounted and Uninflated |
1.098 | 1.434 | ||||||
The asbestos liability has been revised to reflect the most recent actuarial estimate prepared by KPMGA as of 31 March 2016.
In estimating the potential financial exposure, KPMGA has made a number of assumptions, including, but not limited to, assumptions related to the total number of claims that are reasonably estimated to be asserted through 2077, the typical cost of settlement (which is sensitive to, among other factors, the industry in which a plaintiff claims exposure, the alleged disease type and the jurisdiction in which the action is brought), the legal costs incurred in the litigation of such claims, the rate of receipt of claims, the settlement strategy in dealing with outstanding claims and the timing of settlements.
Due to inherent uncertainties in the legal and medical environment, the number and timing of future claim notifications and settlements, the recoverability of claims against insurance contracts, and estimates of future trends in average claim awards, as well as the extent to which the above named entities will contribute to the overall settlements, the actual liability could differ materially from that which is currently recorded.
The potential range of costs as estimated by KPMGA is affected by a number of variables such as nil settlement rates, peak year of claims, past history of claims numbers, average settlement rates, past history of Australian asbestos-related medical injuries, current number of claims, average defense and plaintiff legal costs, base wage inflation and superimposed inflation. The potential range of losses disclosed includes both asserted and unasserted claims.
A sensitivity analysis performed by KPMGA to determine how the actuarial estimates would change if certain assumptions (i.e., the rate of inflation and superimposed inflation, the average costs of claims and legal fees, and the projected numbers of claims) were different from the assumptions used to determine the central estimates. The sensitivity analysis performed in the actuarial report is specifically in regards to the discounted but inflated central estimate and the undiscounted but inflated central estimate. This analysis shows that the discounted (but inflated) central estimates could be in a range of A$1.4 billion (US$1.0 billion) to A$3.4 billion (US$2.6 billion). The undiscounted (but inflated) estimates could be in a range of A$1.7 billion (US$1.3
| James Hardie Industries plc – Notes to Consolidated Financial Statements (Continued) | 144 |
billion) to A$4.7 billion (US$3.6 billion) as of 31 March 2016. The actual cost of the liabilities could be outside of that range depending on the results of actual experience relative to the assumptions made.
During fiscal year 2016, mesothelioma claims reporting activity was marginally below actuarial expectations for the first year in the past four years. One of the more significant assumptions is the estimated peak period of reported mesothelioma disease claims, which is currently assumed to occur in the peak period 2014/2015 to 2016/2017. Potential variation in this estimate has an impact much greater than the other assumptions used to derive the discounted central estimate. In performing the sensitivity assessment of the estimated period of peak claims reporting for mesothelioma, if the peak claims reporting period was shifted two years from the currently assumed 2016/2017 (i.e. assuming that claim reporting begins to reduce after 2018/2019), together with increased claims reporting from 2026/2027 onwards, relative to current actuarial projections, the discounted central estimate could increase by approximately 30% on a discounted basis.
At 31 March 2016, KPMGA has formed the view that, due to the stable claims reporting in fiscal year 2016, no change to the assumption of mesothelioma claims is required. However, changes to the valuation assumptions may be necessary in future periods should mesothelioma claims reporting escalate or decline.
Claims Data
The following table shows the activity related to the numbers of open claims, new claims and closed claims during each of the past five years and the average settlement per settled claim and case closed:
| For the Years Ended 31 March | ||||||||||||||||||||
| 2016 | 2015 | 2014 | 2013 | 2012 | ||||||||||||||||
| Number of open claims at beginning of period |
494 | 466 | 462 | 592 | 564 | |||||||||||||||
| Number of new claims |
577 | 665 | 608 | 542 | 456 | |||||||||||||||
| Number of closed claims |
645 | 637 | 604 | 672 | 428 | |||||||||||||||
| Number of open claims at end of period |
426 | 494 | 466 | 462 | 592 | |||||||||||||||
| Average settlement amount per settled claim |
A$ 248,138 | A$ 254,209 | A$ 253,185 | A$ 231,313 | A$ 218,610 | |||||||||||||||
| Average settlement amount per case closed |
A$ 218,900 | A$ 217,495 | A$ 212,944 | A$ 200,561 | A$ 198,179 | |||||||||||||||
| Average settlement amount per settled claim |
US$ 182,763 | US$ 222,619 | US$ 236,268 | US$ 238,615 | US$ 228,361 | |||||||||||||||
| Average settlement amount per case closed |
US$ 161,229 | US$ 190,468 | US$ 198,716 | US$ 206,892 | US$ 207,019 | |||||||||||||||
Under the terms of the AFFA, the Company has rights of access to actuarial information produced for AICF by the actuary appointed by AICF, which is currently KPMGA. The Company’s disclosures with respect to claims statistics are subject to it obtaining such information, however, the AFFA does not provide the Company an express right to audit or otherwise require independent verification of such information or the methodologies to be adopted by the approved actuary. As such, the Company relies on the accuracy and completeness of the information and analysis of the approved actuary when making disclosures with respect to claims statistics.
| James Hardie Industries plc – Notes to Consolidated Financial Statements (Continued) | 145 |
Asbestos-Related Assets and Liabilities
The Company has included on its consolidated balance sheets the asbestos-related assets and liabilities of AICF under the terms of the AFFA. These amounts are detailed in the table below, and the net total of these asbestos-related assets and liabilities is referred to by the Company as the “Net AFFA Liability.”
| 31 March | ||||||||
| (Millions of US dollars) | 2016 | 2015 | ||||||
| Asbestos liability – current |
$ | (125.9) | $ | (131.6) | ||||
| Asbestos liability – non-current |
(1,176.3) | (1,290.0) | ||||||
|
|
|
|
|
|||||
| Asbestos liability – Total |
(1,302.2) | (1,421.6) | ||||||
| Insurance receivable – current |
16.7 | 16.7 | ||||||
| Insurance receivable – non-current |
149.0 | 161.9 | ||||||
|
|
|
|
|
|||||
| Insurance receivable – Total |
165.7 | 178.6 | ||||||
| Workers’ compensation asset – current |
4.1 | 4.5 | ||||||
| Workers’ compensation asset – non-current |
46.8 | 45.5 | ||||||
| Workers’ compensation liability – current |
(4.1) | (4.5) | ||||||
| Workers’ compensation liability – non-current |
(46.8) | (45.5) | ||||||
|
|
|
|
|
|||||
| Workers’ compensation – Total |
- | - | ||||||
| Loan facility |
(50.7) | (13.6) | ||||||
| Other net liabilities |
(1.0) | (1.5) | ||||||
| Restricted cash and cash equivalents and restricted short-term investment assets of AICF |
17.0 | 22.0 | ||||||
|
|
|
|
|
|||||
| Net AFFA liability |
$ | (1,171.2) | $ | (1,236.1) | ||||
|
|
|
|
|
|||||
| Deferred income taxes – current |
- | 15.9 | ||||||
| Deferred income taxes – non-current |
384.9 | 389.3 | ||||||
|
|
|
|
|
|||||
| Deferred income taxes – Total |
384.9 | 405.2 | ||||||
| Income tax payable |
19.6 | 19.2 | ||||||
|
|
|
|
|
|||||
| Net Unfunded AFFA liability, net of tax |
$ | (766.7) | $ | (811.7) | ||||
|
|
|
|
|
|||||
| James Hardie Industries plc – Notes to Consolidated Financial Statements (Continued) | 146 |
The following is a detailed rollforward of the Net Unfunded AFFA liability, net of tax, for the year ended 31 March 2016:
| (Millions of US dollars) |
Asbestos Liability |
Insurance Receivables |
Deferred Tax Assets |
Other Loan Facilities |
Restricted Cash and Investments |
Other Assets and Liabilities1 |
Net Unfunded AFFA Liability, net of tax |
|||||||||||||||||||||
| Opening Balance - 31 March 2015 |
$ | (1,421.6 | ) | $ | 178.6 | $ | 405.2 | $ | (13.6 | ) | $ | 22.0 | $ | 17.7 | $ | (811.7 | ) | |||||||||||
| Asbestos claims paid2 |
113.9 | (113.9 | ) | - | ||||||||||||||||||||||||
| Payment received in accordance with AFFA |
62.8 | 62.8 | ||||||||||||||||||||||||||
| AICF claims-handling costs incurred (paid) |
1.2 | (1.2 | ) | - | ||||||||||||||||||||||||
| AICF operating costs paid - non claims-handling |
(1.7 | ) | (1.7 | ) | ||||||||||||||||||||||||
| Change in actuarial estimate |
2.4 | 4.5 | 6.9 | |||||||||||||||||||||||||
| Change in claims handling cost estimate |
1.2 | 1.2 | ||||||||||||||||||||||||||
| Insurance recoveries |
(17.2 | ) | 17.2 | - | ||||||||||||||||||||||||
| Movement in Income Tax Payable |
(18.9 | ) | (0.6 | ) | (19.5 | ) | ||||||||||||||||||||||
| Funds received from NSW under loan agreement |
(60.5 | ) | 60.5 | - | ||||||||||||||||||||||||
| Funds repaid to NSW under loan agreement |
27.3 | (27.3 | ) | - | ||||||||||||||||||||||||
| Other movements |
(1.7 | ) | - | (0.7 | ) | 0.3 | (2.1 | ) | ||||||||||||||||||||
| Effect of foreign exchange |
0.7 | (0.2 | ) | 0.3 | (3.9 | ) | (0.7 | ) | 1.2 | (2.6 | ) | |||||||||||||||||
|
|
|
|||||||||||||||||||||||||||
| Closing Balance - 31 March 2016 |
$ | (1,302.2 | ) | $ | 165.7 | $ | 384.9 | $ | (50.7 | ) | $ | 17.0 | $ | 18.6 | $ | (766.7 | ) | |||||||||||
|
|
|
|||||||||||||||||||||||||||
| 1 | Other assets and liabilities include an offset to income tax payable of US$19.6 million and US$19.2 million at 31 March 2016 and 2015, respectively. The remaining balance includes the other assets and liabilities of AICF, with a net liability of US$1.0 million and US$1.5 million at 31 March 2016 and 2015, respectively. |
| 2 | Claims paid of US$113.9 million reflects A$154.7 million converted at the average exchange rate for the period based on the assumption that these transactions occurred evenly throughout the period. |
AICF Funding
On 1 July 2015, the Company made a payment of A$81.1 million (US$62.8 million) to AICF, representing 35% of its free cash flow for fiscal year 2015. For the 1 July 2015 payment, free cash flow, as defined in the AFFA, was equivalent to the Company’s fiscal year 2015 operating cash flows of US$179.5 million.
On 1 July 2014, the Company made a payment of A$119.9 million (US$113.0 million) to AICF, representing 35% of its free cash flow for fiscal year 2014. For the 1 July 2014 payment, free cash flow, as defined in the AFFA, was equivalent to the Company’s fiscal year 2014 operating cash flows of US$322.8 million.
On 2 April 2012, in accordance with arrangements agreed with the NSW Government and AICF, the Company contributed US$138.7 million (A$132.3 million) to AICF, with a further contribution of US$45.4 million (A$45.2 million) on 2 July 2012, in accordance with the terms of the AFFA. Total contributions for the year ended 31 March 2013 were US$184.1 million (A$177.5 million). In accordance with the terms of the AFFA, and the arrangements agreed with the NSW Government and AICF for an early contribution based on the Company’s free cash flow for the fiscal year ended 31 March 2012, the Company did not make a contribution to AICF in fiscal year 2014 in respect of the free cash flow for the fiscal year ended 31 March 2013.
| James Hardie Industries plc – Notes to Consolidated Financial Statements (Continued) | 147 |
AICF – NSW Government Secured Loan Facility
AICF may borrow, subject to certain conditions, up to an aggregate amount of A$320.0 million (US$245.0 million, based on the exchange rate at 31 March 2016). The AICF Loan Facility is available to be drawn for the payment of claims through 1 November 2030, at which point, all outstanding borrowings must be repaid. Borrowings made under the AICF Loan Facility are classified as current, as AICF intends to repay the debt within one year.
At 31 March 2016 and 2015, AICF had an outstanding balance under the AICF Loan Facility of US$50.7 million and US$13.6 million, respectively.
To the extent the NSW Government sources funding for the AICF Loan Facility from the Commonwealth of Australia (the “Commonweath”), the interest rate on the AICF Loan Facility is calculated by reference to the cost of NSW’s borrowings from the Commonwealth for that purpose, being calculated with reference to the Commonwealth Treasury fixed coupon bond rate for a period determined as appropriate by the Commonwealth.
To the extent that NSW’s source of funding is not from the Commonwealth, the interest rate on drawings under the AICF Loan Facility is calculated as (i) during the period to (but excluding) 1 May 2020, a yield percent per annum calculated at the time of the first drawdown of the AICF Loan Facility by reference to the NSW Treasury Corporation’s 6% 1/05/2020 Benchmark Bonds, (ii) during the period after 1 May 2020, a yield percent per annum calculated by reference to NSW Treasury Corporation bonds on issue at that time and maturing in 2030, or (iii) in any case, if the relevant bonds are not on issue, a yield percent per annum in respect of such other source of funding for the AICF Loan Facility determined by the NSW Government in good faith to be used to replace those bonds, including any guarantee fee payable to the Commonwealth in respect of the bonds (where the bonds are guaranteed by the Commonwealth) or other source of funding.
Under the AICF Loan Facility, the Former James Hardie Companies each guarantee the payment of amounts owed by AICF and AICF’s performance of its obligations under the AICF Loan Facility. Each Obligor has granted the NSW Government a security interest in certain property including cash accounts, proceeds from insurance claims, payments remitted by the Company to AICF and contractual rights under certain documents including the AFFA. Each Obligor may not deal with the secured property until all amounts outstanding under the AICF Loan Facility are paid, except as permitted under the terms of the security interest.
Under the terms of the AICF Loan Facility, each Obligor must, upon receipt of proceeds from insurance claims and payments remitted by the Company under the AFFA, apply all of such proceeds in repayment of amounts owing under the AICF Loan Facility. NSW may, at its sole discretion, waive or postpone (in such manner and for such period as it determines) the requirement for the Obligors to apply proceeds of insurance claims and payments remitted by the Company to repay amounts owed under the AICF Loan Facility to ensure AICF has sufficient liquidity to meet its future cash flow needs.
The Obligors are subject to certain operating covenants under the AICF Loan Facility and the terms of the security interest, including, without limitation, (i) positive covenants relating to providing corporate reporting documents, providing particular notifications and complying with the
| James Hardie Industries plc – Notes to Consolidated Financial Statements (Continued) | 148 |
terms of the AFFA, and (ii) negative covenants restricting them from voiding, cancelling, settling, or adversely affecting existing insurance policies, disposing of assets and granting security to secure any other financial indebtedness, other than in accordance with the terms and conditions of the AICF Loan Facility.
Upon an event of default, NSW may cancel the commitment and declare all amounts outstanding as immediately due and payable. The events of default include, without limitation, failure to pay or repay amounts due in accordance with the AICF Loan Facility, breach of covenants, misrepresentation, cross default by an Obligor and an adverse judgment (other than a personal asbestos or Marlew claim) against an Obligor.
12. Derivative Instruments
The Company uses derivatives for risk management purposes and does not engage in speculative activity. A key risk management objective for the Company is to mitigate interest rate risk associated with the Company’s external credit facilities and foreign currency risk primarily with respect to transactions denominated in foreign currencies. The determination of whether the Company enters into a derivative transaction to achieve these risk management objectives depends on a number of factors, including market related factors that impact the extent to which derivative instruments will achieve such risk management objectives of the Company.
The Company may from time to time enter into interest rate swap contracts to protect against upward movements in US Dollar LIBOR and the associated interest the Company pays on its external credit facilities. Interest rate swaps are recorded in the financial statements at fair value. Changes in fair value are recorded on the consolidated statements of operations and comprehensive income in Other income (expense).
The Company uses foreign currency forward contracts and enters into hedging relationships from time to time in order to mitigate exposure to foreign currency fluctuations. Changes in the fair value of forward contracts that are not designated as hedges are recorded in earnings within Other income (expense) at each measurement date.
Interest Rate Swaps
For interest rate swap contracts, the Company has agreed to pay fixed interest rates while receiving a floating interest rate. At 31 March 2016 and 2015, the Company had interest rate swap contracts with a total notional principal of US$100.0 million and US$125.0 million, respectively.
At 31 March 2016, the weighted average fixed interest rate of these contracts is 2.0% and the weighted average remaining life is 3.4 years. These contracts have a fair value of US$3.7 million and US$3.1 million at 31 March 2016 and 2015, respectively, which is included in Accounts payable. For the years ended 31 March 2016, 2015 and 2014, the Company included in Other income (expense) an unrealized loss of US$0.6 million, an unrealized loss of US$2.6 million and an unrealized gain of US$0.8 million, respectively, on interest rate swap contracts. Included in Interest expense is a realized loss on interest rate swap contracts of US$1.9 million, US$1.3 million and US$0.6 million for the years ended 31 March 2016, 2015 and 2014, respectively.
| James Hardie Industries plc – Notes to Consolidated Financial Statements (Continued) | 149 |
Foreign Currency Forward Contracts
The Company uses foreign currency forward contracts and enters into hedging relationships from time to time in order to mitigate exposure to foreign currency fluctuations. When achievable, these instruments are designated as hedges and treated as a cash flow hedging arrangement for accounting purposes. In September 2013, the Company entered into foreign currency forward contracts designated as hedges in order to mitigate exposure associated with the anticipated purchases of production assets denominated in a foreign currency in a future period. During the year ended 31 March 2015, the Company elected to de-designate all of its foreign currency forward contracts that had been previously designated as cash flow hedges, and elected to discontinue hedge accounting. The foreign currency forward contracts which were previously designated as hedges and de-designated during fiscal year 2015 had a gain classified in other comprehensive income of US$0.3 million at 31 March 2016 and 2015. The gains are reclassified into earnings in correspondence to the depreciation schedule of the underlying equipment purchases which were hedged.
Changes in the fair value of forward contracts that are not designated as hedges are recorded in earnings within Other income (expense) at each measurement date. As discussed above, these derivatives are typically entered into as economic hedges of changes in currency exchange rates. Gains or losses related to the derivative are recorded in income, based on the Company’s accounting policy. In general, the earnings effects of the item that represent the economic risk exposure are recorded in the same caption as the derivative. For the years ended 31 March 2016 and 2015, the forward contracts not designated as a cash flow hedging arrangement had an unrealized gain of US$0.9 million and an unrealized loss of US$2.3 million, respectively.
The notional amount of interest rate swap contracts and foreign currency forward contracts represents the basis upon which payments are calculated and are reported on a net basis when a legal and enforceable right of set-off exists. The following table sets forth the total outstanding notional amount and the fair value of the Company’s derivative instruments held at 31 March 2016 and 2015.
| Fair Value as of |
||||||||||||||||||||||||
| (Millions of US dollars) | Notional Amount | 31 March 2016 | 31 March 2015 | |||||||||||||||||||||
| 31 March 2016 | 31 March 2015 | Assets | Liabilities | Assets | Liabilities | |||||||||||||||||||
| Derivatives not accounted for as hedges |
||||||||||||||||||||||||
| Interest rate swap contracts |
100.0 | 125.0 | - | 3.7 | - | 3.1 | ||||||||||||||||||
| Foreign currency forward contracts |
0.4 | 3.6 | - | - | - | 0.2 | ||||||||||||||||||
|
|
|
|
|
|
|
|
|
|
|
|
|
|||||||||||||
| Total |
$ | 100.4 | $ | 128.6 | $ | - | $ | 3.7 | $ | - | $ | 3.3 | ||||||||||||
|
|
|
|
|
|
|
|
|
|
|
|
|
|||||||||||||
13. Fair Value Measurements
Assets and liabilities of the Company that are carried at fair value are classified in one of the following three categories:
| Level 1 | Quoted market prices in active markets for identical assets and liabilities that the Company has the ability to access at the measurement date; |
| James Hardie Industries plc – Notes to Consolidated Financial Statements (Continued) | 150 |
| Level 2 | Observable market-based inputs or unobservable inputs that are corroborated by market data for the asset or liability at the measurement date; |
| Level 3 | Unobservable inputs that are not corroborated by market data used when there is minimal market activity for the asset or liability at the measurement date. |
Fair value measurements of assets and liabilities are assigned a level within the fair value hierarchy based on the lowest level of any input that is significant to the fair value measurement in its entirety.
At 31 March 2016, the Company’s financial instruments consist primarily of cash and cash equivalents, restricted cash and cash equivalents, trade receivables, trade payables, unsecured revolving credit facility, senior unsecured notes, interest rate swaps and foreign currency forward contracts.
Cash and Cash Equivalents, Restricted cash and cash equivalents, Trade receivables, Trade payables, Dividend payables and Unsecured Revolving Credit Facility - The carrying amounts for these items approximates their respective fair values due to the short term nature of these instruments.
Senior unsecured notes - The Company’s senior unsecured notes have an estimated fair value of US$329.1 million at 31 March 2016 based on the trading price observed in the market at or near the balance sheet date and are categorized as Level 1 within the fair value hierarchy.
Interest rate swaps - The fair value of interest rate swap contracts is calculated based on the fixed rate, notional principal, settlement date and present value of the future cash inflows and outflows based on the terms of the agreement and the future floating interest rates as determined by a future interest rate yield curve. The model used to value the interest rate swap contracts is based upon well recognized financial principles, and interest rate yield curves can be validated through readily observable data by external sources. Although readily observable data is used in the valuations, different valuation methodologies could have an effect on the estimated fair value. Accordingly, the interest rate swap contracts are categorized as Level 2.
Foreign currency forward contracts - The Company’s foreign currency forward contracts are valued using models that maximize the use of market observable inputs including interest rate curves and both forward and spot prices for currencies and are categorized as Level 2 within the fair value hierarchy. At 31 March 2016, the fair value of the forward currency forward contracts was nil.
The following table sets forth by level within the fair value hierarchy, the Company’s financial assets and liabilities that were accounted for at fair value on a recurring basis at 31 March 2016 according to the valuation techniques the Company used to determine their fair values.
| Fair Value at 31 March 2016 |
Fair Value Measurements Using Inputs Considered as |
|||||||||||||||
| (Millions of US dollars) | Level 1 | Level 2 | Level 3 | |||||||||||||
| Interest rate swap contracts included in Accounts Payable |
$ | 3.7 | $ | - | $ | 3.7 | $ | - | ||||||||
|
|
|
|
|
|
|
|
|
|||||||||
| Total Liabilities |
$ | 3.7 | $ | - | $ | 3.7 | $ | - | ||||||||
|
|
|
|
|
|
|
|
|
|||||||||
| James Hardie Industries plc – Notes to Consolidated Financial Statements (Continued) | 151 |
14. Commitments and Contingencies
The Company is involved from time to time in various legal proceedings and administrative actions related to the normal conduct of its business, including general liability claims, putative class action lawsuits and litigation concerning its products.
Although it is impossible to predict the outcome of any pending legal proceeding, management believes that such proceedings and actions should not, individually or in the aggregate, have a material adverse effect on the Company’s consolidated financial position, results of operations or cash flows, except as they relate to asbestos and New Zealand product liability claims as described in these consolidated financial statements.
New Zealand Weathertightness Claims
Since fiscal year 2002, the Company’s New Zealand subsidiaries have been and continue to be joined in a number of weathertightness claims in New Zealand that relate to residential buildings (single dwellings and apartment complexes) and a small number of non-residential buildings, primarily constructed from 1998 to 2004. The claims often involve multiple parties and allege that losses were incurred due to excessive moisture penetration of the buildings’ structures. The claims typically include allegations of poor building design, inadequate certification of plans, inadequate construction review and compliance certification and deficient work by sub-contractors.
The Company recognizes a liability for both asserted and unasserted New Zealand weathertightness claims in the period in which the loss becomes probable and estimable. The amount of reasonably possible loss is dependent on a number of factors including, without limitation, the specific facts and circumstances unique to each claim brought against the Company’s New Zealand subsidiaries, the existence of any co-defendants involved in defending the claim, the solvency of such co-defendants (including the ability of such co-defendants to remain solvent until the related claim is ultimately resolved), the availability of claimant compensation under a government compensation scheme, the amount of loss estimated to be allocable to the Company’s New Zealand subsidiaries and the extent to which the co-defendants and the Company’s New Zealand subsidiaries have access to third-party recoveries to cover a portion of the costs incurred in defending and resolving such actions. In addition to the above limitations, the total loss incurred is also dependent on the manner and extent to which statutory limitation periods will apply to any received claims.
Historically, the Company’s New Zealand subsidiaries have been joined to these claims as one of several co-defendants, including local government entities responsible for enforcing building codes and practices, resulting in the Company’s New Zealand subsidiaries becoming liable for only a portion of each claim. In addition, the Company’s New Zealand subsidiaries have had access to third-party recoveries to defray a portion of the costs incurred in resolving such claims. However, in 2015 the Company’s New Zealand subsidiaries were named as the sole defendants in four claims on behalf of multiple defendants, each of which allege that the subsidiaries’ products were inherently defective.
The Company has established a provision for asserted and unasserted New Zealand weathertightness claims within the current portion of Other liabilities, with a corresponding
| James Hardie Industries plc – Notes to Consolidated Financial Statements (Continued) | 152 |
estimated receivable for third-party recoveries being recognized within Accounts and other receivables. At 31 March 2016 and 2015, the amount of the provision for New Zealand weathertightness claims, net of estimated third-party recoveries, was US$1.8 million and US$2.0 million, respectively.
The estimated loss for these matters, net of estimated third-party recoveries, incorporates assumptions that are subject to the foregoing uncertainties and are principally derived from, but not exclusively based on, historical claims experience together with facts and circumstances unique to each claim. If the nature and extent of the resolution of claims in future periods differ from the historical claims experience, then the actual amount of loss may be materially higher or lower than estimated losses accrued at 31 March 2016.
Environmental and Legal
The operations of the Company, like those of other companies engaged in similar businesses, are subject to a number of laws and regulations on air and water quality, waste handling and disposal. The Company’s policy is to accrue for environmental costs when it is determined that it is probable that an obligation exists and the amount can be reasonably estimated.
Operating Leases
As the lessee, the Company principally enters into property, building and equipment leases. The following are future minimum lease payments for non-cancellable operating leases having a remaining term in excess of one year at 31 March 2016:
| Years ending 31 March (Millions of US dollars): | ||||
| 2017 |
$ | 18.0 | ||
| 2018 |
15.0 | |||
| 2019 |
11.8 | |||
| 2020 |
8.3 | |||
| 2021 |
3.3 | |||
| Thereafter |
4.2 | |||
|
|
|
|||
| Total |
$ | 60.6 | ||
|
|
|
|||
Rental expense amounted to US$16.9 million, US$16.7 million and US$18.0 million for the years ended 31 March 2016, 2015 and 2014, respectively.
Capital Commitments
Commitments for the acquisition of plant and equipment and other purchase obligations contracted for but not recognized as liabilities and generally payable within one year, were nil at 31 March 2016.
| James Hardie Industries plc – Notes to Consolidated Financial Statements (Continued) | 153 |
15. Income Taxes
Income tax (expense) benefit includes income taxes currently payable and those deferred because of temporary differences between the financial statement and tax bases of assets and liabilities. Income tax (expense) benefit consists of the following components:
| Years Ended 31 March | ||||||||||||
| (Millions of US dollars) | 2016 | 2015 | 2014 | |||||||||
| Income from operations before income taxes: |
||||||||||||
| Domestic |
$ | 150.1 | $ | 145.5 | $ | 141.6 | ||||||
| Foreign |
180.4 | 177.1 | (87.0) | |||||||||
|
|
|
|
|
|
|
|||||||
| Total income before income taxes |
$ | 330.5 | $ | 322.6 | $ | 54.6 | ||||||
|
|
|
|
|
|
|
|||||||
| Income tax expense |
||||||||||||
| Current: |
||||||||||||
| Domestic |
$ | (12.6) | $ | (11.9) | $ | (8.9) | ||||||
| Foreign |
(59.2) | (39.3) | (9.7) | |||||||||
|
|
|
|
|
|
|
|||||||
| Current income tax expense |
(71.8) | (51.2) | (18.6) | |||||||||
|
|
|
|
|
|
|
|||||||
| Deferred: |
||||||||||||
| Domestic |
(5.6) | (3.7) | (3.3) | |||||||||
| Foreign |
(8.7) | 23.6 | 66.8 | |||||||||
|
|
|
|
|
|
|
|||||||
| Deferred income tax (expense) benefit |
(14.3) | 19.9 | 63.5 | |||||||||
|
|
|
|
|
|
|
|||||||
| Total income tax (expense) benefit |
$ | (86.1) | $ | (31.3) | $ | 44.9 | ||||||
|
|
|
|
|
|
|
|||||||
Income tax (expense) benefit computed at the statutory rates represents taxes on income applicable to all jurisdictions in which the Company conducts business, calculated at the statutory income tax rate in each jurisdiction multiplied by the pre-tax income attributable to that jurisdiction.
| James Hardie Industries plc – Notes to Consolidated Financial Statements (Continued) | 154 |
Income tax (expense) benefit is reconciled to the tax at the statutory rates as follows:
| Years Ended 31 March | ||||||||||||
| (Millions of US dollars) | 2016 | 2015 | 2014 | |||||||||
| Income tax (expense) benefit at statutory tax rates |
$ | (79.1) | $ | (75.0) | $ | 6.2 | ||||||
| US state income taxes, net of the federal benefit |
(3.6) | (2.4) | (1.8) | |||||||||
| Asbestos adjustments |
(0.8) | 48.3 | 30.2 | |||||||||
| Expenses not deductible |
(2.0) | (3.4) | (2.1) | |||||||||
| Non-assessable items |
1.9 | 0.5 | 0.6 | |||||||||
| US manufacturing deduction |
4.1 | 2.6 | 1.2 | |||||||||
| Foreign taxes on domestic income |
(5.7) | (0.7) | - | |||||||||
| Amortization of intangibles |
2.9 | 2.8 | 1.7 | |||||||||
| Taxes on foreign income |
(7.4) | (4.5) | (2.9) | |||||||||
| Tax assessment in dispute |
- | - | 10.7 | |||||||||
| Other items |
3.6 | 0.5 | 1.1 | |||||||||
|
|
|
|
|
|
|
|||||||
| Total income tax (expense) benefit |
$ | (86.1) | $ | (31.3) | $ | 44.9 | ||||||
|
|
|
|
|
|
|
|||||||
| Effective tax rate |
26.1% | 9.7% | (82.2%) | |||||||||
|
|
|
|
|
|
|
|||||||
Deferred tax balances consist of the following components:
| 31 March | ||||||||
| (Millions of US dollars) | 2016 | 2015 | ||||||
| Deferred tax assets: |
||||||||
| Asbestos liability |
$ | 384.9 | $ | 405.2 | ||||
| Other provisions and accruals |
49.0 | 46.3 | ||||||
| Net operating loss carryforwards |
24.2 | 17.0 | ||||||
| Foreign tax credit carryforwards |
112.4 | 107.0 | ||||||
|
|
|
|
|
|||||
| Total deferred tax assets |
570.5 | 575.5 | ||||||
| Valuation allowance |
(115.0) | (113.0) | ||||||
|
|
|
|
|
|||||
| Total deferred tax assets, net of valuation allowance |
455.5 | 462.5 | ||||||
|
|
|
|
|
|||||
| Deferred tax liabilities: |
||||||||
| Depreciable and amortizable assets |
(117.4) | (112.3) | ||||||
| Other |
(9.4) | (3.7) | ||||||
|
|
|
|
|
|||||
| Total deferred tax liabilities |
(126.8) | (116.0) | ||||||
|
|
|
|
|
|||||
| Net deferred tax assets |
$ | 328.7 | $ | 346.5 | ||||
|
|
|
|
|
|||||
Deferred income taxes include European and Australian net operating loss carry-forwards. At 31 March 2016 the Company had European tax loss carry-forwards of approximately US$6.8 million and Australian tax loss carry-forwards of approximately US$17.3 million, that are
| James Hardie Industries plc – Notes to Consolidated Financial Statements (Continued) | 155 |
available to offset future taxable income in the respective jurisdiction. The Company establishes a valuation allowance against a deferred tax asset if it is more likely than not that some portion or all of the deferred tax asset will not be realized.
The European tax loss carry-forwards relate to losses incurred in prior years during the establishment of the European business. At 31 March 2016, the Company had a valuation allowance against a portion of the European tax loss carry-forwards in respect of which realization is not more likely than not. During the year ended 31 March 2016, the Company reversed a valuation allowance of US$4.2 million for a portion of its European tax loss carry-forwards for which realization is now more likely than not. At 31 March 2016, the Company had European tax loss carry-forwards of approximately US$6.8 million that are available to offset future taxable income, of which US$4.2 million will never expire. Carry-forwards of US$2.6 million will expire in fiscal years 2017 through 2025.
The Australian tax loss carry-forwards primarily result from current and prior year tax deductions for contributions to AICF. James Hardie 117 Pty Limited, the performing subsidiary under the AFFA, is able to claim a tax deduction for its contributions to AICF over a five-year period commencing in the year the contribution is incurred. At 31 March 2016, the Company recognized a tax deduction of US$63.0 million (A$85.5 million) for the current year relating to total contributions to AICF of US$411.4 million (A$427.4 million) incurred in tax years 2012 through 2016.
At 31 March 2016, the Company had foreign tax credit carry-forwards of US$112.4 million that are available to offset future taxes payable. At 31 March 2016, the Company had a 100% valuation allowance against the foreign tax credit carry-forwards.
In determining the need for and the amount of a valuation allowance in respect of the Company’s asbestos related deferred tax asset, management reviewed the relevant empirical evidence, including the current and past core earnings of the Australian business and forecast earnings of the Australian business considering current trends. Although realization of the deferred tax asset will occur over the life of the AFFA, which extends beyond the forecast period for the Australian business, Australia provides an unlimited carry-forward period for tax losses. Based upon managements’ review, the Company believes that it is more likely than not that the Company will realize its asbestos related deferred tax asset and that no valuation allowance is necessary as of 31 March 2016. In the future, based on review of the empirical evidence by management at that time, if management determines that realization of its asbestos related deferred tax asset is not more likely than not, the Company may need to provide a valuation allowance to reduce the carrying value of the asbestos related deferred tax asset to its realizable value.
Income taxes payable represents taxes currently payable which are computed at statutory income tax rates applicable to taxable income derived in each jurisdiction in which the Company conducts business.
At 31 March 2016, the Company had income taxes currently payable of US$4.8 million, after taking into account total income tax and withholding tax paid, net of refunds received, during the year ended 31 March 2016 of US$57.8 million. Income taxes were paid in Canada, Ireland, New Zealand, the Philippines and the United States. Withholding taxes were paid or refunded in Australia, Canada, New Zealand, the Philippines and the United States.
| James Hardie Industries plc – Notes to Consolidated Financial Statements (Continued) | 156 |
At 31 March 2016 the Company intends to indefinitely reinvest the undistributed earnings of approximately US$200 million of a certain subsidiary owned by its US subsidiary, and has not provided for taxes that would be payable upon remittance of those earnings. The amount of the potential deferred tax liability related to these undistributed earnings is impracticable to determine at this time.
Due to the size and nature of its business, the Company is subject to ongoing reviews by taxing jurisdictions on various tax matters. The Company accrues for tax contingencies based upon its best estimate of the taxes ultimately expected to be paid, which it updates over time as more information becomes available. Such amounts are included in taxes payable or other non-current liabilities, as appropriate. If the Company ultimately determines that payment of these amounts is unnecessary, the Company reverses the liability and recognizes a tax benefit during the period in which the Company determines that the liability is no longer necessary. The Company records additional tax expense in the period in which it determines that the recorded tax liability is less than the ultimate assessment it expects.
The Company or its subsidiaries files income tax returns in various jurisdictions including Ireland, the United States, Australia, New Zealand, the Philippines and The Netherlands. The Company is no longer subject to US federal examinations by US Internal Revenue Service (“IRS”) for tax years prior to tax year 2013 and Australian federal examinations by the Australian Taxation Office (“ATO”) for tax years prior to tax year 2012.
Taxing authorities from various jurisdictions in which the Company operates are in the process of reviewing and auditing the Company’s respective jurisdictional tax returns for various ranges of years. The Company accrues tax liabilities in connection with ongoing audits and reviews based on knowledge of all relevant facts and circumstances, taking into account existing tax laws, its experience with previous audits and settlements, the status of current tax examinations and how the tax authorities view certain issues.
| James Hardie Industries plc – Notes to Consolidated Financial Statements (Continued) | 157 |
Unrecognized Tax Benefits
A reconciliation of the beginning and ending amount of unrecognized tax benefits and interest and penalties are as follows:
| (US$ millions) | Unrecognized tax benefits |
Interest and Penalties |
||||||
| Balance at 31 March 2013 |
$ | 1.5 | $ | 0.1 | ||||
|
|
|
|
|
|||||
| Additions for tax positions of the current year |
0.1 | - | ||||||
| Additions for tax positions of prior year |
0.1 | - | ||||||
| Settlements paid during the current period |
(1.2 | ) | - | |||||
| Other reductions for the tax positions of prior periods |
- | (0.1) | ||||||
|
|
|
|
|
|||||
| Balance at 31 March 2014 |
$ | 0.5 | $ | - | ||||
|
|
|
|
|
|||||
| Additions for tax positions of the current year |
4.2 | 0.1 | ||||||
| Additions for tax positions of prior year |
0.2 | 0.2 | ||||||
|
|
|
|
|
|||||
| Balance at 31 March 2015 |
$ | 4.9 | $ | 0.3 | ||||
|
|
|
|
|
|||||
| Additions for tax positions of the current year |
0.2 | - | ||||||
| Reductions in tax positions of prior year |
(4.1 | ) | (0.3) | |||||
| Settlements paid during the current period |
(0.3 | ) | - | |||||
|
|
|
|
|
|||||
| Balance at 31 March 2016 |
$ | 0.7 | $ | - | ||||
|
|
|
|
|
|||||
At 31 March 2016, the total amount of unrecognized tax benefits and the total amount of interest and penalties accrued by the Company related to unrecognized tax benefits that, if recognized, would affect the tax expense is US$0.7 million and nil, respectively.
The Company recognizes penalties and interest accrued related to unrecognized tax benefits in income tax expense. During the years ended 31 March 2016 and 2015, income of US$0.3 million and expense of $0.3 million, respectively, relating to interest and penalties was recognized within income tax expense arising from movements in unrecognized tax benefits.
The liabilities associated with uncertain tax benefits are included in Other liabilities on the Company’s consolidated balance sheets.
A number of years may elapse before an uncertain tax position is audited or ultimately resolved. It is difficult to predict the ultimate outcome or the timing of resolution for uncertain tax positions. It is reasonably possible that the amount of unrecognized tax benefits could significantly increase or decrease within the next twelve months. These changes could result from the completion of ongoing examinations, the expiration of the statute of limitations, or other circumstances. At this time, an estimate of the range of the reasonably possible change cannot be made.
| James Hardie Industries plc – Notes to Consolidated Financial Statements (Continued) | 158 |
Interest Payments from Australia Tax Office (“ATO”)
During the quarter ended 31 March 2012, the ATO provided a refund of US$396.3 million to RCI Pty Ltd (“RCI”), a wholly owned subsidiary of the Company, resulting from RCI’s successful appeal of a disputed amended tax assessment related to RCI’s income tax return for its 1999 fiscal year. The facts and circumstances relating to RCI’s successful appeal of the disputed amended tax assessment were fully disclosed in the notes to the Company’s consolidated financial statements as of and for the year ended 31 March 2012.
On 4 November 2013, the ATO notified RCI that RCI was entitled to a final additional amount of interest of A$17.3 million (US$15.4 million) in respect of amounts paid by RCI to the ATO while the appeal of the disputed amended tax assessment was in process. This final amount of interest was received from the ATO on 7 January 2014. As the receipt of this interest from the ATO relates to RCI’s successful appeal of its disputed amended tax assessment, the additional interest, net of tax, is included in Income tax benefit in the Company’s consolidated statements of operations and comprehensive income for the year ended 31 March 2014.
16. Stock-Based Compensation
Total stock-based compensation expense consists of the following:
| Years Ended 31 March | ||||||||||||
| (Millions of US dollars) | 2016 | 2015 | 2014 | |||||||||
| Liability Awards Expense |
$ | 4.8 | $ | 3.3 | $ | 4.5 | ||||||
| Equity Awards Expense |
10.3 | 9.2 | 8.5 | |||||||||
|
|
|
|||||||||||
| Total stock-based compensation expense |
$ | 15.1 | $ | 12.5 | $ | 13.0 | ||||||
|
|
|
|||||||||||
As of 31 March 2016, the unrecorded future stock-based compensation expense related to outstanding equity awards was US$14.0 million after estimated forfeitures and will be recognized over an estimated weighted average amortization period of 1.5 years.
2001 Equity Incentive Plan
Under the Company’s 2001 Equity Incentive Plan (the “2001 Plan”), the Company can grant equity awards in the form of nonqualified stock options, performance awards, restricted stock grants, stock appreciation rights, dividend equivalent rights, phantom stock or other stock-based benefits such as restricted stock units. The 2001 Plan was first approved by the Company’s shareholders in 2001 and was reapproved to continue until September 2021 at the 2011 annual general meeting. The Company is authorized to issue 45,077,100 shares under the 2001 Plan.
Under the 2001 Plan, grants have been made at fair market value to management and other employees of the Company. Each option confers the right to subscribe for one ordinary share in the capital of JHI plc. The options may be exercised as follows: 25% after the first year; 25% after the second year; and 50% after the third year. All unexercised options expire 10 years from the date of issue or 90 days after the employee ceases to be employed by the Company.
| James Hardie Industries plc – Notes to Consolidated Financial Statements (Continued) | 159 |
As set out in the plan rules, the exercise prices and the number of shares available on exercise may be adjusted on the occurrence of certain events, including new issues, share splits, rights issues and capital reconstructions.
Under the 2001 Plan, the Company granted 327,354 and 329,192 restricted stock units to its employees in the years ended 31 March 2016 and 2015, respectively. These restricted stock units may not be sold, transferred, assigned, pledged or otherwise encumbered so long as such units remain restricted. The Company determines the conditions or restrictions of any restricted stock awards, which include requirements of continued employment. At 31 March 2016, there were 701,810 restricted stock units outstanding under this plan.
Long-Term Incentive Plan 2006
At the 2006 Annual General Meeting, the Company’s shareholders approved the establishment of a Long-Term Incentive Plan 2006 (the “LTIP”) to provide incentives to certain members of senior management (“Executives”). The shareholders also approved, in accordance with certain LTIP rules, the issue of options in the Company to Executives of the Company. At the Company’s 2008 Annual General Meeting, the shareholders amended the LTIP to also allow restricted stock units to be granted under the LTIP. The LTIP was re-approved by the Company’s shareholders with certain amendments at each of the 2008, 2012 and 2015 Annual General Meetings.
As of 31 March 2016, the Company had granted 10,163,138 restricted stock units under the LTIP. These restricted stock units may not be sold, transferred, assigned, pledged or otherwise encumbered so long as such units remain restricted. The Company determines the conditions or restrictions of any restricted stock awards, which may include requirements of continued employment, individual performance or the Company’s financial performance or other criteria. Restricted stock units expire on vesting or as set out in the grant documents or LTIP rules. At 31 March 2016, there were 3,347,644 restricted stock units outstanding under the LTIP.
In November 2006 and August 2007, 1,132,000 and 1,016,000 options were granted to Executives, respectively, under the LTIP. The vesting of these equity awards are subject to ‘performance hurdles’ as outlined in the LTIP rules. Unexercised options expire 10 years from the date of issue unless an Executive ceases employment with the Company. At 31 March 2016, there were no options outstanding under the LTIP.
| James Hardie Industries plc – Notes to Consolidated Financial Statements (Continued) | 160 |
The following table summarizes the Company’s shares available for grant as options, restricted stock units or other equity instruments under the LTIP and 2001 Plan at 31 March 2016, 2015 and 2014:
| Shares Available for Grant |
||||
| Balance at 31 March 2014 |
23,947,127 | |||
|
|
|
|||
| Granted |
(1,192,225) | |||
| New Shares Authorized |
2,000,000 | |||
|
|
|
|||
| Balance at 31 March 2015 |
24,754,902 | |||
|
|
|
|||
| Granted |
(1,410,560) | |||
| New Shares Authorized |
5,000,000 | |||
| Forfeitures Available for Re-grant |
74,466 | |||
|
|
|
|||
| Balance at 31 March 2016 |
28,418,808 | |||
|
|
|
|||
Stock Options
There were no stock options granted during the years ended 31 March 2016 and 2015. The following table summarizes the Company’s stock options activity during the noted period:
| Outstanding Options | ||||||||
| Number | Weighted Average Exercise Price (A$) |
|||||||
| Balance at 31 March 2014 |
1,099,276 | 8.11 | ||||||
|
|
|
|||||||
| Exercised |
(587,496) | 8.06 | ||||||
|
|
|
|||||||
| Balance at 31 March 2015 |
511,780 | 8.17 | ||||||
|
|
|
|||||||
| Exercised |
(333,287) | 8.54 | ||||||
| Forfeited |
(74,466) | 7.85 | ||||||
|
|
|
|||||||
| Balance at 31 March 2016 |
104,027 | 7.22 | ||||||
|
|
|
|||||||
The total intrinsic value of stock options exercised was A$2.9 million and A$3.6 million for the years ended 31 March 2016 and 2015, respectively.
Windfall tax benefits realized in the United States from stock options exercised and included in cash flows from financing activities in the consolidated statements of cash flows were US$0.4 million, US$1.4 million and US$5.6 million for the years ended 31 March 2016, 2015 and 2014, respectively.
| James Hardie Industries plc – Notes to Consolidated Financial Statements (Continued) | 161 |
The following table summarizes outstanding and exercisable options under both the 2001 Plan and the LTIP as of 31 March 2016:
| Options Outstanding | Options Exercisable | |||||||||||||||||||||||||||||||||
| Exercise Price (A$) |
Number | Weighted Average Remaining Life (in Years) |
Weighted Average Exercise Price (A$) |
Aggregate Intrinsic Value (A$) |
Number | Weighted Average Exercise Price (A$) |
Aggregate Intrinsic Value (A$) |
|||||||||||||||||||||||||||
| 6.38 |
60,527 | 1.7 | 6.38 | 694,850 | 60,527 | 6.38 | 694,850 | |||||||||||||||||||||||||||
| 8.40 |
43,500 | 0.6 | 8.40 | 411,510 | 43,500 | 8.40 | 411,510 | |||||||||||||||||||||||||||
|
|
|
|
|
|
|
|
|
|||||||||||||||||||||||||||
| Total |
104,027 | $ | 1,106,360 | 104,027 | $ | 1,106,360 | ||||||||||||||||||||||||||||
|
|
|
|
|
|
|
|
|
|||||||||||||||||||||||||||
The aggregate intrinsic value in the preceding table represents the total pre-tax intrinsic value based on stock options with an exercise price less than the Company’s closing stock price of A$17.86 as of 31 March 2016, which would have been received by the option holders had those option holders exercised their options as of that date.
Restricted Stock Units
The Company estimates the fair value of restricted stock units on the date of grant and recognizes this estimated fair value as compensation expense over the periods in which the restricted stock vests.
The following table summarizes the Company’s restricted stock unit activity during the noted period:
| Restricted Stock Units |
Weighted Average Fair Value at Grant Date (A$) |
|||||||
| Non-vested at 31 March 2014 |
3,883,918 | 7.17 | ||||||
|
|
|
|||||||
| Granted |
1,192,225 | 11.00 | ||||||
| Vested |
(774,675) | 6.63 | ||||||
| Forfeited |
(293,467) | 6.90 | ||||||
|
|
|
|||||||
| Non-vested at 31 March 2015 |
4,008,001 | 8.44 | ||||||
|
|
|
|||||||
| Granted |
1,410,560 | 14.95 | ||||||
| Vested |
(1,219,352) | 7.28 | ||||||
| Forfeited |
(149,755) | 9.92 | ||||||
|
|
|
|||||||
| Non-vested at 31 March 2016 |
4,049,454 | 11.00 | ||||||
|
|
|
|||||||
Restricted Stock Units – service vesting
On 9 December 2015, 327,354 restricted stock units (service vesting) were granted to employees under the 2001 Plan. On 9 December 2014, 329,192 restricted stock units (service vesting) were
| James Hardie Industries plc – Notes to Consolidated Financial Statements (Continued) | 162 |
granted to employees under the 2001 Plan. The fair value of each restricted stock unit (service vesting) is equal to the market value of the Company’s common stock on the date of the grant, adjusted for the fair value of estimated dividends as the restricted stock unit holder is not entitled to dividends over the vesting period.
During fiscal year 2016, 228,481 restricted stock units (service vesting) that were previously granted as part of the 2001 Plan became fully vested and the underlying common stock was issued. During fiscal year 2015, 222,885 restricted stock units (service vesting) that were previously granted as part of the 2001 Plan became fully vested and the underlying common stock was issued.
Restricted Stock Units – performance vesting
The Company granted 503,944 and 403,716 restricted stock units with a performance vesting condition under the LTIP to senior executives and managers of the Company on 16 September 2015 and 16 September 2014, respectively. The vesting of the restricted stock units is deferred for three years and is subject to a return on capital employed (“ROCE”) performance hurdle being met. The vesting of the restricted stock units is also subject to negative discretion by the Board. The Board’s discretion will reflect the Board’s judgment of the quality of the returns balanced against management’s delivery of market share growth and a scorecard of key qualitative and quantitative performance objectives. During fiscal year 2016, and after exercise of negative discretion by the Board, 331,146 restricted stock units (performance vesting) that were granted on 14 September 2012 as part of the fiscal year 2013 long-term incentive award became fully vested and the underlying common stock was issued. The remaining 82,794 unvested restricted stock units from this grant were cancelled on 14 September 2015.
The Company granted 266,627 restricted stock units with a performance vesting condition under the LTIP to senior executives and managers of the Company on 7 June 2012. During fiscal year 2015, 237,239 restricted stock units (performance vesting) that were granted on 7 June 2012 as part of the fiscal year 2012 long-term incentive award became fully vested and the underlying common stock was issued.
When the Board reviews the awards and determines whether any negative discretion should be applied at the vesting date, the award recipients may receive all, some, or none of their awards. The Board may only exercise negative discretion and may not enhance the maximum award that was originally granted to the award recipient.
The fair value of each restricted stock unit (performance vesting) is adjusted for changes in JHI plc’s common stock price at each balance sheet date until the performance conditions are applied at the vesting date.
Restricted Stock Units – market condition
Under the terms of the LTIP, the Company granted 579,262 and 459,317 restricted stock units (market condition) to senior executives and managers of the Company on 16 September 2015 and 16 September 2014, respectively. The vesting of these restricted stock units is subject to a market condition as outlined in the relevant notice of meeting.
| James Hardie Industries plc – Notes to Consolidated Financial Statements (Continued) | 163 |
The fair value of each of these restricted stock units (market condition) granted under the LTIP is estimated using a binomial lattice model that incorporates a Monte Carlo simulation (the “Monte Carlo” method). The following table includes the assumptions used for restricted stock grants (market condition) valued during the year ended 31 March 2016 and 2015, respectively:
| Vesting Condition: | Market | Market | ||||||
| FY16 |
FY15 |
|||||||
| Date of grant |
16 Sep 2015 | 16 Sep 2014 | ||||||
| Dividend yield (per annum) |
3.8% | 4.5% | ||||||
| Expected volatility |
36.8% | 37.4% | ||||||
| Risk free interest rate |
1.5% | 1.6% | ||||||
| Expected life in years |
3.0 | 3.0 | ||||||
| JHX stock price at grant date (A$) |
17.76 | 12.42 | ||||||
| Number of restricted stock units |
579,262 | 459,317 | ||||||
During fiscal year 2016, 659,725 restricted stock units (market condition) that were previously granted became fully vested and the underlying common stock was issued. During fiscal year 2015, 313,865 restricted stock units (market condition) that were previously granted became fully vested and the underlying common stock was issued.
Scorecard LTI – cash settled units
Under the terms of the LTIP, the Company granted awards equivalent to 566,936 and 454,179 Scorecard LTI units on 16 September 2015 and 16 September 2014, respectively. These awards provide recipients a cash incentive based on an average 20 trading-day closing price of JHI plc’s common stock price and each executive’s scorecard rating. The vesting of awards is measured on individual performance conditions based on certain performance measures. Compensation expense recognized for awards are based on the fair market value of JHI plc’s common stock on the date of grant and recorded as a liability. The expense is recognized ratably over the vesting period and the liability is adjusted for subsequent changes in JHI plc’s common stock price at each balance sheet date.
On 14 September 2015, 288,552 of the 506,627 Scorecard LTI units that were previously granted on 14 September 2012 as part of the FY2013 long-term incentive award became fully vested and the balance lapsed as a result of the Board’s exercise of negative discretion. The cash amount paid to award recipients was based on an average 20 trading-day closing price of JHI plc’s common stock price.
On 6 June 2014, 445,141 of the 716,536 Scorecard LTI units that were previously granted on 7 June 2011 as part of the FY2012 long-term incentive award became fully vested and the balance lapsed as a result of the Board’s exercise of negative discretion. The cash amount paid to award recipients was based on an average 10 trading-day closing price of JHI plc’s common stock price
| James Hardie Industries plc – Notes to Consolidated Financial Statements (Continued) | 164 |
17. Capital Management and Dividends
The following table summarizes the dividends declared or paid during the fiscal years 2016, 2015 and 2014:
| (Millions of US dollars) | US Cents/Security |
US$ Total Amount |
Announcement Date | Record Date | Payment Date | |||||||||
| FY 2016 first half dividend |
0.09 | 39.7 | 19 November 2015 | 23 December 2015 | 26 February 2016 | |||||||||
| FY 2015 special dividend |
0.22 | 92.8 | 21 May 2015 | 11 June 2015 | 7 August 2015 | |||||||||
| FY 2015 second half dividend |
0.27 | 114.0 | 21 May 2015 | 11 June 2015 | 7 August 2015 | |||||||||
| FY 2015 first half dividend |
0.08 | 34.2 | 19 November 2014 | 23 December 2014 | 27 February 2015 | |||||||||
| FY 2014 special dividend |
0.20 | 89.0 | 22 May 2014 | 12 June 2014 | 8 August 2014 | |||||||||
| FY 2014 second half dividend |
0.32 | 142.3 | 22 May 2014 | 12 June 2014 | 8 August 2014 | |||||||||
| 125 year anniversary special dividend |
0.28 | 124.6 | 28 February 2014 | 21 March 2014 | 30 May 2014 | |||||||||
| FY 2014 first half dividend |
0.08 | 35.5 | 14 November 2013 | 19 December 2013 | 28 March 2014 | |||||||||
| FY 2013 special dividend |
0.24 | 106.1 | 23 May 2013 | 28 June 2013 | 26 July 2013 | |||||||||
| FY 2013 second half dividend |
0.13 | 57.5 | 23 May 2013 | 28 June 2013 | 26 July 2013 | |||||||||
During fiscal year 2016, the Company announced a share buyback program (the “fiscal 2016 program”) to acquire up to 5% of its issued capital in the twelve months through May 2016. Under this program, the Company repurchased and cancelled 1,653,247 shares of its common stock during the second quarter of fiscal year 2016. The aggregate cost of the shares repurchased and cancelled was A$30.0 million (US$22.3 million), at an average market price of A$18.14 (US$13.50).
Upon the expiration of the fiscal 2016 program, the Company announced a new share buyback program (the “fiscal 2017 program”) to acquire up to US$100.0 million of its issued capital in the twelve months through May 2017.
Subsequent to 31 March 2016, the Company announced an ordinary dividend of US29.0 cents per security, with a record date of 9 June 2016 and a payment date of 5 August 2016.
18. Operating Segment Information and Concentrations of Risk
During the year ended 31 March 2016, the Company changed the name of its USA and Europe Fiber Cement segment to the North America and Europe Fiber Cement segment to better reflect the segment’s geographic nature; however, the composition of the segment remained the same.
The Company has reported its operating segment information in the format that the operating segment information is available to and evaluated by the Chief Operating Decision Maker, and includes North America and Europe Fiber Cement, Asia Pacific Fiber Cement and Research and Development. North America and Europe Fiber Cement manufactures fiber cement interior linings, exterior siding products and related accessories in the United States; these products are sold in the United States, Canada and Europe. Asia Pacific Fiber Cement includes all fiber cement manufactured in Australia, New Zealand and the Philippines and sold in Australia,
| James Hardie Industries plc – Notes to Consolidated Financial Statements (Continued) | 165 |
New Zealand, Asia, the Middle East (Israel, Saudi Arabia, Lebanon and the United Arab Emirates) and various Pacific Islands. Research and Development represents the cost incurred by the research and development centers. General Corporate costs primarily consist of officer and employee compensation and related benefits, professional and legal fees, administrative costs and rental expense, net of rental income, on the Company’s corporate offices.
Operating Segments
The following is the Company’s operating segment information:
| Net Sales to Customers Years Ended 31 March |
||||||||||||
| (Millions of US dollars) | 2016 | 2015 | 2014 | |||||||||
| North America & Europe Fiber Cement |
$ | 1,386.3 | $ | 1,276.5 | $ | 1,127.6 | ||||||
| Asia Pacific Fiber Cement |
341.9 | 380.4 | 366.2 | |||||||||
|
|
|
|
|
|
|
|||||||
| Worldwide total |
$ | 1,728.2 | $ | 1,656.9 | $ | 1,493.8 | ||||||
|
|
|
|
|
|
|
|||||||
| Income Before Income Taxes Years Ended 31 March |
||||||||||||
| (Millions of US dollars) | 2016 | 2015 | 2014 | |||||||||
| North America & Europe Fiber Cement1 |
$ | 340.6 | $ | 285.9 | $ | 237.0 | ||||||
| Asia Pacific Fiber Cement1, 6, 7 |
80.9 | 94.1 | 81.1 | |||||||||
| Research and Development1 |
(23.9) | (26.0) | (24.4) | |||||||||
|
|
|
|
|
|
|
|||||||
|
|
|
|
|
|
|
|||||||
| Segments total |
397.6 | 354.0 | 293.7 | |||||||||
| General Corporate2 |
(43.6) | (19.0) | (240.6) | |||||||||
|
|
|
|
|
|
|
|||||||
|
|
|
|
|
|
|
|||||||
| Total operating income |
354.0 | 335.0 | 53.1 | |||||||||
| Net interest expense3 |
(25.6) | (7.5) | (1.1) | |||||||||
| Other income (expense) |
2.1 | (4.9) | 2.6 | |||||||||
|
|
|
|
|
|
|
|||||||
|
|
|
|
|
|
|
|||||||
| Worldwide total |
$ | 330.5 | $ | 322.6 | $ | 54.6 | ||||||
|
|
|
|
|
|
|
|||||||
| Total Identifiable Assets 31 March |
||||||||||
| (Millions of US dollars) | 2016 | 2015 | ||||||||
|
|
|
|
|
|
||||||
| North America & Europe Fiber Cement |
$ | 944.0 | $ | 959.3 | ||||||
| Asia Pacific Fiber Cement |
297.4 | 279.8 | ||||||||
| Research and Development |
13.6 | 20.7 | ||||||||
|
|
|
|
|
|
||||||
|
|
|
|
|
|
||||||
| Segments total |
1,255.0 | 1,259.8 | ||||||||
| General Corporate4, 5 |
785.4 | 784.7 | ||||||||
|
|
|
|
|
|
||||||
|
|
|
|
|
|
||||||
| Worldwide total |
$ | 2,040.4 | $ | 2,044.5 | ||||||
|
|
|
|
|
|
||||||
| James Hardie Industries plc – Notes to Consolidated Financial Statements (Continued) | 166 |
The following is the Company’s geographical information:
| Net Sales to Customers Years Ended 31 March |
||||||||||||
| (Millions of US dollars) |
2016 | 2015 | 2014 | |||||||||
| North America |
$ | 1,348.8 | $ | 1,238.5 | $ | 1,094.6 | ||||||
| Australia |
228.4 | 267.7 | 259.2 | |||||||||
| New Zealand |
61.4 | 64.7 | 63.0 | |||||||||
| Other Countries |
89.6 | 86.0 | 77.0 | |||||||||
|
|
|
|
|
|
|
|||||||
| Worldwide total |
$ | 1,728.2 | $ | 1,656.9 | $ | 1,493.8 | ||||||
|
|
|
|
|
|
|
|||||||
|
Total Identifiable Assets 31 March |
||||||||||||
| (Millions of US dollars) |
2016 | 2015 | ||||||||||
| North America |
$ | 925.1 | $ | 956.4 | ||||||||
| Australia |
232.4 | 223.4 | ||||||||||
| New Zealand |
26.5 | 25.8 | ||||||||||
| Other Countries |
71.0 | 54.2 | ||||||||||
|
|
|
|
|
|||||||||
| Segments total |
1,255.0 | 1,259.8 | ||||||||||
| General Corporate4, 5 |
785.4 | 784.7 | ||||||||||
|
|
|
|
|
|||||||||
| Worldwide total |
$ | 2,040.4 | $ | 2,044.5 | ||||||||
|
|
|
|
|
|||||||||
| 1 | Research and development expenditures are expensed as incurred and are summarized by segment in the following table: |
| Years Ending 31 March | ||||||||||||
| (Millions of US dollars) | 2016 | 2015 | 2014 | |||||||||
| North America & Europe Fiber Cement |
$ | 6.6 | $ | 6.1 | $ | 9.6 | ||||||
| Asia Pacific Fiber Cement |
1.2 | 1.4 | 1.3 | |||||||||
| Research and Developmenta |
21.7 | 24.2 | 22.2 | |||||||||
|
|
|
|||||||||||
| $ | 29.5 | $ | 31.7 | $ | 33.1 | |||||||
|
|
|
|||||||||||
| a The Research and Development segment also included selling, general and administrative expenses of US$2.2 million, US$1.8 million and US$2.2 million in fiscal years 2016, 2015 and 2014, respectively. |
| 2 | The principal components of General Corporate costs are officer and employee compensation and related benefits, professional and legal fees, administrative costs, and rental expense on the Company’s corporate offices. Also included in General Corporate costs are the following: |
| Years Ended 31 March | ||||||||||||
| (Millions of US dollars) | 2016 | 2015 | 2014 | |||||||||
| Asbestos Adjustments |
$ | 5.5 | $ | 33.4 | $ | (195.8 | ) | |||||
| AICF SG&A expenses |
1.7 | 2.5 | 2.1 | |||||||||
| James Hardie Industries plc – Notes to Consolidated Financial Statements (Continued) | 167 |
| 3 | The Company does not report net interest expense for each operating segment as operating segments are not held directly accountable for interest expense. All net interest expense is included in the General Corporate costs. Included in net interest expense is net AICF interest expense (income) of US$0.3 million, US$(1.4) million and US$(2.9) million in fiscal years 2016, 2015 and 2014, respectively. |
| 4 | The Company does not report deferred tax assets and liabilities for each operating segment as operating segments are not held directly accountable for deferred income taxes. All deferred income taxes are included in General Corporate costs. |
| 5 | Asbestos-related assets at 31 March 2016 and 2015 are US$619.8 million and US$657.3 million, respectively, and are included in the General Corporate costs. |
| 6 | Included in the Asia Pacific Fiber Cement segment for the year ended 31 March 2016 was a gain on the sale of the Australian Pipes business of US$1.7 million. |
| 7 | Included in the Asia Pacific Fiber Cement segment are adjustments to the provision for New Zealand weathertightness claims. |
| Years Ended 31 March | ||||||||||||
| (Millions of US dollars) | 2016 | 2015 | 2014 | |||||||||
| New Zealand weathertightness claims (expense) / benefit |
$ | (0.5) | $ | 4.3 | $ | (1.8) | ||||||
Concentrations of Risk
The distribution channels for the Company’s fiber cement products are concentrated. If the Company were to lose one or more of its major customers, there can be no assurance that the Company will be able to find a replacement. Therefore, the loss of one or more customers could have a material adverse effect on the Company’s consolidated financial position, results of operations and cash flows.
We have one customer who contributes greater than 10% of our net sales in each of the past three fiscal years.
This customer’s accounts receivable represented 8.1% and 6.4% of the Company’s trade accounts receivable at 31 March 2016 and 2015, respectively. The following is gross sales generated by this customer, which is from the North America and Europe Fiber Cement segment:
| Years Ended 31 March | ||||||||||||||||||||||||
| (Millions of US dollars) | 2016 | 2015 | 2014 | |||||||||||||||||||||
| % | % | % | ||||||||||||||||||||||
| Customer A |
$ | 197.0 | 10.1 | % | $ | 177.4 | 10.7 | % | $ | 174.2 | 11.7 | % | ||||||||||||
|
|
|
|
|
|
|
|||||||||||||||||||
Approximately 22%, 25% and 27% of the Company’s net sales in fiscal year 2016, 2015 and 2014, respectively, were derived from outside the United States. Consequently, changes in the value of foreign currencies could significantly affect the consolidated financial position, results of operations and cash flows of the Company’s non-US operations on translation into US dollars.
| James Hardie Industries plc – Notes to Consolidated Financial Statements (Continued) | 168 |
19. Accumulated Other Comprehensive Income (Loss)
During the year ended 31 March 2016, there was US$0.3 million reclassifications out of Accumulated other comprehensive income (loss) related to pension and post-retirement adjustments.
| (Millions of US dollars) | Pension and Post-Retirement Benefit |
Cash Flow Hedges |
Foreign Currency Translation |
Total | ||||||||||||
| Balance at 31 March 2015 |
$ | (0.3) | $ | 0.3 | $ | (0.4) | $ | (0.4) | ||||||||
| Other comprehensive loss before reclassifications |
- | - | 0.9 | 0.9 | ||||||||||||
| Pension and post-retirement benefit adjustments |
0.3 | - | - | 0.3 | ||||||||||||
|
|
|
|
|
|
|
|
|
|||||||||
| Net current-period other comprehensive income |
0.3 | - | 0.9 | 1.2 | ||||||||||||
|
|
|
|
|
|
|
|
|
|||||||||
| Balance at 31 March 2016 |
$ | - | $ | 0.3 | $ | 0.5 | $ | 0.8 | ||||||||
|
|
|
|
|
|
|
|
|
|||||||||
| James Hardie 2016 Annual Report on Form 20-F | 169 |
REMUNERATION OF INDEPENDENT REGISTERED PUBLIC ACCOUNTING FIRM
(UNAUDITED, NOT FORMING PART OF THE CONSOLIDATED FINANCIAL STATEMENTS)
Fees billed for each of the last three fiscal years for professional services provided by our independent registered public accounting were as follows:
| US$ Millions | ||||||||||||
| Description of Service | FY16 | FY15 | FY14 | |||||||||
| Audit fees1 |
$ | 3.7 | $ | 3.9 | $ | 3.1 | ||||||
| Audit-related fees2 |
- | 0.1 | - | |||||||||
| Tax fees |
- | - | - | |||||||||
| All other fees |
$ | - | $ | - | $ | - | ||||||
| 1 | Audit Fees include the aggregate fees for professional services rendered by our independent registered public accounting firm. Professional services include the audit of our annual financial statements and services that are normally provided in connection with statutory and regulatory filings. |
| 2 | Audit-Related Fees include the aggregate fees billed for assurance and related services rendered by our independent registered public accounting firm. Our independent registered public accounting firm did not engage any temporary employees to conduct any portion of the audit of our consolidated financial statements for the fiscal years ended 31 March 2016, 2015 and 2014. |
Audit Committee Pre-Approval Policies and Procedures
In accordance with our Audit Committee’s policy and the requirements of the law, all services provided by our independent registered public accounting firm are pre-approved from time to time by the Audit Committee. Pre-approval includes a list of specific audit and non-audit services in the following categories: audit services, audit-related services, tax services and other services. Any additional services that we may ask our independent registered public accounting firm to perform will be set forth in a separate document requesting Audit Committee approval in advance of the service being performed.
All of the services pre-approved by the Audit Committee are permissible under the SEC’s auditor independence rules. To avoid potential conflicts of interest, the law prohibits a publicly traded company from obtaining certain non-audit services from its independent registered public accounting firm. We obtain these services from other service providers as needed.
| James Hardie 2016 Annual Report on Form 20-F | 170 |
Our business, operations and financial condition are subject to various risks and uncertainties. We have described below significant factors that may adversely affect our business, operations, financial performance and condition or industry. Readers should be aware that the occurrence of any of the events described in these risk factors, elsewhere in or incorporated by reference into this Annual Report, and other events that we have not predicted or assessed, could have a material adverse effect on our financial position, liquidity, results of operations and cash flows.
Risks Related to Our Business
Our business is dependent on the residential and commercial construction markets.
Demand for our products depends in large part on the residential construction markets and, to a lesser extent, on commercial construction markets. The level of activity in residential construction markets depends on new housing starts and residential remodeling projects, which are a function of many factors outside our control, including general economic conditions, the availability of financing, mortgage and other interest rates, inflation, household income and wage growth, unemployment, the inventory of unsold homes, the level of foreclosures, home resale rates, housing affordability, demographic trends, gross domestic product growth and consumer confidence in each of the countries and regions in which we operate.
Any slowdown in the markets we serve could result in decreased demand for our products and cause us to experience decreased sales and operating income. In addition, deterioration or continued weaknesses in general economic conditions, such as higher interest rates, high levels of unemployment, restrictive lending practices and increased foreclosures, could have a material adverse effect on our financial position, liquidity, results of operations and cash flows.
Substantial and increasing competition in the building products industry could materially adversely affect our business.
Competition in the building products industry is based largely on price, quality, performance and service. Our fiber cement products compete with products manufactured from natural and engineered wood, vinyl, stucco, masonry, gypsum and other materials, as well as fiber cement products offered by other manufacturers. Some of our competitors may have greater product diversity, greater financial and other resources, and better access to raw materials than we do and, among other factors, may be less affected by reductions in margins resulting from price competition.
Increased competition in any of the markets in which we compete would likely cause pricing pressures in those markets. Any of these factors could have a material adverse effect on our financial position, liquidity, results of operations and cash flows.
| James Hardie 2016 Annual Report on Form 20-F | 171 |
We may experience unforeseen delays and/or cost overruns in our planned capital expenditures in future periods, and such delays and/or cost overruns could result in additional expenses and impairment of the carrying value of our assets in future periods. Such unforeseen delays, cost overruns or asset impairment charges could have a material adverse effect on our business.
We are expanding production capacity in anticipation of the continued improvement of the operating environment. We incurred significant capital expenditures in fiscal years 2015 and 2014, and we expect to incur significant capital expenditures again in future periods on facility upgrades and expansions, equipment to ensure regulatory compliance and the implementation of new fiber cement technologies.
We may incur unforeseen delays and/or cost overruns due to a variety of factors, including, but not limited to, an overall decline in general economic conditions, a downturn in the principal markets in which we operate, the entrance of a key competitor leading to a loss in market share or an adverse change in the regulatory environment impacting our business. Any one or combination of these or other factors could have a significant adverse effect on the nature, timing, extent and amount of our planned capital expenditures, and may also result in potential additional expenses and a write-down in the carrying value of our capital projects and other existing production assets. Such delays, cost overruns and asset impairment charges could have a material adverse effect on our financial position, results of operations and liquidity.
As a result of the factors discussed above, we may not achieve the levels of additional manufacturing capacity we have forecasted for our plants. We cannot provide assurances that these additional manufacturing capacities will be achieved or that the related projects will be completed as anticipated or at all. These projections are based on our current estimates, but they involve risks, uncertainties, assumptions and other factors that may cause actual results to be materially different from our estimates. Neither our independent auditors nor any other independent auditors have examined, compiled or performed any procedures with respect to these projections, nor have they expressed any opinion or any other form of assurance on such information or their achievability. Although management believes these estimates and the assumptions underlying them to be reasonable, they could be inaccurate and investors should not place undue reliance upon them.
Regulatory action and continued scrutiny may have an adverse effect on our business.
Our compliance with laws and regulations can be subject to future government review and interpretation. If we fail to comply with applicable laws and regulations, we could be subject to fines, penalties, or other legal liability. Also, should these laws and regulations be amended or expanded, or should new laws and regulations be enacted, we could incur additional compliance costs or restrictions on our ability to manufacture our products and operate our business. Furthermore, our failure to comply with such laws and regulations could result in additional costs, fees or reporting requirements, as well as significant regulatory action, including fines, penalties and legal defense costs, and could subject us to negative publicity. Such actions could have a material adverse effect on our financial position, results of operations and cash flows.
| James Hardie 2016 Annual Report on Form 20-F | 172 |
Our Irish residency could also result in increased negative publicity related to us. There continues to be negative publicity regarding, and criticism of, companies that have subsidiaries which conduct substantial business in the United States but are domiciled in foreign countries. We cannot assure you that we will not be subject to similar criticism. We previously have been the subject of negative publicity as a result of our historic operations and legacy issues in Australia, which we believe has in the past negatively impacted our business and results of operations.
We believe that any such adverse action or negative publicity could materially adversely affect our financial position, liquidity, results of operations and cash flows, employee morale and the market prices of our publicly traded securities.
We are subject to risks generally associated with companies that operate in a global environment, which could have an adverse effect on our growth and financial performance.
Our operations are subject to risks inherent in multinational operations. These risks include, among others, compliance with a variety of local regulations and laws, changes in tax laws and the interpretations of those laws, fluctuation in currency values, sudden changes in foreign currency exchange controls, discriminatory and conflicting fiscal policies, difficulties enforcing intellectual property and contractual rights in certain jurisdictions, greater risk of uncollectable accounts and longer collection cycles, effective and immediate implementation of control environment processes across our diverse operations, compliance with applicable anti-corruption laws and imposition of more or new tariffs, quotas, trade barriers, export controls, sanctions, and/or similar restrictions in the various jurisdictions in which we operate.
Moreover, political and economic changes or volatility, geopolitical regional conflicts, terrorist activity, political unrest, civil strife, acts of war, public corruption and other economic or political uncertainties could interrupt and have an adverse effect on our business operations. All of these factors could result in increased costs or decreased revenues, and could have an adverse effect on our product sales, business, financial condition and/or results of operations.
Because we have significant operations outside the United States and report our earnings in US dollars, unfavorable fluctuations in currency values and exchange rates could have a material adverse effect on our business.
Because our reporting currency is the US dollar, our non-US operations face the additional risk of fluctuating currency values and exchange rates. Such operations may also face hard currency shortages and controls on currency exchange. Approximately 22%, 25% and 27% of our net sales in fiscal years 2016, 2015 and 2014, respectively, were derived from sales outside the United States. Consequently, changes in the value of foreign currencies (principally Australian dollars, New Zealand dollars, Philippine pesos, euros, UK pounds and Canadian dollars) could have a material adverse effect on our business, results of operations and financial condition. We evaluate and consider foreign exchange risk mitigation by entering into contracts that require payment in local currency, hedging transactional risk, where appropriate, and having non-US operations borrow in local currencies. We enter into such financial instruments from time to time to manage our foreign exchange risks, and had material foreign exchange contracts outstanding at 31 March 2016 to purchase €0.4 million. There can be no assurance that we will be successful in these mitigation strategies, or that fluctuation in foreign currencies and other foreign exchange risks will not have a material adverse effect on our financial position, liquidity, results of operations and cash flows.
| James Hardie 2016 Annual Report on Form 20-F | 173 |
If payouts for product liability claims resulting from allegations of product defects exceed our insurance coverage, these payouts could result in a material adverse effect on our business.
The actual or alleged existence of defects in any of our products could subject us to significant product liability or recall claims, including potential putative class or representative action claims. Although we do not have insurance coverage for damage to, or defects in, our products, we do have product liability insurance coverage for bodily injury or property damage which may arise from the use of our products. Although we believe this coverage is adequate and we intend to maintain this coverage in the future, we cannot assure you that this coverage will be sufficient to cover all future product liability claims or that this coverage will be available at reasonable rates in the future. In some jurisdictions, we are subject to joint and several liability. The successful assertion of one or more claims against us, or a co-defendant, that exceed our insurance coverage could require us to incur significant expenses to pay these damages. These additional expenses could have a material adverse effect on our financial position, liquidity, results of operations and cash flows.
Warranty claims relating to our products and exceeding our warranty reserves could have a material adverse effect on our business.
We have offered, and continue to offer, various warranties on our products, including offering a prorated 50-year limited warranty until 2009 at which time we offered a non-prorated 30-year limited warranty for certain of our fiber cement siding products in the United States. In total, as of 31 March 2016, we have accrued US$45.3 million for such warranties within “Accrued product warranties” on our consolidated balance sheets and have disclosed the movements in our consolidated warranty reserves in Note 10 to our consolidated financial statements in Section 2 of this Annual Report. Although we maintain reserves for warranty-related claims and legal proceedings that we believe are adequate, we cannot assure you that warranty expense levels or the results of any warranty-related legal proceedings will not exceed our reserves. If our warranty reserves are significantly exceeded, the costs associated with such warranties could have a material adverse effect on our financial position, liquidity, results of operations and cash flows.
We may incur significant costs, including capital expenditures, in complying with applicable environmental and health and safety laws and regulations.
In each jurisdiction in which we operate, we are subject to environmental, health and safety laws and regulations governing our operations, including, among other matters: (i) the air, soil, and water quality of our plants; and (ii) the use, handling, storage, disposal and remediation of certain regulated materials currently or formerly used by us or any of our affiliates. Under these laws and regulations, we may be held jointly and severally responsible for the remediation of certain regulated materials at our or our predecessors’ past or present facilities and at third-party waste disposal sites. We may also be held liable for any claims, penalties or fines arising out of human exposure to certain regulated materials or other environmental damage, including damage to natural resources, and our failure to comply with air, water, waste, and other environmental regulations.
In particular, many of our products contain crystalline silica, which can be released in a respirable form in connection with the manufacturing of our fiber cement products or while cutting our fiber
| James Hardie 2016 Annual Report on Form 20-F | 174 |
cement products during installation or demolition. The inhalation of respirable crystalline silica at high and prolonged exposure levels is identified as a carcinogen by certain governmental entities and is associated with certain lung diseases, including silicosis, which has been the subject of extensive tort litigation.
In March 2016, the United States Occupational Safety and Health Administration (“OSHA”) issued a comprehensive final rule revising the permissible exposure limit (“PEL”) for crystalline silica, reducing the PEL applicable to both general industry and construction to 0.050 mg/m3 from 0.1 mg/m3 and 0.25 mg/m3, respectively. The final rule is set to become effective on 23 June 2016 with compliance required by 23 June 2017 for companies in the construction industry. It is possible that the revised OSHA crystalline silica PEL standard could have an impact on our business as a result of increased compliance efforts and associated costs, if any, for our manufacturing operations, as well as those of our business parties (e.g., suppliers, home builders, distributors, installers, etc.); and, as such, the rule change may possibly have a material adverse effect on our financial position, liquidity, results of operations, and cash flows.
The costs of complying with environmental and health and safety laws relating to our operations or the liabilities arising from past or future releases of, or exposure to, certain regulated materials, greenhouse gases, or product liability matters, or our failure to comply with air, water, waste, and other then-existing environmental regulations may result in us making future expenditures that could have a material adverse effect on our financial position, liquidity, results of operations and cash flows. Such regulations and laws may increase the cost to procure energy or other products necessary to our operation, thereby increasing our operating costs. In addition, we cannot make any assurances that the laws currently in place that directly or indirectly relate to environmental liability will not change. If, for example, applicable laws or judicial interpretations related to successor liability or “piercing the corporate veil” were to change, such changes could have a material adverse effect on our financial position, liquidity, results of operations and cash flows.
We may experience adverse fluctuations in the supply and cost of raw materials and energy supply necessary to our business, which could have a material adverse effect on our business.
Cellulose fiber (wood-based pulp), silica, cement and water are the principal raw materials used in the production of fiber cement, and the availability and cost of such raw materials are critical to our operations. Our fiber cement business periodically experiences fluctuations in the supply and costs of raw materials, and some of our supply markets are concentrated. In fiscal year 2016, the average Northern Bleached Softwood Kraft (“NBSK”) pulp market price relative to our US business was US$959 per ton, a decrease of 6% compared to fiscal year 2015.
Price fluctuations or material delays may occur in the future due to lack of raw materials, suppliers, or supply chain disruptions. The loss or deterioration of our relationship with a major supplier, an increase in demand by third parties for a particular supplier’s products or materials, delays in obtaining materials, or significant increases in fuel and energy costs could have a material adverse effect on our financial position, liquidity, results of operations and cash flows.
| James Hardie 2016 Annual Report on Form 20-F | 175 |
Demand for our products is subject to changes in consumer preference.
The continued development of builder and consumer preference for our fiber cement products over competitive products is critical to sustaining and expanding demand for our products. Therefore, a failure to maintain and increase builder and consumer acceptance of our fiber cement products could have a material adverse effect on our growth strategy, as well as our financial position, liquidity, results of operations and cash flows.
We rely on only a few customers to buy our fiber cement products and the loss of any major customer could materially adversely affect our businesses.
We have one customer who contributes greater than 10% of our net sales in one or all of the past three fiscal years. This customer’s accounts receivable represented 8.1% and 6.4% of our trade accounts receivable at both 31 March 2016 and 2015, respectively. We generally do not have long-term contracts with our large customers. Accordingly, if we were to lose one or more of our large customers because our competitors were able to offer customers more favorable pricing terms or for any other reason, we may not be able to replace customers in a timely manner or on reasonable terms. The loss of one or more of our large customers could have a material adverse effect on our financial position, liquidity, results of operations and cash flows.
Our ability to sell our products in certain markets is influenced by building codes and ordinances in effect in the related localities and states and may limit our ability to compete effectively in certain markets and our ability to increase or maintain our current market share for our products.
Most states and localities in the markets in which we sell our products maintain building codes and ordinances that determine the requisite qualities of materials that may be used to construct homes and buildings for which our products are intended. Our products may not qualify under building codes and ordinances in certain markets, prohibiting our customers from using our products in those markets. This may limit our ability to sell our products in certain markets. In addition, ordinances and codes may change over time which may, from the time they are implemented, prospectively limit or prevent the use of our products in those markets, causing us to lose market share for our products. Although we keep up to date on the current and proposed building codes and ordinances of the markets in which we sell or plan to sell our products and, when appropriate, seek to become involved in the ordinance and code setting process, our efforts may be ineffective, which would have a material adverse effect on our financial condition, liquidity, results of operations and cash flows.
Our financial performance could be impacted by a customer’s inability to pay amounts owed.
Our financial performance is dependent on our customers within the building products industry. Our customers’ businesses are impacted by the current economic environment, conditions in the capital and credit markets and customer demand for their products and services. If any of our largest customers or a substantial number of smaller customers are adversely affected by these conditions, if we become aware of information related to the creditworthiness of a major customer, or if future actual default rates on receivables in general differ from those currently anticipated, we
| James Hardie 2016 Annual Report on Form 20-F | 176 |
may have to adjust the reserves for uncollectible receivables, which could have a material adverse effect on our financial position, liquidity, results of operations and cash flows.
Our reliance on third-party distribution channels could impact our business.
We offer our products directly and through a variety of third-party distributors and dealers. Changes in the financial or business condition of these distributors and dealers could subject us to losses and affect our ability to bring our products to market and could have a material adverse effect on our business, financial position, liquidity, results of operations and cash flows. Further, our ability to effectively manage inventory levels at distributor locations may be impaired under such arrangements, which could increase expenses associated with excess and obsolete inventory and negatively impact cash flows.
Changes in, or failure to comply with, the laws, regulations, policies or conditions of any jurisdiction in which we conduct our business could result in, among other consequences, the loss of our assets in such jurisdiction, the elimination of certain rights that are critical to the operation of our business in such jurisdiction, a decrease in revenues or the imposition of additional taxes or other costs.
Because we own assets and manufacture and sell our products internationally, our activities are subject to political, economic, legal and other uncertainties, including:
| • | changing political and economic conditions; |
| • | changing laws and policies; |
| • | the general hazards associated with the assertion of sovereign rights over certain areas in which we conduct our business; and |
| • | laws limiting or conditioning the right and ability of subsidiaries and joint ventures to pay dividends or remit earnings to affiliated companies. |
Although we seek to take applicable laws, regulations and conditions into account in structuring our business on a global basis, changes in, or our failure to comply with, the laws, regulations, policies or conditions of any jurisdiction in which we conduct our business could result in, among other consequences, the loss of our assets in such jurisdiction, the elimination of certain rights that are critical to the operation of our business in such jurisdiction, a decrease in revenues or the imposition of additional taxes. Therefore, any change in laws, regulations, policies or conditions of a jurisdiction could have a material adverse effect on our financial position, liquidity, results of operations and cash flows.
Because our intellectual property and other proprietary information may become publicly available, we are subject to the risk that competitors could copy our products or processes.
Our success depends, in part, on the proprietary nature of our technology, including non-patentable intellectual property, such as our process technology. To the extent that a competitor is able to reproduce or otherwise capitalize on our technology, it may be difficult, expensive or impossible for us to obtain adequate legal or equitable relief. Also, the laws of some foreign countries may not protect our intellectual property to the same extent as do the laws of the United States. In addition to patent protection of intellectual property rights, we consider elements
| James Hardie 2016 Annual Report on Form 20-F | 177 |
of our product designs and processes to be proprietary and confidential and/or trade secrets. To safeguard our confidential information, we rely on employee, consultant and vendor nondisclosure agreements and contractual provisions and a system of internal and technical safeguards to protect our proprietary information. However, any of our registered or unregistered intellectual property rights may be subject to challenge or possibly exploited by others in the industry, which could materially adversely affect our financial position, liquidity, results of operations, cash flows and competitive position.
Unauthorized disclosure of sensitive or confidential information or other cyber security incident may have a material adverse effect on our business, results of operations and financial condition.
We rely on information systems to run most aspects of our business, including manufacturing, sales and distribution, raw material procurement, accounting and managing data and records for employees and other parties. Despite the significant investments we have made to maintain our information systems and the security measures we have in place, our systems and facilities, as well as those of third parties with which we do business, may be vulnerable to security breaches, cyber-attacks, employee theft or misconduct, computer viruses, misplaced or lost data, programming and/or human errors or other similar events. Although we strive to have appropriate security controls in place, prevention of security breaches cannot be assured. Any security breach involving the misappropriation, loss or other unauthorized disclosure of our confidential information, whether by us or by third parties with which we do business, could result in losses, damage to our reputation, risk of litigation, disrupt our operations and have a material adverse effect on our business, results of operations and financial condition. We may be required to expend additional resources to continue to enhance our security measures or to investigate and remediate any security vulnerabilities.
Severe weather, natural disasters and climate change could have an adverse effect on our overall business.
Our plants and other facilities are located in places that could be affected by natural disasters, such as hurricanes, typhoons, cyclones, earthquakes, floods, tornados and others. Natural disasters and widespread adverse climate changes that directly impact our plants or other facilities could materially adversely affect our manufacturing or other operations and, thereby, harm our overall financial position, liquidity, results of operations and cash flows.
In the manufacture of our products, we rely on a continuous and uninterrupted supply of electric power, water and, in some cases, natural gas, as well as the availability of water, waste and emissions discharge facilities. Any future shortages or discharge curtailments of a material nature could significantly disrupt our operations and increase our expenses. We currently do not have backup generators on our sites with the capability of maintaining all of a site’s full operational power needs and we do not have alternate sources of power in the event of a sustained blackout. While our insurance includes coverage for certain “business interruption” losses (i.e., lost profits) and for certain “service interruption” losses, such as an accident at our supplier’s facility, any losses in excess of the insurance policy’s coverage limits or any losses not covered by the terms of the insurance policy could have a material adverse effect on our financial condition. If blackouts interrupt our power supply, we would be temporarily unable to continue operations at the affected
| James Hardie 2016 Annual Report on Form 20-F | 178 |
facilities. Any future material and sustained interruptions in our ability to continue operations at our facilities could damage our reputation, harm our ability to retain existing customers or obtain new customers and could result in lost revenue, any of which could have a material adverse effect on our financial position, liquidity, results of operations and cash flows.
Ineffective internal controls over financial reporting could impact our business and operating results.
The SEC, as directed by Section 404 of the Sarbanes-Oxley Act of 2002, has adopted rules requiring us to include in this Annual Report a report of management on our internal controls over financial reporting that contains an assessment by management of the effectiveness of our internal controls over financial reporting. In addition, our independent registered public accounting firm must report on our internal control over financial reporting. As of 31 March 2016, management concluded that our internal controls over financial reporting are effective. Moreover, as of 31 March 2016, our independent registered public accounting firm was satisfied with our internal controls and the level at which our controls are documented, designed, operated and reviewed. Nonetheless, during the course of future evaluation, documentation and attestation, we may identify deficiencies that we may not be able to remedy in a timely manner. Furthermore, our internal control over financial reporting may not prevent or detect misstatements because of its inherent limitations, including the possibility of human error, the circumvention or overriding of controls, or fraud. If we fail to achieve and maintain the adequacy of our internal controls, we may not be able to conclude that we have effective internal controls, on an ongoing basis, over financial reporting in accordance with the Sarbanes-Oxley Act. Furthermore, effective internal controls over financial reporting are necessary for us to produce reliable financial reports and are important to help prevent fraud. As a result, our failure to achieve and maintain effective internal controls over financial reporting could result in the loss of investor confidence in the reliability of our financial statements, which in turn could harm our business and negatively impact the trading price of securities. Furthermore, even effective internal controls can only provide reasonable assurance with respect to the preparation and fair presentation of financial statements. In addition, we have incurred considerable costs and used significant management time and other resources in our effort to comply with Section 404 and other requirements of the Sarbanes-Oxley Act.
Our use of accounting estimates involves judgment and could impact our financial results.
The preparation of financial statements requires management to make judgments, estimates, and assumptions that affect the reported amounts of assets, liabilities, income, and expenses. Due to the inherent uncertainty in making estimates, actual results reported in future periods may be based upon amounts which differ from those estimates. Estimates, judgments, and assumptions are continually evaluated and are based on historical experience and other factors, including expectations of future events that are believed to be reasonable under the circumstances. The accounting policies deemed critical to our results, based upon materiality and significant judgments and estimates are described in Note 2 to our consolidated financial statements. In addition, as discussed in the notes to our consolidated financial statements, we make certain estimates including decisions related to legal proceedings and warranty reserves. If the judgment, estimates, and assumptions we used in preparing our financial statements are subsequently found to be incorrect, there could be a material impact on our results of operations.
| James Hardie 2016 Annual Report on Form 20-F | 179 |
We may acquire or divest businesses from time to time, and this may materially adversely affect our results of operations and financial condition and may significantly change the nature of the company in which you have invested.
In the past, we have divested business segments. In the future, we may acquire other businesses or sell some or all of our assets or business segments. Any significant acquisition or sale may materially adversely affect our results of operations and financial condition and could change the overall profile of our business. As a result, the value of our shares may decrease in response to any such acquisition or sale and, upon any such acquisition or sale, our shares may represent an investment in a company with significantly different assets and prospects from the Company when you made your initial investment in us.
We are dependent upon our key management personnel for our future success.
Our success is greatly influenced by our ability to attract and retain qualified executives with experience in our market and industry. Our ability to retain executive officers and key management personnel is important to the implementation of our strategy. We could potentially lose the services of any of our senior management personnel due to a variety of factors that could include, without limitation, death, incapacity, personal issues, retirement, resignation, or competing employers. We may fail to attract and retain qualified key management personnel required to continue to operate our business successfully. The unexpected loss of senior management, coupled with our failure to recruit qualified successors, could have a material adverse effect on our business and the trading price of our common stock.
We may not be able to obtain financing in the future, and the terms of any future financings may limit our ability to manage our business. Difficulties in obtaining financings on favorable terms would have a negative effect on our ability to execute our business strategy.
We will need to seek additional capital in the future to refinance or replace existing long term indebtedness. We may also need to seek additional capital in the future to meet current or future business plans, meet working capital needs or for other reasons. There can be no assurance that we will be able to obtain future financings on acceptable terms, if at all. If we are unable to obtain alternative or additional financing arrangements in the future, or if we cannot obtain financing on acceptable terms, we may experience liquidity issues and have to reduce our levels of planned capital expenditures, suspend dividend payments and/or share buy-back programs or take other measures to conserve cash in order to meet future cash flow requirements. Moreover, the terms of any such additional financing may restrict our financial flexibility, including the debt we may incur in the future, or may restrict our ability to manage our business as we had intended.
We have a material amount of indebtedness, which could have a material adverse effect on our financial condition and our ability to obtain financing in the future and to react to changes in our business.
At 31 March 2016, we had approximately US$515.0 million aggregate principal amount of unsecured debt outstanding, which includes US$190.0 million under the unsecured revolving credit facility and US$325.0 million aggregate principal amount of senior unsecured notes due
| James Hardie 2016 Annual Report on Form 20-F | 180 |
15 February 2023 issued by James Hardie International Finance Limited, a wholly owned subsidiary of JHI plc, and no secured debt outstanding. We also had approximately US$310.0 million of availability under our unsecured revolving credit facility at 31 March 2016.
Our amount of debt and our debt service obligations could limit our ability to satisfy our obligations, limit our ability to operate our business and impair our competitive position.
For example, it could:
| • | make it more difficult for us to satisfy our debt service obligations or refinance our indebtedness; |
| • | increase our vulnerability to adverse economic and general industry conditions, including interest rate fluctuations, because a portion of our borrowings are and will continue to be at variable rates of interest; |
| • | require us to dedicate a substantial portion of our cash flow from operations to payments on our debt, which would reduce the availability of our cash flow from operations to fund working capital, capital expenditures or other general corporate purposes; |
| • | limit our flexibility in planning for, or reacting to, changes in our business and industry; |
| • | place us at a disadvantage compared to competitors that may have proportionately less debt; |
| • | limit our ability to obtain additional debt or equity financing due to applicable financial and restrictive covenants in our debt agreements; and |
| • | increase our cost of borrowing. |
We may not be able to generate sufficient cash to service all of our indebtedness and may be forced to take other actions to satisfy our obligations under our indebtedness, which may not be successful.
Our ability to make scheduled payments on or to refinance our debt obligations depends on our financial condition and operating performance, which is subject to prevailing economic and competitive conditions and to certain financial, business and other factors beyond our control. We cannot assure you that we will maintain a level of cash flows from operating activities sufficient to permit us to pay the principal, premium, if any, and interest on our indebtedness. If our cash flows and capital resources are insufficient to fund our debt service obligations, we may be forced to reduce or delay investments and capital expenditures, or to sell assets, seek additional capital or restructure or refinance our indebtedness. These alternative measures may not be successful and may not permit us to meet our scheduled debt service obligations. If our operating results and available cash are insufficient to meet our debt service obligations, we could face substantial liquidity problems and might be required to dispose of material assets or operations to meet our debt service and other obligations. We may not be able to consummate those dispositions or obtain the proceeds that we could realize from them, and these proceeds may not be adequate to meet any debt service obligations then due. Any future refinancing of our indebtedness could be at higher interest rates and may require us to comply with more onerous covenants which could further restrict our business operations.
Our variable rate indebtedness subjects us to interest rate risk, which could cause our debt service obligations to increase significantly.
Borrowings under our unsecured revolving credit facility are at variable rates of interest and expose us to interest rate risk. If interest rates increase, our debt service obligations on such
| James Hardie 2016 Annual Report on Form 20-F | 181 |
variable rate indebtedness would increase even though the amount borrowed remained the same, and our net income and cash flows, including cash available for servicing our indebtedness, would correspondingly decrease. Assuming our unsecured revolving facility was fully drawn, each one percentage point change in interest rates would result in a US$5.1 million change in annual cash interest expense.
Asbestos-Related Risks
Our wholly-owned Australian Performing Subsidiary is required to make payments to a special purpose fund that provides compensation for Australian asbestos-related personal injury and death claims for which certain Former James Hardie Companies are found liable. These payments may affect our ability to grow the Company.
On 21 November 2006, JHI plc, AICF, the NSW Government and the Performing Subsidiary entered into the AFFA to provide long-term funding to AICF, a special purpose fund that provides compensation for Australian asbestos-related personal injury and death claims for which the Former James Hardie Companies are found liable.
We have recorded a gross asbestos liability of US$1,302.2 million in our consolidated financial statements as of 31 March 2016, based on the AFFA governing our anticipated future payments to AICF. The net unfunded AFFA liability, net of tax, was US$766.7 million at 31 March 2016. The initial funding was made to AICF in February 2007 and annual payments are to be made each July, subject to the terms of the AFFA. The amounts of these annual payments are dependent on several factors, including our free cash flow (as defined in the AFFA), actuarial estimations, actual claims paid, operating expenses of AICF and the Annual Cash Flow Cap set forth in the AFFA. From the time AICF was established in February 2007 through the date of this Annual Report, we have contributed A$799.2 million (including interest payments) to the fund. Our obligation to make future payments to AICF continues to be linked under the terms of the AFFA to our long-term financial success, especially our ability to generate net operating cash flow.
As a result of our obligation to make payments under the AFFA, our funds available for capital expenditures (either with respect to our existing business or new business opportunities), repayments of debt, payments of dividends or other distributions have been, and will be, reduced by the amounts paid to AICF, and consequently, our financial position, liquidity and cash flows have been, and will be, reduced or materially adversely affected. Our obligation to make these payments could also affect or restrict our ability to access equity or debt capital markets.
Potential escalation in proven claims made against, and associated costs of, AICF could require the Company to extend the period of time its annual funding payments of up to its obligation of 35% of our free cash flow, as defined in the AFFA, beyond their currently anticipated expiration, which may cause the Company to have to increase our asbestos liability in the future.
The amount of our asbestos liability is based, in part, on actuarially determined, anticipated (estimated) future annual funding payments to be made to AICF on an undiscounted and uninflated basis. Future annual payments to AICF are based on updated actuarial assessments that are to be performed as of 31 March of each year to determine expected asbestos-related
| James Hardie 2016 Annual Report on Form 20-F | 182 |
personal injury and death claims to be funded under the AFFA for the financial year in which the payment is made and the next two financial years. Estimates of actuarial liabilities are based on many assumptions, which may not prove to be correct, and which are subject to considerable uncertainty, since the ultimate number and cost of claims are subject to the outcome of events that have not yet occurred, including social, legal and medical developments, as well as future economic conditions.
If future proven claims are more numerous, the liabilities arising from them are larger than that currently estimated by AICF’s actuary, KPMGA, or if AICF investments decline in value, it is possible that pursuant to the terms of the AFFA, we will be required to pay to AICF our current annual funding payments of up to 35% of our free cash flow, as defined in the AFFA and on which our asbestos liability is based, for an extended period of time. If this occurs, we may be required to increase our asbestos liability, which would be reflected as a charge in our consolidated statements of operations and comprehensive income (loss) at that date. Any such changes to actuarial estimates which require us to increase our asbestos liability could have a material adverse effect on our financial position, liquidity, results of operations and cash flows.
Even though the AFFA has been implemented, we may be subject to potential additional liabilities (including claims for compensation or property remediation outside the arrangements reflected in the AFFA), because certain current and former companies of the James Hardie Group previously manufactured products that contained asbestos.
Prior to 1987, ABN 60, which is now owned and controlled by AICF, manufactured products in Australia that contained asbestos. In addition, prior to 1987, two former subsidiaries of ABN 60, Amaca and Amaba, which are now also owned and controlled by AICF, manufactured products in Australia that contained asbestos. ABN 60 also held shares in companies that manufactured asbestos-containing products in Indonesia and Malaysia, and held minority shareholdings in companies that conducted asbestos-mining operations based in Canada and Southern Africa. Former ABN 60 subsidiaries also exported asbestos-containing products to various countries. AICF is designed to provide compensation only for certain claims and to meet certain related expenses and liabilities, and legislation in New South Wales, Australia in connection with the AFFA seeks to defer all other claims against the Former James Hardie Companies. The funds contributed to AICF will not be available to meet any asbestos-related claims made outside Australia, or claims made arising from exposure to asbestos occurring outside Australia, or any claim for pure property loss or pure economic loss or remediation of property. In these circumstances, it is possible that persons with such excluded claims may seek to pursue those claims directly against us. Defending any such litigation could be costly and time consuming, and consequently, our financial position, liquidity, results of operations and cash flows could be materially adversely affected.
Prior to 1988, a New Zealand subsidiary in the James Hardie Group manufactured products in New Zealand that contained asbestos. In New Zealand, asbestos-related disease compensation claims are managed by the state-run Accident Compensation Corporation (“ACC”). Our New Zealand subsidiary that manufactured products that contained asbestos contributed financially to the ACC fund as required by law via payment of an annual levy while it carried on business. All decisions relating to the amount and allocation of payments to claimants in New Zealand are made by the ACC in accordance with New Zealand law. The Injury Prevention,
| James Hardie 2016 Annual Report on Form 20-F | 183 |
Rehabilitation and Compensation Act 2001 (NZ) bars compensatory damages for claims that are covered by the legislation which may be made against the ACC fund. However, we may be subject to potential liability if any of these claims are found not to be covered by the legislation and are later brought against us, and consequently, our financial position, liquidity, results of operations and cash flows could be materially adversely affected.
Because our revenues are primarily derived from sales in US dollars and the actuarially assessed asbestos liability is recorded in Australian dollars and payments pursuant to the AFFA are made in Australian dollars, we may experience unpredictable volatility in our reported results due to changes in the US dollar (and other currencies from which we derive our sales) compared to the Australian dollar.
Payments pursuant to the AFFA are required to be made to AICF in Australian dollars. In addition, annual payments to AICF include calculations based on various estimates that are denominated in Australian dollars. To the extent that our future obligations exceed Australian dollar cash flows derived from our Australian operations and we do not hedge this foreign exchange exposure, we will need to convert US dollars or other foreign currency into Australian dollars in order to meet our obligations pursuant to the AFFA.
In addition, because our results of operations are reported in US dollars and the asbestos liability is based on estimated payments denominated in Australian dollars, fluctuations in the AUD/USD exchange rate will cause unpredictable volatility in our reported results. For example, during fiscal years 2016, 2015 and 2014, we recorded an unfavorable adjustment of US$2.6 million and favorable adjustments of US$144.7 million and US$97.2 million, respectively, due to fluctuations in the US dollar compared to the Australian dollar.
The AFFA imposes certain nonmonetary obligations.
Under the AFFA, we are also subject to certain nonmonetary obligations that could prove onerous or otherwise materially adversely affect our ability to undertake proposed transactions or pay dividends. For example, the AFFA contains certain restrictions that generally prohibit us from undertaking transactions that would have a material adverse effect on the relative priority of AICF as a creditor, or that would materially impair our legal or financial capacity and that of the Performing Subsidiary, in each case such that we and the Performing Subsidiary would cease to be likely to be able to meet the funding obligations that would have arisen under the AFFA had the relevant transaction not occurred. Those restrictions apply to dividends and other distributions, reorganizations of, or dealings in, share capital which create or vest rights in such capital in third parties, and non-arm’s length transactions. While the AFFA contains certain exemptions from such restrictions (including, for example, exemptions for arm’s-length dealings; transactions in the ordinary course of business; certain issuances of equity securities or bonds; and certain transactions provided certain financial ratios are met and certain amounts of dividends), implementing such restrictions could materially adversely affect our ability to enter into transactions that might otherwise be favorable to us and could materially adversely affect our financial position, liquidity, results of operations and cash flows.
| James Hardie 2016 Annual Report on Form 20-F | 184 |
The AFFA does not eliminate the risk of adverse action being taken against us.
There is a possibility that, despite certain covenants agreed to by the NSW Government in the AFFA, adverse action could be directed against us by one or more of the NSW Government, the government of the Commonwealth, governments of the other states or territories of Australia or any other governments, unions or union representative groups, or asbestos disease groups, with respect to the asbestos liabilities of the Former James Hardie Companies or other current and former companies of the James Hardie Group. Any such adverse action could materially adversely affect our financial position, liquidity, results of operations and cash flows.
The complexity and long-term nature of the AFFA and related legislation and agreements may result in litigation as to their interpretation.
Certain legislation, the AFFA and related agreements, which govern the implementation and performance of the AFFA, are complex and have been negotiated over the course of extended periods between various parties. There is a risk that, over the term of the AFFA, some or all parties may become involved in disputes as to the interpretation of such legislation, the AFFA or related agreements or the terms of the AFFA may change. We cannot guarantee that no party will commence litigation seeking remedies with respect to such a dispute, nor can we guarantee that a court will not order other remedies which may materially adversely affect us.
There is no certainty that the AICF Loan Facility will remain in place for its entire term.
Drawings under the AICF Loan Facility, as described in Note 11 to our consolidated financial statements, are subject to satisfaction of certain specified conditions precedent and the NSW Government (as lender) has the right to cancel the facility, require repayment of money advanced and enforce security granted to support the loan in the various circumstances prescribed in the facility agreement and related security documentation. There are also certain positive covenants given by, and restrictions on the activities of, AICF and the Former James Hardie Companies which apply during the term of the loan. A breach of any of these covenants or restrictions may also lead to cancellation of the facility, early repayment of the loan and/or enforcement of the security. As such, there can be no certainty that the facility will remain in place for its intended term.
If the AICF Loan Facility does not remain in place for its intended term, AICF may experience a short-term funding shortfall. A short-term funding shortfall for AICF could subject us to negative publicity. Such negative publicity could materially adversely affect our financial position, liquidity, results of operations and cash flows, as well as employee morale and the market prices of our publicly traded securities.
We may have insufficient Australian taxable income to utilize tax deductions.
We may not have sufficient Australian taxable income to utilize the tax deductions resulting from the funding payments under the AFFA to AICF. Further, if as a result of making such funding payments we incur tax losses, we may not be able to fully utilize such tax losses in future years of income. Any inability to utilize such deductions or losses could materially adversely affect our financial position, liquidity, results of operations and cash flows.
| James Hardie 2016 Annual Report on Form 20-F | 185 |
Certain AFFA tax conditions may not be satisfied.
Despite ATO rulings for the expected life of the AFFA, it is possible that new (and adverse) tax legislation could be enacted in the future. It is also possible that the facts and circumstances relevant to operation of the ATO rulings could change over the life of the AFFA. We may elect to terminate the AFFA if certain tax conditions are not satisfied for more than 12 months. However, we do not have a right to terminate the AFFA if, among other things, the tax conditions are not satisfied as a result of the actions of a member of the James Hardie Group.
Under certain circumstances, we may still have an obligation to make annual funding payments on an adjusted basis if the tax conditions remain unsatisfied for more than 12 months. If the tax conditions are not satisfied in a manner which does not permit us to terminate the AFFA, our financial position, liquidity, results of operations and cash flows may be materially adversely affected. The extent of this adverse effect will be determined by the nature of the tax condition which is not satisfied.
Risks Related to Ireland
The rules and regulations applying to us as an Irish plc may change.
We became an Irish public limited company in calendar year 2012. As an Irish plc, our board meetings are held in and all strategic decisions are made in Ireland. However, there can be no assurance that Irish or another jurisdiction’s law will not become more restrictive or otherwise disadvantageous to us.
Irish law contains provisions that could delay or prevent a change of control that may otherwise be beneficial to you.
Irish law contains several provisions that could have the effect of delaying or preventing a change of control of our ownership. The Irish Takeover Rules would generally (subject to certain very limited exceptions) require a mandatory cash offer to be made for our entire issued share capital if, because of an acquisition of a relevant interest (including interests held in the form of shares of our common stock, CUFS or ADSs) in such shares, the voting rights of the shares in which a person (including persons acting in concert with that person) holds relevant interests increase: (i) from below 30% to 30% or more; or (ii) from a starting point that is above 30% and below 50%, by more than 0.05% in a 12-month period. However, this prohibition is subject to exceptions, including acquisitions that result from acceptances under a mandatory takeover bid made in compliance with the Irish Takeover Rules. Although the Irish Takeover Rules may help to ensure that no person acquires voting control of us without making an offer to all shareholders, they may also have the effect of delaying or preventing a change of control that may otherwise be beneficial to you. In addition to the operation of the Irish Takeover Rules, we may, from time to time, put in place appropriate retention arrangements to ensure that we retain our key employees during periods of corporate change.
| James Hardie 2016 Annual Report on Form 20-F | 186 |
Our ability to pay dividends and conduct share buy-backs is dependent on Irish law and may be limited in the future if we are not able to maintain sufficient levels of distributable profits.
Under Irish law, in order to pay dividends and/or conduct a buy-back of shares, an Irish company requires sufficient distributable profits which are determined under the Irish Companies Act 2014 and applicable accounting practices generally accepted in Ireland. We believe that our current corporate structure has allowed us to maintain sufficient levels of distributable profits to continue paying dividends in accordance with our publicly disclosed dividend policy, which is updated from time to time, and to conduct share buy-backs. However, transactions or events could cause a reduction in our distributable profits, resulting in our inability to pay dividends on our securities or to conduct share buy-backs, which could have a material adverse effect on the market value of our securities.
Risks Related to Taxation
Our effective income tax rate could increase and materially adversely affect our business.
We operate in multiple jurisdictions and pay tax on our income according to the tax laws of these jurisdictions. Various factors, some of which are beyond our control, determine our effective tax rate. The primary drivers of our effective tax rate are the tax rates of the jurisdictions in which we operate, the level and geographic mix of pre-tax earnings, intra-group royalties, interest rates and the level of debt which gives rise to interest expense on external debt and intra-group debt, extraordinary and non-core items, and the value of adjustments for timing differences and permanent differences, including the non-deductibility of certain expenses, all of which are subject to change and which could result in a material increase in our effective tax rate. Such changes to our effective tax rate could materially adversely affect our financial position, liquidity, results of operations and cash flows.
Exposure to additional tax liabilities due to audits could materially adversely affect our business.
Due to our size and the nature of our business, we are subject to ongoing reviews by authorities in taxing jurisdictions on various tax matters, including challenges to various positions we assert on our income tax and withholding tax returns. We accrue for tax contingencies based upon our best estimate of the taxes ultimately expected to be paid, which we update over time as more information becomes available. Such amounts are included in taxes payable or other non-current liabilities, as appropriate.
We record additional tax expense in the period in which we determine that the recorded tax liability is less than the ultimate assessment we expect. The amounts ultimately paid on resolution of reviews by taxing jurisdictions could be materially different from the amounts included in taxes payable or other non-current liabilities and result in additional tax expense which could materially adversely affect our financial position, liquidity, results of operations and cash flows.
| James Hardie 2016 Annual Report on Form 20-F | 187 |
Tax benefits are available under the US-Ireland Income Tax Treaty to US and Irish taxpayers that qualify for those benefits. Our eligibility for benefits under the US-Ireland Income Tax Treaty is determined on an annual basis and we could be audited by the Internal Revenue Service (“IRS”) for this issue. If during a subsequent tax audit or related process, the IRS determines that we are not eligible for benefits under the US-Ireland Income Tax Treaty, we may not qualify for treaty benefits. As a result, our effective tax rate could significantly increase and we could be subject to a 30% US withholding tax rate on payments of interest, royalties and dividends from our US subsidiaries to our Irish resident subsidiaries.
We believe that interest, royalties and dividends paid by our US subsidiaries to our Irish resident subsidiaries qualify for treaty benefits in the form of reduced withholding tax under the US-Ireland Income Tax Treaty.
We believe that, under the limitation on benefits (“LOB”) provision of the US-Ireland Treaty, no US withholding tax applies to interest or royalties that our US subsidiaries paid to our Irish resident subsidiaries. The LOB provision has various conditions of eligibility for reduced US withholding tax rates and other treaty benefits, all of which we believe are satisfied. If, however, we do not qualify for benefits under the US-Ireland Income Tax Treaty, those interest and royalty payments would be subject to a 30% US withholding tax.
We believe that, under the US-Ireland Income Tax Treaty, a 5% US withholding tax applies to dividends paid by our US subsidiaries to our Irish resident subsidiaries. The LOB provision of the US-Ireland Income Tax Treaty has various conditions of eligibility for reduced US withholding tax rates and other treaty benefits, all of which we believe we have satisfied. If, however, we do not qualify for benefits under the US-Ireland Treaty, dividend payments by our US subsidiaries would be subject to a 30% US withholding rate.
Our eligibility for benefits under the US-Ireland Tax Treaty is determined on an annual basis and we could be audited by the IRS for this issue. If during a subsequent tax audit or related process, the IRS determines that we are not eligible for benefits under the US-Ireland Income Tax Treaty, we may not qualify for treaty benefits. As a result, our effective tax rate could significantly increase beginning in the fiscal year that such determination is made and we could be liable for taxes owing for calendar year 2012 and subsequent periods, which could adversely affect our financial position, liquidity, results of operations and cash flows.
| James Hardie 2016 Annual Report on Form 20-F | 188 |
The Company is involved from time to time in various legal proceedings and administrative actions related to the normal conduct of its business, including general liability claims, putative class and representative action lawsuits and litigation concerning our products and services. Although it is impossible to predict the outcome of any pending legal proceeding, management believes that such proceedings and actions should not, individually or in the aggregate, have a material adverse effect on the Company’s consolidated financial position, results of operations or cash flows, except as they relate to asbestos, tax contingencies, New Zealand weathertightness claims and the matters described in the Other Legal Matters sections below. For further details, see “Section 3” of this Annual Report.
Tax Contingencies
Due to our size and the nature of our business, we are subject to ongoing reviews by taxing jurisdictions on various tax matters. We accrue for tax contingencies based upon our best estimate of the taxes ultimately expected to be paid, which we update over time as more information becomes available. Such amounts are included in taxes payable or other non-current liabilities, as appropriate. If we ultimately determine that payment of these amounts is unnecessary, we reverse the liability and recognize a tax benefit during the period in which we determine that the liability is no longer necessary. We record additional tax expense in the period in which we determine that the recorded tax liability is less than the ultimate assessment we expect.
In fiscal years 2016, 2015 and 2014, we recorded an income tax benefit of US$0.3 million, nil and US$0.3 million, respectively, as a result of the finalization of certain tax audits (whereby certain matters were settled) and the expiration of the statute of limitations related to certain tax positions.
We file income tax returns in various jurisdictions, including Ireland, the United States, Australia, New Zealand, the Philippines and the Netherlands. We are no longer subject to US federal examinations by the IRS for tax years prior to tax year 2013. We are no longer subject to examinations by the Australian Taxation Office for tax years prior to tax year 2012.
New Zealand Weathertightness Claims
Our New Zealand subsidiaries have been and, at times, continue to be joined in a number of construction defect claims in New Zealand that relate to residential buildings (single and multi-family dwellings) and a small number of non-residential buildings, primarily constructed from 1998 to 2004. The claims have often involved multiple parties and alleged that losses were incurred due to excessive moisture penetration of the buildings’ structures. The claims have typically included allegations of poor building design, inadequate certification of plans, inadequate construction review and compliance certification and deficient work by sub-contractors.
We recognize a liability for both asserted and unasserted claims in the period in which the loss becomes probable and estimable. The amount of reasonably possible loss is dependent on a number of factors including, without limitation, the specific facts and circumstances unique to each claim brought against our New Zealand subsidiaries, the existence of any co-defendants involved
| James Hardie 2016 Annual Report on Form 20-F | 189 |
in defending the claim, the solvency of such co-defendants (including the ability of such co-defendants to remain solvent until the related claim is ultimately resolved), the availability of claimant compensation under a government compensation scheme, the amount of loss estimated to be allocable to our New Zealand subsidiaries in instances that involve co-defendants in defending the claim and the extent to which our New Zealand subsidiaries have access to third-party recoveries to cover a portion of the costs incurred in defending and resolving such actions.
We have made a provision for the asserted and unasserted New Zealand weathertightness claims within Other Current Liabilities, with a corresponding estimated receivable for third-party recoveries being recognized within Accounts and Other Receivables.
The estimated loss incorporates assumptions that are subject to the foregoing uncertainties and are principally derived from, but not exclusively based on, historical claims experience together with facts and circumstances unique to each claim. If the nature and extent of claims in future periods differ from the historical claims experience, then the actual amount of loss may be materially higher or lower than estimated losses accrued.
For further information, see Note 14 to our consolidated financial statements in Section 2.
Other Legal Matters
Environmental
Our operations, like those of other companies engaged in similar businesses, are subject to a number of laws and regulations on air, soil and water quality, waste handling and disposal. Our policy is to accrue for environmental costs when it is determined that it is probable that an obligation exists and the amount can be reasonably estimated.
Other Product Liability
As of 31 March 2016, one of our US subsidiaries has been named as a defendant in 13 related lawsuits in nine separate US federal district courts. Each lawsuit has a different set of facts and circumstances; however, the lawsuits all relate to products allegedly manufactured by the subsidiary, raise virtually the same claims and are brought by the same underlying group of plaintiffs’ counsel. In addition to the individually-named plaintiffs, each lawsuit seeks to pursue claims on behalf of a purported but unidentified class of homeowners.
The plaintiffs moved to transfer and consolidate all of the related actions within one federal district court, and their motion was granted in June 2012. However, no class has been certified. We believe we have meritorious defenses to each lawsuit and in opposition to class certification, and intend to vigorously defend the actions.
| James Hardie 2016 Annual Report on Form 20-F | 190 |
Management’s Annual Report on Internal Control Over Financial Reporting
Evaluation of Disclosure Controls and Procedures
We carried out an evaluation, under the supervision and with the participation of management, including our Chief Executive Officer and Chief Financial Officer, of the effectiveness of the design and operation of our disclosure controls and procedures (as defined in Rule 13a-15(e) under the Exchange Act) as of the end of the period covered by this Annual Report. In designing and evaluating our disclosure controls and procedures, our management recognizes that any controls and procedures, no matter how well designed and operated, can provide only reasonable assurance of achieving the desired control objectives and are subject to certain limitations, including the exercise of judgment by individuals, the difficulty in identifying unlikely future events, and the difficulty in eliminating misconduct completely. Based upon that evaluation, our Chief Executive Officer and Chief Financial Officer have concluded that, our disclosure controls and procedures were effective at a reasonable assurance level as of 31 March 2016, to ensure the information required to be disclosed in the reports that we file or submit under the Exchange Act were recorded, processed, summarized and reported within the time periods specified in the rules and forms of the SEC and that such information was accumulated and communicated to our management, including our Chief Executive Officer and Chief Financial Officer, to allow for timely decisions regarding required disclosures.
Management’s Report on Internal Control over Financial Reporting
Management is responsible for establishing and maintaining adequate internal control over financial reporting as defined in Rule 13a-15(f) of the Exchange Act. Because of its inherent limitations, internal control over financial reporting may not prevent or detect all misstatements. Also, projections of any evaluation of effectiveness to future periods are subject to the risk that controls may become inadequate because of changes in conditions, or that the degree of compliance with the policies or procedures may deteriorate.
We assessed the effectiveness of our internal control over financial reporting as of 31 March 2016. In making this assessment, we used the criteria set forth by the Committee of Sponsoring Organizations of the Treadway Commission in Internal Control — Integrated Framework (2013). Based on our assessment using those criteria, we concluded that our internal control over financial reporting was effective as of 31 March 2016.
The effectiveness of our internal control over financial reporting as of 31 March 2016 has been audited by Ernst & Young LLP, an independent registered public accounting firm, as stated in their report below.
Changes in Internal Control over Financial Reporting
There were no changes in our internal controls over financial reporting that occurred during the period covered by this Annual Report that have materially affected, or are reasonably likely to materially affect, our internal control over financial reporting.
| James Hardie 2016 Annual Report on Form 20-F | 191 |
Report of Independent Registered Public Accounting Firm
The Board of Directors and Shareholders of James Hardie Industries plc:
We have audited James Hardie Industries plc’s internal control over financial reporting as of 31 March 2016, based on criteria established in Internal Control—Integrated Framework issued by the Committee of Sponsoring Organizations of the Treadway Commission (2013 framework) (the COSO criteria). James Hardie Industries plc’s management is responsible for maintaining effective internal control over financial reporting, and for its assessment of the effectiveness of internal control over financial reporting included in the accompanying Management’s Annual Report on Internal Control over Financial Reporting. Our responsibility is to express an opinion on the company’s internal control over financial reporting based on our audit.
We conducted our audit in accordance with the standards of the Public Company Accounting Oversight Board (United States). Those standards require that we plan and perform the audit to obtain reasonable assurance about whether effective internal control over financial reporting was maintained in all material respects. Our audit included obtaining an understanding of internal control over financial reporting, assessing the risk that a material weakness exists, testing and evaluating the design and operating effectiveness of internal control based on the assessed risk, and performing such other procedures as we considered necessary in the circumstances. We believe that our audit provides a reasonable basis for our opinion.
A company’s internal control over financial reporting is a process designed to provide reasonable assurance regarding the reliability of financial reporting and the preparation of financial statements for external purposes in accordance with generally accepted accounting principles. A company’s internal control over financial reporting includes those policies and procedures that (1) pertain to the maintenance of records that, in reasonable detail, accurately and fairly reflect the transactions and dispositions of the assets of the company; (2) provide reasonable assurance that transactions are recorded as necessary to permit preparation of financial statements in accordance with generally accepted accounting principles, and that receipts and expenditures of the company are being made only in accordance with authorizations of management and directors of the company; and (3) provide reasonable assurance regarding prevention or timely detection of unauthorized acquisition, use or disposition of the company’s assets that could have a material effect on the financial statements.
Because of its inherent limitations, internal control over financial reporting may not prevent or detect misstatements. Also, projections of any evaluation of effectiveness to future periods are subject to the risk that controls may become inadequate because of changes in conditions, or that the degree of compliance with the policies or procedures may deteriorate.
In our opinion, James Hardie Industries plc maintained, in all material respects, effective internal control over financial reporting as of 31 March 2016 based on the COSO criteria.
We also have audited, in accordance with the standards of the Public Company Accounting Oversight Board (United States), the consolidated balance sheets of James Hardie Industries plc as of 31 March 2016 and 2015, and the related consolidated statements of operations and comprehensive income, changes in shareholders’ equity (deficit), and cash flows for each of the three years in the period ended 31 March 2016, and our report dated 19 May 2016 expressed an unqualified opinion thereon.
/s/ Ernst & Young LLP
Irvine, California
19 May 2016
| James Hardie 2016 Annual Report on Form 20-F | 192 |
During each of the last three fiscal years, we employed the following average number of people:
| Fiscal Years Ended 31 March | ||||||||||||
| 2016 | 2015 | 2014 | ||||||||||
| Fiber Cement United States and Canada |
2,119 | 2,066 | 1,915 | |||||||||
| Fiber Cement Australia |
475 | 480 | 464 | |||||||||
| Fiber Cement New Zealand |
157 | 148 | 141 | |||||||||
| Fiber Cement Philippines |
190 | 182 | 176 | |||||||||
| Pipes Australia1 |
35 | 66 | 63 | |||||||||
| Fiber Cement Europe |
71 | 64 | 58 | |||||||||
| Research & Development, including Technology |
155 | 129 | 133 | |||||||||
| General Corporate |
55 | 43 | 33 | |||||||||
| Total Employees |
3,257 | 3,178 | 2,983 | |||||||||
| 1 | During the first quarter of fiscal year 2016, we completed the sale of our Australian Pipes business. |
As of the end of 31 March 2016, of the 3,257 average number of people employed, approximately 185 employees have their employment conditions determined by collective agreements negotiated with labor unions (approximately 98 and 87 employees in Australia and New Zealand, respectively). Under Australian law, we cannot keep records of union members, as such, it is possible that some of the employees covered by the collective agreements may not be members of a union. Our management believes that we have a satisfactory relationship with these unions and its members and there are currently no ongoing labor disputes. We currently have no employees who are members of a union in the United States.
As a company incorporated under the laws of Ireland, we have listed our securities for trading on the ASX, through CHESS, via CUFS. CUFS are a form of depositary security that represent a beneficial ownership interest in the securities of a non-Australian corporation. Each of our CUFS represents the beneficial ownership of one share of common stock of JHI plc, the legal ownership of which is held by CDN. The CUFS are listed and traded on the ASX under the symbol “JHX.”
We have also listed our securities for trading on the NYSE. We sponsor an ADS program, whereby beneficial ownership of CUFS is represented by ADS. These ADSs trade on the NYSE in the form of American Depositary Receipts (“ADRs”), under the symbol “JHX.” Previously, the beneficial ownership ratio under our ADS program was five CUFS to each ADS; however, effective 18 September 2015, the beneficial ownership ratio was changed to a 1-to-1 CUFS to ADS ratio. Since fiscal year 2015, Deutsche Bank Trust Company Americas (“Deutsche Bank“) has acted as the depository for our ADS program. Unless the context indicates otherwise, when we refer to ADSs, we are referring to ADRs or ADSs and when we refer to our common stock we are referring to the shares of our common stock that are represented by CUFS.
| James Hardie 2016 Annual Report on Form 20-F | 193 |
Trading Markets
Our securities are listed and quoted on the following stock exchanges:
| Common Stock (in the form of CUFS) | Australian Securities Exchange | |
| ADSs | New York Stock Exchange |
We cannot predict the prices at which our shares and ADSs will trade or the volume of trading for such securities, nor can we assure you that these securities will continue to meet the applicable listing requirements of these exchanges.
Price History
The trading prices of JHI plc CUFS and ADSs on the ASX and NYSE, respectively, are as follows:
| 1 | Effective 18 September 2015, the beneficial ownership ratio under our ADS program was changed from five CUFS to each ADS to one CUFS to each ADS. |
| James Hardie 2016 Annual Report on Form 20-F | 194 |
Trading on the Australian Securities Exchange
The ASX is headquartered in Sydney, Australia, with branches located in each Australian state capital. Our CUFS trade on the ASX under the symbol “JHX.” The ASX is a publicly listed company with trading being undertaken by brokers licensed under the Australian Corporations Act. Trading principally takes place between the hours of 10:00 a.m. and 4:00 p.m. Australian Eastern Standard Time on each weekday (excluding Australian public holidays). Settlement of trades in uncertificated securities listed on the ASX is generally effected electronically. This is undertaken through CHESS, which is the clearing and settlement system operated by the ASX.
Trading on the New York Stock Exchange
In the United States, our ADSs trade on the NYSE under the symbol “JHX.” Trading principally takes place between the hours of 9:30 a.m. and 4:00 p.m. Eastern Time on each weekday (excluding US public holidays). All inquiries and correspondence regarding ADSs should be directed to Deutsche Bank, 60 Wall Street, New York, New York 10005, United States. To speak directly to a Deutsche Bank representative, please call 1-212-250-9100. You may also send an e-mail inquiry to [email protected] or visit the Deutsche Bank website at https:\\www.adr.db.com.
Fees and Charges Payable by Holders of our ADSs
The following is a summary of the fee provisions of our deposit agreement with Deutsche Bank. For more complete information regarding our ADS program, investors are directed to read the entire amended deposit agreement, a copy of which has been filed as Exhibit 2.1 and 2.2 to this Annual Report.
| Service | Fees | |
| Issuance of ADSs, including issuances resulting from a distribution of shares or rights or other property | Up to US$0.05 per ADS issued | |
| Cancellation of ADSs | Up to US$0.05 per ADS issued | |
| Distribution of cash dividends or other cash distributions | Up to US$0.05 per ADS issued | |
| Operational and maintenance costs | An annual fee of US $0.05 per ADS held on the applicable record date established by the depositary |
Additionally, under the terms of our deposit agreement, Deutsche Bank is entitled to charge each registered holder the following:
| • | taxes and other governmental charges; |
| • | registration fees as may from time to time be in effect for the registration of transfers of CUFS generally on the CHESS; |
| • | expenses for cable, telex and fax transmissions and delivery services; |
| • | expenses incurred for converting foreign currency into US dollars; |
| James Hardie 2016 Annual Report on Form 20-F | 195 |
| • | fees and expenses incurred in connection with compliance with exchange control regulations and other regulatory requirements applicable to CUFS, deposited securities, ADSs and ADRs; and |
| • | fees and expenses incurred in connection with the delivery or servicing of CUFS on deposit. |
If any tax or other governmental charge becomes payable with respect to any security on deposit, such tax or other governmental charge is payable by the ADS holder to Deutsche Bank. Deutsche Bank may refuse to affect any transfer or withdrawal of a deposited security until such payment is made. Deutsche Bank may withhold any dividends or other distributions or may sell for the account of the ADS holder any part or all of the deposited securities, and may apply such dividends, other distributions, or proceeds of any such sale in payment of such tax or other governmental charge and the ADS holder will remain liable for any deficiency.
Generally, Deutsche Bank collects its fees for delivery and surrender of ADSs directly from investors depositing shares or surrendering ADSs for the purpose of withdrawal or from intermediaries acting for them. Additionally, Deutsche Bank collects fees for making distributions to investors by deducting those fees from the amounts distributed or by selling a portion of distributable property to pay the fees. Deutsche Bank may collect its annual fee for depositary services by deductions from cash distributions or by directly billing investors or by charging the book-entry system of accounts of participants acting for them. Deutsche Bank may generally refuse to provide fee-attracting services until its fees for those services are paid.
As part of its service as depositary, Deutsche Bank has agreed: (i) to arrange for the local custody of the underlying shares and absorb the costs of servicing the same; (ii) to make certain annual reimbursements to us based on a percentage of net revenues collected for ADS issuance and cancellation fees, net of custody costs, which we will use toward investor relations expenses and other expenses related to the maintenance of the ADS program (no reimbursements of this type were paid by Deutsche Bank in fiscal year 2016); (iii) to waive the cost associated with administrative and reporting services under the ADS program, such costs being valued at US$60,000 per year; and (iv) to waive the access charges to www.adr.db.com, such costs being valued at US$10,000 per year. In addition, Deutsche Bank agreed to reimburse or waive certain legal, printing and advertising and promotional costs relative to our transfer of the ADS program from Bank of New York Mellon (US$58,929).
| James Hardie 2016 Annual Report on Form 20-F | 196 |
PURCHASES OF EQUITY SECURITIES BY THE ISSUER AND AFFILIATED PURCHASERS
(Number of shares in millions)
| Period | Total shares (or Units) purchased |
Average price paid per share (or Unit) in US$ |
Total shares purchased as part of publicly announced programs 1 |
Maximum number of shares that may yet be purchased under the programs 1 | ||||
| April 1 - 30, 2015 |
- | - | - | 22.2 | ||||
| May 1 - 20, 2015 |
- | - | - | 22.2 | ||||
| May 21 - 31, 2015 |
- | - | - | 22.3 | ||||
| June 1 - 30, 2015 |
- | - | - | 22.3 | ||||
| July 1 - 30, 2015 |
1.7 | 13.50 | 1.7 | 20.6 | ||||
| August 1 - 31, 2015 |
- | - | - | 20.6 | ||||
| September 1 - 30, 2015 |
- | - | - | 20.6 | ||||
| October 1 - 31, 2015 |
- | - | - | 20.6 | ||||
| November 1 - 30, 2015 |
- | - | - | 20.6 | ||||
| December 1 - 31, 2015 |
- | - | - | 20.6 | ||||
| January 1 - 31, 2016 |
- | - | - | 20.6 | ||||
| February 1 - 28, 2016 |
- | - | - | 20.6 | ||||
| March 1 - 31, 2016 |
- | - | - | 20.6 |
| 1 | During fiscal year 2016, the Company operated two separate share repurchase programs. The first program (the “fiscal year 2015 program”) to repurchase up to 5% of our issued share capital (approximately 22.2 million shares) was announced on 22 May 2014 and expired on 20 May 2015. No shares were repurchased or cancelled under the fiscal year 2015 program. The second program (the “fiscal year 2016 program”) to repurchase up to 5% of our issued share capital (approximately 22.3 million shares) was announced on 21 May 2015 and expired on 21 May 2016. Under the fiscal year 2016 program, we repurchased approximately 1.7 million shares at a cost of US$22.3 million. |
| James Hardie 2016 Annual Report on Form 20-F | 197 |
General
Our corporate domicile is in Ireland and our registered office is located at Europa House, Second Floor, Harcourt Centre, Harcourt Street, Dublin 2, Ireland. We are registered at the Companies Registration Office of the Department of Jobs, Enterprise and Innovation in Dublin, Ireland under number 485719. The following is a summary of the key provisions contained in our current Constitution, which was adopted by shareholders at our 2015 Annual General Meeting.
Key Provisions of Our Constitution
Purpose of the Company
Our main object, which is stated in our Memorandum of Association, is to:
“carry on the businesses of manufacturer, distributor, wholesaler, retailer, service provider, investor, designer, trader and any other business (except the issuing of policies of insurance) which may seem to the Company’s board of directors capable of being conveniently carried on in connection with these objects or calculated directly or indirectly to enhance the value of or render more profitable any of the Company’s property.”
The Memorandum of Association also states that we will have the power to carry on the business of a holding company and co-ordinate the administration, finances and activities of any subsidiary companies or associated companies. Our objects and purposes are set out in Clause 3 of our Memorandum of Association.
We also have the usual powers of an Irish plc. These include the power to borrow, to charge assets, to grant guarantees and indemnities, to incorporate new companies and to acquire existing companies.
Provisions of Our Articles of Association Related to Directors
General and borrowing powers
Our Articles of Association grant the directors a general power to manage the Company, but in some instances, not all, expressly limit the duties of directors. The directors will have the power to exercise all of the powers of the Company that have not been otherwise expressly reserved to the shareholders by Irish Company Law or our Articles of Association. In addition, the directors are also granted certain specific powers by our Articles of Association, including:
| • | the power to delegate their powers to the CEO, any director, any person or persons employed by us or any of our subsidiaries or to a committee of the Board; |
| • | the power to appoint attorneys to act on our behalf; |
| • | the power to borrow money on our behalf and to mortgage or charge our undertaking, property, assets, and uncalled capital as security for such borrowings; and |
| • | the power to do anything that is necessary or desirable for us to participate in any computerized, electronic or other system for the facilitation of the transfer of CUFS or the operation of our registers that may be owned, operated or sponsored by the ASX. |
| James Hardie 2016 Annual Report on Form 20-F | 198 |
The directors’ borrowing powers can be varied by amending the relevant article in accordance with Irish law. This would require a ‘special resolution’ of shareholders (i.e., a resolution which has been passed by not less than 75% of votes cast (in person or by proxy) at a duly convened and quorate general meeting of shareholders).
Under Irish law, directors have certain common law and statutory fiduciary duties. Under the Irish Companies Act 2014, directors must (amongst other things) act in good faith in what the director considers to be the interests of the Irish plc and to act honestly and responsibly in relation to the conduct of the affairs of the Irish plc. Many (but not all) fiduciary duties, which were previously founded under common law, have been given a statutory basis by the Irish Companies Act 2014.
In addition to the powers granted to our directors as outlined above, the table below sets forth a summary of certain other provisions contained within our Articles of Association related to Directors:
| Provision | Details | |
| Power to vote on proposals, arrangements or contracts in which the director is materially interested | The Company’s Articles of Association provide that a director cannot vote on any resolution concerning a matter in which he has, directly or indirectly, an interest which is material or a duty which conflicts or may conflict with the interests of the Company. A director cannot be counted in the quorum present at a meeting in relation to any such resolution on which the director is not entitled to vote.
Under Irish law, directors who have a personal interest in a contract or a proposed contract with the Company are required to declare the nature of their interest at a meeting of the directors of the Company. The Company is required to maintain a register of such declared interests which must be made available for inspection by the shareholders at general meetings. | |
| Power to vote on compensation | The maximum aggregate ordinary remuneration of the non-executive directors is US$2,300,000 per annum and can be increased from time to time by an ordinary resolution. Changes to non-executive director remuneration are recommended by the Remuneration Committee and are approved at a properly convened meeting of the Board (which consists of nine non-executive directors and the CEO).
There is no requirement for our shareholders to approve the remuneration policy. The Company currently intends to continue voluntarily producing a remuneration report.
These provisions are subject to the relevant listing rules of the ASX regarding director remuneration. | |
| Age limit for retirement or non-retirement | Our Articles of Association do not include any provisions regarding the mandatory retirement age of a director. | |
| Number of shares for director’s qualification | No director will require a share qualification in order to act as a director. |
| James Hardie 2016 Annual Report on Form 20-F | 199 |
Issuance of Shares; Pre-emptive Rights
We have been registered with one class of shares; however, our Articles of Association allow for any share to be issued with such rights or restrictions as the shareholders may by ordinary resolution determine.
Shareholders may authorize us (acting through our directors) by special resolution to issue shares in whatever manner on the basis that they will be subsequently redeemed. Once issued, we may cancel redeemed shares or alternatively hold them as treasury shares (which subsequently will be reissued or cancelled).
The Board has the power: (a) to issue shares up to a maximum of our authorized share capital; and (b) to limit or exclude statutory pre-emptive rights in respect of such issue for cash consideration, for a period of up to five years in each case, subject to renewal, by a special resolution of shareholders (which requires the approval of holders of 75% of shares present in person or by proxy and voting at the relevant general meeting) in the case of disapplication of statutory pre-emptive rights, and an ordinary resolution (which requires the approval of holders of a majority of shares present in person or by proxy and voting at the relevant general meeting) in the case of authorizing the board to issue shares.
Our Articles of Association grant these authorizations to the Board, which will expire (unless renewed) on 14 August 2020.
These authorizations are subject to the listing rules of the ASX and NYSE in relation to the issue of new equity securities, which require:
| • | in the case of the ASX, shareholder approval for the issue of equity securities which exceed 15% of the number of equity securities on issue (as determined in accordance with the ASX listing rules and subject to the various exemptions set out therein); and |
| • | in the case of the NYSE, shareholder approval for the issuance of shares that have or will have upon issuance voting power equal to or in excess of 20% of the voting power outstanding before the issuance of such shares (subject to certain exceptions). |
If the Board is at any time not designated as the authorized body for such powers, the shareholders acting by ordinary resolution have the power to issue shares, but only upon the proposal of the Board.
As an Irish company that has listed securities in Australia and the United States, we are subject to applicable legislation regarding insider trading. Generally, Australian law prohibits persons from trading on the basis of information which is not generally available and which, if it were generally available, a reasonable person would expect to have a material effect on the price or value of securities. Similarly, in the United States, persons are prohibited from trading on the basis of material, non-public information. We have adopted an internal code on insider trading consistent with Australian and US laws and regulations.
Repurchase of Shares and Reduction of Capital
Irish law permits us to redeem our shares (provided such shares are redeemable) at any time whether on or off market without shareholder approval. Accordingly, our Articles of Association
| James Hardie 2016 Annual Report on Form 20-F | 200 |
provide that, when we agree to acquire any shares (unless we elect to treat the acquisition as a purchase), it shall be a term of such contract that the relevant shares become redeemable on the entry into of that contract and that completion of that contract shall constitute redemption of the relevant shares. This means that we may acquire our own shares.
In addition, Irish law permits an Irish company and its subsidiaries to make market purchases of the shares of the Irish company on a recognized stock exchange if shareholders of the company have granted the company and/or its subsidiaries a general authority by ordinary resolution to do so. Currently, the Irish Stock Exchange, the NYSE, NASDAQ and the London Stock Exchange are the recognized stock exchanges for this purpose.
As the ASX is not currently a recognized stock exchange for the purposes of Irish law, on- and off-market purchases of our shares (by way of trading CUFS) will only be available to us through their redemption in accordance with the redemption mechanism in our Articles of Association, outlined above, provided we do not treat such acquisition as a purchase.
A redemption or repurchase of shares may only be funded out of distributable reserves or out of the proceeds of a fresh issue of shares for that purpose.
Under Irish Company Law, the Board may determine whether shares that we have repurchased or redeemed will either be held in treasury or cancelled. However, under Irish Company Law, the nominal value of treasury shares held by us may not, at any one time, exceed 10% of the nominal value of our issued share capital.
Unless otherwise required by an Irish plc’s Articles of Association or Irish law, no business other than the appointment of a chairman may be transacted at any general meeting unless at least 5% of Irish plc’s issued share capital is present or represented.
Shareholders Meetings and Voting Rights
Our AGMs will generally be held in Ireland unless shareholder approval, pursuant to an ordinary resolution, is granted at the preceding AGM to hold the following general meeting outside of Ireland. There is no requirement that extraordinary general meetings be held in Ireland. We must hold an AGM in each calendar year and within nine months after the financial year end and we shall announce the date of each AGM no less than 35 business days before such meeting is due to be held. All business that is transacted at an AGM shall be deemed to be special business, except: (1) the consideration of the Company’s statutory financial statements and the report of the directors and the report of the auditors of those statements and that report; (2) the review by the members of the Company’s affairs; (3) the declaration of a dividend (if any) of an amount not exceeding the amount recommended by the directors; (4) the election of directors in the place of those retiring (whether by rotation or otherwise); (5) subject to the relevant provisions of the Irish Companies Act 2014, the appointment or reappointment of the auditors; and (6) the authorization of the directors to approve the remuneration of the auditors.
We shall announce the date of an extraordinary general meeting no less than 35 business days before such meeting is due to be held save in exceptional circumstances where the Board resolves otherwise. An extraordinary general meeting may be convened by (1) the directors of
| James Hardie 2016 Annual Report on Form 20-F | 201 |
their own volition or (2) by directors upon being requested to do so pursuant to Irish Company Law, by one or more persons who alone or together hold 10% of our issued share capital. An extraordinary general meeting must be convened within 21 calendar days after such a request has been made of us by a shareholder (who holds 10% or more of our issued share capital), and the extraordinary general meeting must be held no later than two months after such a request has been made by a shareholder.
One or more persons who alone or together hold at least 10% of our issued share capital may request that the Board call an extraordinary general meeting. In addition, such holders may also request that the Board place a matter on the agenda of any general meeting so long as any such request shall be received by us at least 30 business days before the general meeting to which it relates, at such postal or e-mail address as specified by us for that purpose in the announcement of the general meeting. Such request must be accompanied by stated grounds justifying its inclusion, or a draft resolution, together not to exceed 1,000 words. Such a request will be declined by our Board where: (i) the request is contrary to the Constitution, Irish law or the ASX Listing Rules, or (ii) the time limits specified in the Articles of Association have not been complied with.
Our quorum for general meetings is two or more persons who alone or jointly hold or represent by proxy at least 5% of the Company’s issued share capital and who are entitled to vote upon the business to be transacted.
Our quorum for meetings of a separate class of shareholders is one or more persons who alone or jointly hold or represent by proxy at least 5% in nominal value of the issued shares of the class.
Holders of CUFS and ADSs do not appear on our share register as legal holders of shares. Accordingly, the ability to call an extraordinary general meeting only may be exercised, in the case of holders of CUFS, by providing instructions to the CUFS depositary or by converting their CUFS to shares, and, in the case of holders of ADSs, by converting their ADSs to CUFS and thereafter providing instructions to the CUFS depositary or converting their CUFS to shares.
All shares issued have the right to one vote for each share held on every matter submitted to a vote of the shareholders. CUFS holders are entitled to attend and to speak at our shareholder meetings and can vote at our shareholder meetings:
| • | by instructing CDN, as legal owner of our shares represented by CUFS, how to vote the shares represented by the holder’s CUFS; |
| • | by directing CDN to appoint itself (or another person) as the nominated proxy pursuant to a voting instruction form provided by the Company; or |
| • | by converting the holder’s CUFS into our shares and voting the shares at the meeting, which must be undertaken prior to the meeting. However, in order to sell their shares on the ASX thereafter, it will first be necessary to convert them back to CUFS. |
ADS holders will not be entitled to attend our general meetings of shareholders, but can vote by giving an instruction to Deutsche Bank, as the ADS depositary on how to instruct CDN to vote at a meeting.
| James Hardie 2016 Annual Report on Form 20-F | 202 |
Irish law and our Articles of Association currently do not impose any limitations on the rights of persons who are not residents of Ireland to hold or vote shares, solely as a result of such non-resident status.
Annual Report
Our fiscal year runs from 1 April through 31 March. Irish law requires that our annual accounts must be laid before the shareholders at the AGM within nine months of the balance sheet date and that copies of our financial statements must be sent to the shareholders 21 days before the AGM. We prepare consolidated annual accounts under “modified” US GAAP, which is US GAAP to the extent that it is not inconsistent with Irish Company Law. We will also prepare standalone annual entity accounts under Irish GAAP and lay those accounts before the AGM. The annual accounts will also include report of an independent accountant.
Indemnification
Our Articles of Association provide that our current and former directors, company secretary, employees and persons who may be deemed by our Board to be our agent are indemnified by us for costs, losses and expenses arising out of such person’s exercise of their duties to us. However, under Irish Company Law, this indemnity only binds us to indemnify a current or former director or company secretary where judgment is given in any civil or criminal action in favor of such current or former director or company secretary, or where a court grants relief because the current or former director or company secretary acted honestly and reasonably and ought fairly to be excused. Our Articles of Association apply the same restrictions to employees and persons deemed by our Board to be our agent who are not current or former directors or company secretary.
We have also entered into deeds of access, insurance and indemnity with our directors, company secretary and certain senior employees.
Dividends
Dividends and distributions of assets to shareholders may be declared: (a) in the case of dividends, by the Board; or (b) upon the recommendation of the Board, by an ordinary resolution of shareholders, provided that with respect to dividends or distributions declared pursuant to subsection (b) above, the dividends or distributions may not exceed the amount recommended by the Board.
Dividends and distributions may only be made in-so-far as: (a) we have sufficient distributable profits; and (b) our net assets are not less than the aggregate of called up share capital plus undistributable reserves and the distribution does not reduce our net assets below such aggregate.
If directors so resolve, any dividend that has remained unclaimed for 12 years from the date of its declaration shall be forfeited and cease to remain owing by the Company. The payment by directors of any unclaimed dividend or other moneys payable in respect of a share into a separate account shall not constitute us a trustee in respect thereof. However, it is unlikely that any such
| James Hardie 2016 Annual Report on Form 20-F | 203 |
unclaimed dividends will be forfeited due to the operation of Australian legislation, under which dividends that have been unclaimed for six years are paid to the relevant state authority, through which shareholders can claim a refund of such dividends in the future.
Our Board determines the record dates at which time registered holders of our shares, including CDN issuing CUFS to the ADS depositary, will be entitled to dividends and also sets the payment dates for these dividends. Dividends are declared payable to our shareholders in US dollars. Deutsche Bank, our ADS depositary, receives dividends in US dollars directly from JHI plc on each CUFS dividend payment date and will distribute any dividend to holders of ADSs in US dollars pursuant to the terms of the deposit agreement. Other CUFS holders registered at a dividend record date are paid their dividend on each CUFS dividend payment date in the equivalent amount of Australian dollars, as determined by the prevailing exchange rate shortly after the CUFS dividend record date.
Amendment of Articles of Association
Our Articles of Association may be amended by our shareholders, which include changes to the rights of shareholders, subject to Irish Company Law restrictions, by resolution approved by 75% of the votes cast at a general meeting of shareholders at which at least 5% of our issued share capital is present or represented.
Liquidation Rights
In the event of our liquidation, and after we have paid all debts and liquidation expenses, the excess of any assets shall be distributed among our shareholders in proportion to the capital at the commencement of the winding up which is paid up or credited as paid up on such shares held by our shareholders. As a holding company, our sole material assets will be the capital stock of our subsidiaries.
Limitations on Right to Hold Common Stock
The Irish Takeover Rules regulate takeover and merger transactions, however effected, by which control of a public limited company incorporated in Ireland with a listing of its equity securities on certain specified stock exchanges, including the New York Stock Exchange, may be obtained or consolidated. Control means a holding or aggregate holding of shares carrying 30% or more of the voting rights of a relevant company, irrespective of whether the holding or holdings give de facto control.
The Irish Takeover Rules are statute based. The Irish Takeover Panel is the body that regulates all transactions subject to the Irish Takeover Rules.
Rule 9 of the Irish Takeover Rules states that, except with the consent of the Irish Takeover Panel, when:
| • | any person acquires, whether by a series of transactions over a period of time or not, shares or other securities which (taken together with shares or other securities held or acquired by persons acting in concert) carry 30% or more of the voting rights of a relevant company; or |
| James Hardie 2016 Annual Report on Form 20-F | 204 |
| • | any person, who together with persons acting in concert, holds not less than 30% of the voting rights and such person or any person acting in concert with them acquires, in any period of 12 months, additional shares or other securities of more than 0.05% of the total voting rights of the relevant company, |
such person must extend offers to the holders of any class of equity securities (whether voting or non-voting) and to holders of any class of transferable voting capital in respect of all such equity securities and transferable voting capital.
A single holder (that is, a holder excluding any parties acting in concert with the holder) holding more than 50% of the voting rights of a relevant company is not subject to Rule 9.
The Irish Takeover Rules also contain rules called “Substantial Acquisition Rules” which restrict the speed with which a person may increase their holding of shares and rights over shares to an aggregate of between 15% and 30% of the voting rights of a relevant company. These rules also require accelerated disclosure of acquisitions of shares or rights over shares relating to such holdings.
The Irish Takeover Rules are built on the following general principles that apply to any transaction regulated by such rules:
| • | all holders of the securities of an offeree of the same class must be afforded equivalent treatment; moreover, if a person acquires control of a company, the other holders of securities must be protected; |
| • | the holders of the securities of an offeree must have sufficient time and information to enable them to reach a properly informed decision on the offer; where it advises the holders of securities, the board of the offeree must give its views on the effects of implementation of the offer on employment, conditions of employment and the locations of the offeree’s places of business; |
| • | the board of an offeree must act in the interests of the company as a whole and must not deny the holders of securities the opportunity to decide on the merits of the offer; |
| • | false markets must not be created in the securities of the offeree, of the offeror or of any other company concerned by the offer in such a way that the rise or fall of the prices of the securities becomes artificial and the normal functioning of the markets is distorted; |
| • | an offeror must announce an offer only after ensuring that he or she can fulfill in full any cash consideration, if such is offered, and after taking all reasonable measures to secure the implementation of any other type of consideration; |
| • | an offeree must not be hindered in the conduct of its affairs for longer than is reasonable by an offer for its securities; and |
| • | a substantial acquisition of securities (whether such acquisition is to be effected by one transaction or a series of transactions) shall take place only at an acceptable speed and shall be subject to adequate and timely disclosure. |
Although the Irish Takeover Rules may help to ensure that no person may acquire voting control of us without making an offer to all shareholders, these provisions may also have the effect of delaying or preventing a change in control of the Company.
| James Hardie 2016 Annual Report on Form 20-F | 205 |
Disclosure of Holdings
Under Irish law, a person must notify us in writing within five business days of an acquisition or disposition of shares where:
| • | such person’s interest was below 3% of our issued share capital prior to such acquisition and equals or exceeds 3% after such acquisition; |
| • | such person’s interest was equal to or above 3% of our issued share capital before an acquisition or disposition and increases or decreases through an integer of a percentage as a result of such acquisition or disposition (e.g., from 3.8% to 4.3% or from 5.2% to 4.9%); and |
| • | where such person’s interest was equal to or above 3% of our issued share capital before a disposition and falls below 3% as a result of such disposition. |
Failure of a shareholder to disclose its interests in our shares as described above will result in no right or interest of any kind in respect of that person’s shares being enforceable, whether directly or indirectly, by action or legal proceeding.
In addition, under Irish law, we can, if we have reasonable cause to believe that a person or company has an interest in our shares, require such person or company to confirm that belief (or as the case may be) to indicate whether or not it is the case and to provide certain information in relation to such holdings, including details of his or her interest in our shares and the interests (if any) of all persons having a beneficial interest in the shares. To the extent any such information is made available to us, Irish law requires that we make such information available for inspection to any person upon such person’s request.
If a person fails to respond to us when we make a request for information in the manner described above, we may apply to the High Court of Ireland for an order stating that: (a) any transfer of such shares will be void; (b) such shares will have no voting rights; (c) no further shares will be issued in right of those shares or pursuant to any offer made to the holder thereof; and (d) such shares will not be entitled to any payment from us.
The restrictions described above, whether imposed for a failure to disclose a notifiable interest or for a failure to respond to a request for information, may only be lifted by an order of the High Court of Ireland.
Shareholders are also subject to beneficial ownership reporting disclosure requirements under US securities laws, including the filing of beneficial ownership reports on Schedules 13D and 13G with the SEC. The SEC’s rules require all persons who beneficially own more than 5% of a class of securities registered with the SEC to file either a Schedule 13D or 13G. This filing requirement applies to all holders of our shares of common stock, ADSs or CUFS because our securities have been registered with the SEC. The number of shares of common stock underlying ADSs and CUFS is used to determine whether a person beneficially owns more than 5% of the class of securities. This beneficial ownership reporting requirement applies whether or not the holders are residents of the United States. The determination of whether to file a Schedule 13D or a Schedule 13G depends primarily on the nature of the beneficial owner and the circumstances surrounding the person’s beneficial ownership. A copy of the rules and regulations relating to the reporting of beneficial ownership with the SEC, as well as Schedules 13D and 13G, are available on the SEC’s website at www.sec.gov.
| James Hardie 2016 Annual Report on Form 20-F | 206 |
Company Books of Accounts
The Company is responsible for ensuring that it keeps adequate accounting records. The measures taken by the directors to secure compliance with the Company’s obligation to keep adequate accounting records are the use of appropriate systems and procedures and employment of competent persons. We have appointed a Chief Financial Officer who makes regular reports to the Board and ensures compliance with the requirements of Chapter 2 of Part 6 of the Irish Companies Act 2014. The Company also has a Global Controller, who works closely with the Chief Financial Officer and makes regular reports to our Audit Committee. The accounting records of the Company are kept at its registered office in Ireland.
Other than the contracts that are described elsewhere in this Annual Report, including, without limitation, the AFFA and related agreements, our Unsecured Revolving Credit Facility, the indenture governing our senior unsecured notes, the deposit agreement governing our ADS program, our executive compensation and equity incentive plans and certain material employment contracts described in “Section 1 – Remuneration” and any material contracts that have been entered into in the ordinary course of business, the Company does not have any material contracts otherwise requiring disclosure in this Annual Report.
The European Commission has imposed financial sanctions on a number of countries throughout the world that are suspected of being involved in activities such as terrorism or repression of its citizens. Ireland has given effect to these sanctions through the implementation of regulations and statutory instruments. We do not have any subsidiaries located in countries with imposed financial sanctions by the European Commission. In addition, we do not conduct business or other revenue-generating activities in these countries.
Except for restrictions contained in the regulations or statutory instruments referred to above, there are no legislative or other legal provisions currently in force in Ireland or arising under our Constitution restricting the import or export of capital, including the availability of cash and cash equivalents for use by JHI plc and its wholly owned subsidiaries, or remittances to our security holders not resident in Ireland. In addition, except for restrictions contained in the regulations or statutory instruments referred to above, cash dividends payable in US dollars on our common stock may be officially transferred from Ireland and converted into any other convertible currency.
There are no limitations, either by Irish law or in our Constitution, on the right of non-residents of Ireland to hold or vote our common stock.
The following summarizes the material US and Irish tax consequences of an investment in shares of our common stock. This summary does not address every aspect of taxation relevant to a
| James Hardie 2016 Annual Report on Form 20-F | 207 |
particular investor subject to special treatment under any applicable law and is not intended to apply in all respects to all categories of investors. In addition, except for the matters discussed under “Irish Taxation”, this summary does not consider the effect of other foreign tax laws or any state, local or other tax laws that may apply to an investment in shares of our common stock. This summary assumes that we will conduct our business in the manner described in this Annual Report. Changes in our organizational structure or the manner in which we conduct our business may invalidate all or parts of this summary. The laws on which this summary is based could change, perhaps with retroactive effect, and any law changes could invalidate all or parts of this summary. We will not update this summary for any law changes after the date of this Annual Report.
This discussion does not bind either the US or Irish tax authorities or the courts of those jurisdictions. Except where outlined below, we have not sought a ruling nor will we seek a ruling of the US or Irish tax authorities about matters in this summary. We cannot assure you that those tax authorities will concur with the views in this summary concerning the tax consequences of the purchase, ownership or disposition of our common stock or that any reviewing judicial body in the United States or Ireland would likewise concur.
Prospective investors should consult their tax advisors regarding the particular tax consequences of acquiring, owning and disposing of shares of our common stock, including the effect of any foreign, state or local taxes.
United States Taxation
The following is a summary of the material US federal income tax consequences generally applicable to “US Shareholders” (as defined below) who beneficially own shares of our common stock and hold the shares as capital assets. For purposes of this summary, a “US Shareholder” means a beneficial owner of our common stock that is: (1) an individual who is a citizen or resident of the United States (as defined for US federal income tax purposes); (2) a corporation or other entity created or organized in or under the law of the United States or any of its political subdivisions; (3) an estate whose income is subject to US federal income taxation regardless of its source; or (4) a trust if (i) a court in the United States can exercise primary supervision over the administration of the trust, and one or more United States persons can control all of the substantial decisions of the trust, or (ii) the trust has in effect a valid election to be treated as a United States person for US federal income tax purposes. If a partnership (including for this purpose any entity treated as a partnership for US federal tax purposes) is a beneficial owner of a share of our common stock, the US federal tax treatment of a partner in the partnership generally will depend on the status of the partner and the activities of the partnership. A holder of our common stock that is a partnership and partners in that partnership should consult their own tax advisers regarding the US federal income tax consequences of holding and disposing of those shares.
This summary does not comprehensively describe all possible tax issues that could influence a current or prospective US Shareholder’s decision to buy or sell shares of our common stock. In particular, this summary does not discuss: (1) the tax treatment of special classes of US Shareholders, like financial institutions, life insurance companies, tax exempt organizations, tax-qualified employer plans and other tax-qualified or qualified accounts, investors liable for the
| James Hardie 2016 Annual Report on Form 20-F | 208 |
alternative minimum tax, dealers in securities, shareholders who hold shares of our common stock as part of a hedge, straddle or other risk reduction arrangement, or shareholders whose functional currency is not the US dollar; (2) the tax treatment of US Shareholders who own (directly or indirectly by attribution through certain related parties) 10% or more of our voting stock; and (3) the application of other US federal taxes, like the US federal estate tax. The summary is based on the Internal Revenue Code (the “Code”), applicable US Department of Treasury regulations, judicial decisions and administrative rulings and practice, all as of the date of this Annual Report.
Treatment of ADSs
For US federal income tax purposes, a holder of an ADS is considered the owner of the shares of stock represented by the ADS. Accordingly, except as otherwise noted, references in this summary to ownership of shares of our common stock includes ownership of the shares of our common stock underlying the corresponding ADSs.
Taxation of Distributions
Subject to the passive foreign investment company rules discussed below, the tax treatment of a distribution on shares of our common stock held by a US Shareholder depends on whether the distribution is from our current or accumulated earnings and profits (as determined under US federal income tax principles). To the extent a distribution is from our current or accumulated earnings and profits, a US Shareholder will include the amount of the distribution in gross income as a dividend. To the extent a distribution exceeds our current and accumulated earnings and profits, a US Shareholder will treat the excess first as a non-taxable return of capital to the extent of the US Shareholder’s tax basis in those shares and thereafter as capital gain. See the discussion of “Capital Gain Rates” below. Notwithstanding the foregoing described treatment, we do not intend to maintain calculations of our current and accumulated earnings and profits. Dividends received on shares of our common stock will not qualify for the inter-corporate dividends received deduction.
Distributions to US Shareholders that are treated as dividends may be subject to a reduced rate of tax under US tax laws. For taxable income years beginning after 31 December 2012, “qualified dividend income” is generally subject to a maximum rate of 20%. “Qualified dividend income” includes dividends received from a “qualified foreign corporation.” A “qualified foreign corporation” includes (1) a foreign corporation that is eligible for the benefits of a comprehensive income tax treaty with the United States that contains an exchange of information program and (2) a foreign corporation that pays dividends with respect to shares of its stock that are readily tradable on an established securities market in the United States. We believe that we are, and will continue to be, a “qualified foreign corporation” and that dividends we pay with respect to our shares will qualify as “qualified dividend income.” To be eligible for the 20% tax rate, a US Shareholder must hold our shares un-hedged for a minimum holding period (generally, 61 days during the 121-day period beginning on the date that is 60 days before the ex-dividend date of the distribution). Although we believe we presently are, and will continue to be, a “qualified foreign corporation,” we cannot guarantee that we will so qualify. For example, we will not constitute a “qualified foreign corporation” if we are classified as a “passive foreign investment company” (discussed below) in either the taxable year of the distribution or the preceding taxable year. In addition, the net
| James Hardie 2016 Annual Report on Form 20-F | 209 |
investment income (including dividend income) of certain taxpayers are subject to an additional 3.8% tax rate.
Distributions to US Shareholders that are treated as dividends are generally considered income from sources outside the United States and, for purposes of computing the limitations on foreign tax credits that apply separately to specific categories of income, foreign source “passive category” income or, in the case of certain holders, “general category” income. In addition, special rules will apply to determine a US Shareholder’s foreign tax credit limitation if a dividend distributed with respect to our shares constitutes “qualified dividend income” (as described above). See the discussion of “Credit of Foreign Taxes Withheld” below.
The amount of any distribution we make on shares of our common stock in foreign currency generally will equal the fair market value in US dollars of that foreign currency on the date a US Shareholder receives it. A US Shareholder will have a tax basis in the foreign currency equal to its US dollar value on the date of receipt and will recognize ordinary US source gain or loss when it sells or exchanges the foreign currency. US Shareholders who are individuals will not recognize gain upon selling or exchanging foreign currency if the gain does not exceed US$200 in a taxable year and the sale or exchange constitutes a “personal transaction” under the Code. The amount of any distribution we make with respect to shares of our common stock in property other than money will equal the fair market value of that property on the date of distribution.
Credit of Foreign Taxes Withheld
Under certain conditions, including a requirement to hold shares of our common stock un-hedged for a certain period, and subject to limitations, a US Shareholder may claim a credit against the US Shareholder’s federal income tax liability for the foreign tax owed and withheld or paid with respect to distributions on our shares. Alternatively, a US Shareholder may deduct the amount of withheld foreign taxes, but only for a year for which the US Shareholder elects to deduct all foreign income taxes. Complex rules determine how and when the foreign tax credit applies, and US Shareholders should consult their tax advisers to determine whether and to what extent they may claim foreign tax credits.
Sale or Other Disposition of Shares
Subject to the passive foreign investment company rules discussed below, a US Shareholder will recognize capital gain or loss on the sale or other taxable disposition of shares of our common stock, equal to the difference between the US Shareholder’s adjusted tax basis in the shares sold or disposed of and the amount realized on the sale or disposition. Individual US Shareholders may benefit from lower marginal tax rates on capital gains recognized on shares sold, depending on the US Shareholder’s holding period for the shares. See the discussion of “Capital Gain Rates” below. Capital losses that do not offset capital gains are subject to limitations on deductibility. The gain or loss from the sale or other disposition of shares of our common stock generally will be treated as income from sources within the United States for foreign tax credit purposes, unless the US Shareholder is a US citizen residing outside the United States and certain other conditions are met.
| James Hardie 2016 Annual Report on Form 20-F | 210 |
Capital Gain Rates
Effective 1 January 2013, long-term capital gains of certain US individual Shareholders are subject to a maximum rate of 20%. In addition, the “net investment income” (including long and short-term capital gain income) of certain taxpayers is subject to an additional tax of 3.8%.
Passive Foreign Investment Company (“PFIC”) Status
Special US federal income tax rules apply to US Shareholders owning capital stock of a PFIC. A foreign corporation will be a PFIC for any taxable year in which 75% or more of its gross income is passive income or in which 50% or more of the average value of its assets is “passive assets” (generally assets that generate passive income or assets held for the production of passive income). For these purposes, passive income excludes certain interest, dividends or royalties from related parties. If we were a PFIC, each US Shareholder would likely face increased tax liabilities upon the sale or other disposition of shares of our common stock or upon receipt of “excess distributions,” unless the US Shareholder elects (1) to be taxed currently on its pro rata portion of our income, regardless of whether the income was distributed in the form of dividends or otherwise (provided we furnish certain information to our shareholders), or (2) to mark its shares to market by accounting for any difference between the shares’ fair market value and adjusted basis at the end of the taxable year by either an inclusion in income or a deduction from income (provided our ADSs, CUFS or common shares satisfy a test for being regularly traded on a qualified exchange or other market). Because of the manner in which we operate our business, we are not, nor do we expect to become, a PFIC.
Controlled Foreign Corporation Status
If more than 50% of either the voting power of all classes of our voting stock or the total value of our stock is owned, directly or indirectly, by citizens or residents of the United States, United States domestic partnerships and corporations or estates or trusts other than foreign estates or trusts, each of which owns 10% or more of the total combined voting power of all classes of our stock entitled to vote, which we refer to as “10-Percent Shareholders,” we could be treated as a Controlled Foreign Corporation (“CFC”), under the Code. This classification would, among other consequences, require 10-Percent Shareholders to include in their gross income their pro rata shares of our “Subpart F income” (as specifically defined by the Code) and our earnings invested in US property (as specifically defined by the Code).
In addition, gain from the sale or exchange of our common shares by a United States person who is or was a 10-Percent Shareholder at any time during the five-year period ending with the sale or exchange is treated as dividend income to the extent of the earnings and profits attributable to the stock sold or exchanged. Under certain circumstances, a corporate shareholder that directly owns 10% or more of our voting shares may be entitled to an indirect foreign tax credit for income taxes we paid in connection with amounts so characterized as dividends under the Code.
US Federal Income Tax Provisions Applicable to Non-United States Holders
A Non-US Holder means a beneficial owner of our common stock that is (1) a non-resident alien of the United States for US federal income tax purposes; (2) a corporation created or organized in
| James Hardie 2016 Annual Report on Form 20-F | 211 |
or under the law of a country, or any of its political subdivisions, other than the United States; or (3) an estate or trust that is not a US Shareholder. A Non-US Shareholder generally will not be subject to US federal income taxes, including US withholding taxes, on any dividends paid on our shares or on any gain realized on a sale, exchange or other disposition of the shares unless the dividends or gain is effectively connected with the conduct by the Non-US Shareholder of trade or business in the United States (and is attributable to a permanent establishment or fixed base the Non-US Shareholder maintains in the United States if an applicable income tax treaty so requires as a condition for the Non-US Shareholder to be subject to US taxation on a net income basis on income related to the common stock). A corporate Non-US Shareholder under certain circumstances may also be subject to an additional “branch profits tax” on that type of income, the rate of which may be reduced pursuant to an applicable income tax treaty. In addition, gain recognized on a sale, exchange or other disposition of our shares by a Non-US Shareholder who is an individual generally will be subject to US federal income taxes if the Non-US Shareholder is present in the United States for 183 days or more in the taxable year in which the sale, exchange or other disposition occurs and certain other conditions are met.
US Information Reporting and Backup Withholding
Dividend payments on shares of our common stock and proceeds from the sale, exchange or redemption of shares of our common stock may be subject to information reporting to the Internal Revenue Service and possible US backup withholding at a current rate of 28%. Backup withholding will not apply to a shareholder who furnishes a correct taxpayer identification number or certificate of foreign status and makes any other required certification or who is otherwise exempt from backup withholding. United States persons who are required to establish their exempt status generally must provide that certification on a properly completed Internal Revenue Service Form W-9 (Request for Taxpayer Identification Number and Certification). Non-US Shareholders generally will not be subject to US information reporting or backup withholding. However, Non-US Shareholders may be required to provide certification of non-US status in connection with payments received in the United States or through certain US related financial intermediaries.
Backup withholding is not an additional tax. Amounts withheld as backup withholding may be credited against a shareholder’s US federal income tax liability, and a shareholder may obtain a refund of any excess amounts withheld under the backup withholding rules by filing the appropriate claim for refund with the Internal Revenue Service and furnishing any required information.
Irish Taxation
The following is a summary of the material Irish tax consequences generally applicable to shareholders who invest in shares of our common stock, who are neither tax resident, nor ordinarily resident in, Ireland. This summary does not contain a detailed description of all of the Irish tax consequences for all shareholders, which depend on that shareholder’s particular circumstances, and should not be a substitute for advice from an appropriate professional adviser in relation to all of the possible tax issues that could influence a prospective shareholder’s decision to acquire shares of our common stock. This summary is based on Irish tax legislation, relevant Irish case law, other Irish Revenue guidance and published opinions and administrative
| James Hardie 2016 Annual Report on Form 20-F | 212 |
pronouncements of the Irish tax authorities, income tax treaties to which Ireland is a party, and such other authorities as we have considered relevant, all as in effect and available as at the date of this Annual Report, any of which may change possibly with retroactive effect.
Treatment of ADSs
In general, for Irish tax purposes, an owner of depositary receipts is considered the owner of the shares of stock represented by depositary receipts. Accordingly, except as otherwise noted, references in this Annual Report to ownership of shares of our common stock includes ownership of the shares underlying the corresponding ADSs.
Irish Dividend Withholding Tax
Distributions made by us to non-Irish resident shareholders will, subject to certain exceptions, be subject to Irish dividend withholding tax at the standard rate of income tax (which is currently 20%) unless you are a shareholder who falls within one of the categories of exempt shareholders referred to below. Where dividend withholding tax applies, we will be responsible for withholding the dividend withholding tax at source. For dividend withholding tax purposes, a dividend includes any distribution made by us to our shareholders, including cash dividends, non-cash dividends and additional shares taken in lieu of a cash dividend.
Dividend withholding tax is not payable where an exemption applies provided that we have received all necessary documentation required by the relevant legislation from our shareholders prior to payment of the dividend.
Certain of our non-Irish tax resident shareholders (both individual and corporate) are entitled to an exemption from dividend withholding tax. In particular, a non-Irish tax resident shareholder is not subject to dividend withholding tax on dividends received from us where the shareholder is:
| • | an individual shareholder resident for tax purposes in either a member state of the EU (apart from Ireland) or in a country with which Ireland has a double tax treaty, and the individual is neither resident nor ordinarily resident in Ireland; |
| • | a corporate shareholder not resident for tax purposes in Ireland nor ultimately controlled, directly or indirectly, by persons so resident and which is resident for tax purposes in either a member state of the EU (apart from Ireland) or a country with which Ireland has a double tax treaty; |
| • | a corporate shareholder that is not resident for tax purposes in Ireland and which is ultimately controlled, directly or indirectly, by persons resident in either a member state of the EU (apart from Ireland) or in a country with which Ireland has a double tax treaty; |
| • | a corporate shareholder that is not resident for tax purposes in Ireland and whose principal class of shares (or those of its 75% parent) is substantially and regularly traded on a recognized stock exchange in either a member state of the EU (including Ireland where the Company trades only on the Irish stock exchange) or in a country with which Ireland has a double tax treaty or on an exchange approved by the Irish Minister for Finance; or |
| • | a corporate shareholder that is not resident for tax purposes in Ireland and is wholly-owned, directly or indirectly, by two or more companies the principal class of shares of each of which is substantially and regularly traded on a recognized stock exchange in |
| James Hardie 2016 Annual Report on Form 20-F | 213 |
| either a member state of the EU (including Ireland where the Company trades only on the Irish stock exchange) or in a country with which Ireland has a double tax treaty or on an exchange approved by the Irish Minister for Finance; and |
| • | provided that, in all cases noted above, the shareholder has made the appropriate non-resident declaration to us prior to payment of the dividend. |
Where the shareholder is not the beneficial owner, we will be required to withhold Irish dividend withholding tax at the standard rate of income tax unless the shareholder is a qualifying intermediary under Irish law and that shareholder has received all necessary documentation required by the relevant legislation, as described above, from the beneficial owner prior to payment of the dividend.
Where our shareholders hold ADSs, they may not be required to submit an appropriate declaration in order to receive dividends without deduction of Irish dividend withholding tax provided their registered address is in the US.
Prior to 31 July 2013, non-resident shareholders who were entitled to an exemption, as outlined above, were generally able to receive dividends without any dividend withholding tax and without the need to complete the aforementioned non-resident declaration forms, pursuant to a waiver we have received from the Irish Revenue authorities. From 31 July 2013, shareholders must complete and send to us a non-resident declaration form in order to avoid Irish dividend withholding tax. If the appropriate declaration is not made, these shareholders will be liable for Irish dividend withholding tax of 20% on dividends paid by us and may not be entitled to offset this tax. In this case, it will be necessary for shareholders to apply for a refund of the withholding tax directly from the Irish Revenue authorities.
Shareholders that do not fulfill the documentation requirements or otherwise do not qualify for one of the withholding tax exemptions outlined above may be able to claim treaty benefits under a double taxation convention. In this regard, where a double taxation convention is in effect between Ireland and the country of residence of a non-resident shareholder, depending on the terms of that double taxation convention, such a non-resident shareholder may be eligible for a full or partial exemption resulting in a lower dividend withholding tax rate than 20%.
For example, under the US-Ireland Treaty, certain US corporate shareholders owning directly at least 10% of our voting power, are eligible for a reduction in withholding tax to 5% with respect to dividends that we pay, unless the shares of common stock held by such residents form part of the business property of a business carried on through a permanent establishment in Ireland. The same exception applies if the beneficial owner of the shares, being a citizen or resident of the United States, performs independent personal services from a fixed base situated in Ireland and the holding of the shares of common stock in respect of which the dividends are paid pertains to such fixed base in Ireland. A shareholder of our common stock, other than an individual, will be ineligible for the benefits of the US-Irish Treaty unless the shareholder satisfies certain tests under the LOB provisions of Article 23 of the US-Ireland Treaty. To prevent so-called dividend stripping, Irish law generally denies the treaty benefit of a reduced dividend withholding tax rate for any dividend paid to a recipient who is not the “beneficial owner” of the dividend.
| James Hardie 2016 Annual Report on Form 20-F | 214 |
Irish Taxes on Income and Capital Gains
Shareholders who are neither tax resident of, nor ordinarily resident in, Ireland should not be subject to any Irish taxes in respect of dividends distributed by us (other than the dividend withholding tax described above) or capital gains realized on the disposition of shares of our common stock unless such shares are used, held or acquired for the purposes of a trade carried on in Ireland through a branch or an agency. An individual who is temporarily a non-resident of Ireland at the time of the disposal may, under anti-avoidance legislation, still be liable to Irish taxation on any chargeable gains realized (subject to the availability of exemptions).
Capital Acquisitions Tax
Irish capital acquisitions tax (“CAT”) applies to gifts and inheritances. Subject to certain tax-free thresholds (which are determined by the relationship between the donor and successor or donee), gifts and inheritances are liable to tax at the rate of 33%. Gifts and inheritances passing between spouses are exempt from CAT.
Where a gift or inheritance is taken under a disposition made on or after 1 December 1999, it will be within the charge of CAT:
| • | to the extent that the property of which the gift or inheritance consists is situated in Ireland at the date of the gift or inheritance; |
| • | where the person making the gift or inheritance is or was resident or ordinarily resident in Ireland at the date of the disposition under which the gift or inheritance is taken; or |
| • | where the person receiving the gift or inheritance is resident or ordinarily resident in Ireland at the date of the gift or inheritance. |
Please note that the charge to CAT in respect of appointments from a discretionary trust can be different and as a result, specific advice should be taken in this regard.
A non-Irish domiciled individual will not be regarded as resident or ordinarily resident in Ireland for CAT purposes on a particular date unless they are resident or ordinarily resident in Ireland on that date and have been resident in Ireland for the five consecutive tax years immediately preceding the year of assessment in which the date falls.
A gift or inheritance of our common stock will be within the charge of CAT, notwithstanding that the person from whom or by whom the gift or inheritance is received is domiciled or resident outside Ireland.
The Estate Tax Convention between Ireland and the United States generally provides for CAT paid on inheritances in Ireland to be credited against US federal estate tax payable in the United States and for tax paid in the United States to be credited against tax payable in Ireland, based on priority rules set forth in the Estate Tax Convention. The Estate Tax Convention does not apply to CAT paid on gifts. Irish domestic legislation also provides for a general relief from double taxation in respect of gifts and inheritances.
| James Hardie 2016 Annual Report on Form 20-F | 215 |
Irish Stamp Duty
Any electronic transfers of shares through the CHESS or the ADR system will be treated as exempt from stamp duty in Ireland. If a shareholder undertakes an off-market transaction involving a transfer of the underlying shares, this will be subject to Irish stamp duty at a rate of 1% of market value or consideration paid, whichever is greater and will not be able to be registered until duly stamped. An off-market transfer of CUFS will also, where evidenced in writing, be subject to the 1% Irish stamp duty. In addition a conversion of shares into CUFS or ADSs or a conversion of CUFS or ADSs into underlying shares will be liable to 1% Irish stamp duty where the conversion is on a sale or in contemplation of a sale. In each case, payment of this stamp duty will be the responsibility of the person receiving the transfer.
Documents Available for Review
We are subject to the reporting requirements of the Exchange Act applicable to “foreign private issuers” and in accordance therewith file reports, including annual reports, and other information with the SEC. Such reports and other information have been filed electronically with the SEC since 4 November 2002. The SEC maintains a site on the Internet, at www.sec.gov, which contains reports and other information regarding issuers that file electronically with the SEC. In addition, such reports may be obtained, upon written request, from our company secretary at our corporate headquarters in Ireland or our Investor Relations department in Australia. Such reports and other information filed with the SEC prior to November 2002 may be inspected and copied at prescribed rates at the public reference facilities maintained by the SEC at 100 F Street N.E., Washington, D.C. 20549, or obtained by written request to our company secretary. Although, as a foreign private issuer, we are exempt from the rules under the Exchange Act prescribing the furnishing and content of proxy statements and annual reports to shareholders and the quarterly reporting requirements of the Exchange Act, we:
| • | furnish our shareholders with annual reports containing consolidated financial statements examined by an independent registered public accounting firm; and |
| • | furnish quarterly reports for the first three quarters of each fiscal year containing unaudited consolidated financial information in filings with the SEC under Form 6-K. |
| James Hardie 2016 Annual Report on Form 20-F | 216 |
QUANTITATIVE AND QUALITATIVE DISCLOSURES ABOUT MARKET RISK
Cash and cash equivalents include amounts on deposit in banks and cash invested temporarily in various highly liquid financial instruments with original maturities of three months or less when acquired.
We have operations in foreign countries and, as a result, are exposed to foreign currency exchange rate risk inherent in purchases, sales, assets and liabilities denominated in currencies other than the US dollar. We also are exposed to interest rate risk associated with our long-term debt, foreign exchange risk relative to our AFFA liability and commodity price risk relative to changes in prices of commodities we use in production.
Periodically, interest rate swaps, commodity swaps and forward exchange contracts are used to manage market risks and reduce exposure resulting from fluctuations in interest rates, commodity prices and foreign currency exchange rates. Our policy is to enter into derivative instruments solely to mitigate risks in our business and not for trading or speculative purposes. There can be no assurance that we will be successful in these mitigation strategies or that fluctuation in interest rates, commodity prices and foreign currency exchange rates will not have a material adverse effect on our financial position, liquidity, results of operations and cash flows.
Foreign Currency Exchange Rate Risk
We have significant operations outside of the United States and, as a result, are exposed to changes in exchange rates which affect our financial position, results of operations and cash flow. In addition, payments to AICF are required to be made in Australian dollars which, because the majority of our revenues are produced in US dollars, exposes us to risks associated with fluctuations in the US dollar/Australian dollar exchange rate. See “Section 3 – Risk Factors” of this Annual Report.
For our fiscal year ended 31 March 2016, the following currencies comprised the following percentages of our net sales, expenses and liabilities:
| US$ | A$ | NZ$ | Other1 | |||||||||||||
| Net sales |
78.0 | % | 13.2 | % | 3.6 | % | 5.2 | % | ||||||||
| Expenses2 |
78.3 | % | 12.7 | % | 3.2 | % | 5.8 | % | ||||||||
| Liabilities (excluding borrowings)2 |
18.0 | % | 78.5 | % | 1.2 | % | 2.3 | % | ||||||||
For our fiscal year ended 31 March 2015, the following currencies comprised the following percentages of our net sales, expenses and liabilities:
| US$ | A$ | NZ$ | Other1 | |||||||||||||
| Net sales |
74.7 | % | 16.2 | % | 3.9 | % | 5.2 | % | ||||||||
| Expenses2 |
77.8 | % | 13.1 | % | 3.2 | % | 5.9 | % | ||||||||
| Liabilities (excluding borrowings)2 |
16.3 | % | 82.4 | % | 0.7 | % | 0.6 | % | ||||||||
| James Hardie 2016 Annual Report on Form 20-F | 217 |
| 1 | Comprised of Philippine pesos and euro. |
| 2 | Liabilities include A$ denominated asbestos liability, which was initially recorded in the fourth quarter of fiscal year 2006. Expenses include cost of goods sold, SG&A expenses, R&D expenses and adjustments to the asbestos liability. See “Section 3 – Risk Factors,” and Note 11 of our consolidated financial statements further information regarding the asbestos liability. |
We purchase raw materials and fixed assets and sell some finished product for amounts denominated in currencies other than the functional currency of the business in which the related transaction is generated. Further, in order to protect against foreign exchange rate movements, we may enter into forward exchange contracts timed to mature when settlement of the underlying transaction is due to occur. As of 31 March 2016, foreign exchange contracts outstanding included contracts to purchase €0.4 million.
As of 31 March 2015, foreign exchange contracts outstanding included contracts to purchase €3.1 million.
For further information, see Note 12 to our consolidated financial statements in Section 2.
Funding Under the AFFA
The Australian dollar to US dollar assets and liabilities rate moved from 1.3096 as of 31 March 2015 to 1.3060 as of 31 March 2016, a 0.3% movement, resulting in a US$2.6 million unfavorable impact on our fiscal year 2016 net income. Assuming that our unfunded net AFFA liability in Australian dollars remains unchanged at A$1,001.5 million and that we do not hedge this foreign exchange exposure, a 10% movement in the Australian dollar to US dollar exchange rate (at the 31 March 2016 exchange rate of 1.3060) would have approximately a US$69.7 million and US$85.2 million favorable or unfavorable impact, respectively, on our net income.
For fiscal year 2015, assuming that our unfunded net AFFA liability in Australian dollars remained unchanged at A$1,064.8 million and that we did not hedge this foreign exchange exposure, a 10% favorable or unfavorable movement in the A$ to US$ exchange rate (at the 31 March 2015 exchange rate of 1.3096) would have had approximately an US$73.9 million and US$90.3 million favorable and unfavorable impact, respectively, on our net income.
Interest Rate Risk
We have market risk from changes in interest rates, primarily related to our revolving credit facilities. As of 31 March 2016 and 2015, our revolving credit facilities were subject to variable interest rates. The interest rate is calculated two business days prior to the commencement of each draw-down period based on the US$ London Interbank Offered Rate (“LIBOR”) plus the bank margin and is payable at the end of each draw-down period. If interest rates increase, our debt service obligations on such variable rate indebtedness would increase even though the amount borrowed remained the same, and our net income and cash flows, including cash available for servicing our indebtedness, would correspondingly decrease. Assuming all loans were fully drawn, each one percentage point change in interest rates would result in a US$5.1 million change in annual cash interest expense under the revolving credit facilities.
| James Hardie 2016 Annual Report on Form 20-F | 218 |
From time to time, we may enter into interest rate swap contracts in an effort to mitigate interest rate risk. As of 31 March 2016, we had interest rate swap contracts with a total notional principal of US$100.0 million and a fair value of US$3.7 million, which is included in Accounts Payable. For all of these interest rate swap contracts, we have agreed to pay the fixed interest rate while receiving the floating interest rate. These contracts were entered into to protect against upward movements in LIBOR and the associated interest the Company pays on its external debt.
At 31 March 2016, we had US$190.0 million outstanding under our credit facilities exposing us to market risk due to changes in the rate at which interest accrues.
At 31 March 2015, we had interest rate swap contracts with a total notional principal of US$125.0 million and a fair value of US$3.1 million, which is included in Accounts Payable. For all of these interest rate swap contracts, we have agreed to pay the fixed interest rate while receiving the floating interest rate. These contracts were entered into to protect against upward movements in LIBOR and the associated interest the Company pays on its external debt.
At 31 March 2015, we had US$75.0 million outstanding under our credit facilities exposing us to market risk due to changes in the rate at which interest accrues.
Commodity Price Risk
We are exposed to changes in prices of commodities used in our operations, primarily associated with energy, fuel and raw materials such as pulp and cement. Pulp has historically demonstrated more price sensitivity than other raw materials that we use in our manufacturing process; however, fiscal year 2016 demonstrated some volatility in other raw materials, largely in the price of freight and utilities such as gas and electricity. These fluctuations were driven by the economic impact of the fluctuating price of oil, driven by the rise of fracking operations across the United States. As a result of the movement in the price of oil, and the wider uncertain economic conditions, we expect that the price of pulp, cement and energy/utility prices will fluctuate in the near future. To minimize the additional working capital requirements caused by rising prices related to these commodities, we have entered into various sourcing arrangements that discount pulp prices in relation to pulp indices and purchase our pulp from several qualified suppliers in an attempt to mitigate price increases and supply interruptions. However, if such commodity prices do not continue to rise, our cost of sales may be negatively impacted due to fixed pricing over the longer-term.
We have assessed the market risk of our core commodities (pulp, cement and silica) and believe that, a +/- 10% change in the average cost of these materials for the year ended 31 March 2016 would have resulted in +/- US$21.3 million or 1.9% impact on our cost of sales for fiscal year 2016.
For fiscal year 2015, we had assessed the market risk of our core commodities (pulp, cement and silica) and believe that, a +/- 10% change in the average cost of these materials for the year ended 31 March 2015 would have resulted in +/- US$21.0 or 1.9% impact on our cost of sales for fiscal year 2015.
| James Hardie 2016 Annual Report on Form 20-F | 219 |
SHARE/CHESS UNITS OF FOREIGN SECURITIES INFORMATION
As of 30 April 2016, JHI plc had 445,580,065 CUFS issued over ordinary shares listed on the ASX and held by CHESS Depositary Nominees Pty Ltd (“CDN”) on behalf of 13,284 CUFS holders. Each CUFS represents the beneficial ownership of one ordinary share and carries the right to one vote. Each CUFS holder can direct CDN on how to vote the ordinary shares on a one vote per CUFS basis. Options and RSU’s issued by the Company carry no voting rights.
At 30 April 2016, to our knowledge, we are not directly or indirectly owned or controlled by another corporation, by a foreign government or by any other natural or legal persons severally or jointly, and we are not aware of any arrangements the operation of which may at a subsequent date result in a change in control of the Company.
Geographic Distribution of Beneficial Ownership of James Hardie Industries plc
The following table shows the geographic distribution of the beneficial holders of our CUFS at 31 March:
| Geographic Region | 31 March 2016 |
31 March 2015 |
||||||
| Australia |
41.22 | % | 38.37 | % | ||||
| United States |
38.74 | % | 39.66 | % | ||||
| United Kingdom |
4.91 | % | 5.94 | % | ||||
| Europe (excluding the United Kingdom) |
4.93 | % | 5.23 | % | ||||
| Asia |
4.51 | % | 3.98 | % | ||||
|
Other |
5.69 | % | 6.82 | % | ||||
As of 30 April 2016, 0.22% of the outstanding shares of our common stock was held by 84 CUFS holders with registered addresses in the United States. In addition, as of 30 April 2016, 1.11% of the outstanding shares of our common stock was represented by ADSs held by three holders, all of whom have registered addresses in the United States. A total of 1.33% of our outstanding capital stock was registered to 87 US holders as of 30 April 2016.
| James Hardie 2016 Annual Report on Form 20-F | 220 |
Distribution Schedule of James Hardie Industries plc
The following table shows a distribution of the holders of our CUFS at 30 April 2016:
| Size of Holding Range | CUFS | Options | ||||||||||||||
| Holders | Holdings | Holders | Holdings | |||||||||||||
| 1-1,000 |
6,873 | 3,140,678 | - | - | ||||||||||||
| 1,001-5,000 |
5,103 | 11,499,886 | 5 | 9,900 | ||||||||||||
| 5,001-10,000 |
748 | 5,330,833 | 4 | 28,031 | ||||||||||||
| 10,001-100,000 |
506 | 11,372,583 | 4 | 66,096 | ||||||||||||
| 100,001 and over |
54 | 414,236,085 | - | - | ||||||||||||
| Totals |
13,284 | 445,580,065 | 13 | 104,027 | ||||||||||||
Based on the closing price of A$18.53 on 30 April 2016, there were 265 CUFS holders that held less than a marketable parcel of shares.
Substantial CUFS holders of James Hardie Industries plc
The following table identifies those CUFS holders who beneficially owned 5% or more of our ordinary shares at 30 April 2016, based on the holdings reported by such CUFS holder in its last shareholder notice filed with JHI plc, as required by applicable law, and their percentage of shares outstanding based on the number of shares outstanding as of 30 April 2016, which was 445,580,065 shares:
| CUFS holder | Shares Beneficially Owned |
Percentage of Shares Outstanding |
||||||
| Commonwealth Bank of Australia1 |
31,858,024 | 7.15 | % | |||||
| FMR LLC and FIL Limited2 |
28,725,671 | 6.45 | % | |||||
| National Australia Bank Limited Group3 |
28,198,184 | 6.33 | % | |||||
|
Baillie Gifford & Co4 |
27,494,368 | 6.17 | % | |||||
| 1 | Commonwealth Bank of Australia (“CBA”) and its affiliates became a substantial shareholder on 11 November 2009, however, CBA’s substantial holding status ceased when its holdings fell below 5% on 14 April 2014. On 2 June 2014, CBA became a substantial shareholder again, but ceased to be a substantial shareholder on 12 June 2014 when its holdings fell below 5%. On 5 August 2014, CBA again became a substantial shareholder; however, it ceased to be a substantial shareholder on 12 August 2014. On 15 August 2014, CBA most recently became a substantial shareholder, and through subsequent sales and purchases, increased its holding to 31,858,024 shares as of 31 December 2015, as reported on a Schedule 13G filed with the SEC on 12 February 2016. |
| 2 | FMR LLC and its affiliates, became a substantial shareholder on 23 July 2009, and through subsequent purchases and sales, decreased its holding to 28,725,671 shares as of 31 December 2015, as reported on a Schedule 13G filed with the SEC on 12 February 2016. |
| 3 | National Australia Bank Limited Group became a substantial shareholder on 25 May 2004, and through subsequent purchases and sales, increased its holding to 28,198,184 shares as of 16 June 2004, as reported on a Form 604 filed with the ASX. |
| 4 | Baillie Gifford & Co and its affiliated companies most recently became a substantial shareholder on 12 November 2009, and through subsequent purchases and sales, decreased its holding to 27,494,368 shares as of 23 December 2015, as reported on a Form 604 filed with the ASX on 29 December 2015. |
| James Hardie 2016 Annual Report on Form 20-F | 221 |
James Hardie Industries plc 20 largest CUFS holders and their holdings as of 30 April 20161
| Name | CUFS Holdings | Percentage | Rank | |||||||||
| HSBC Custody Nominees (Australia) Limited |
150,848,523 | 33.85 | % | 1 | ||||||||
| J P Morgan Nominees Australia Limited |
109,331,710 | 24.54 | % | 2 | ||||||||
| National Nominees Limited |
64,053,079 | 14.38 | % | 3 | ||||||||
| Citicorp Nominees Pty Limited |
29,036,291 | 6.52 | % | 4 | ||||||||
| Citicorp Nominees Pty Limited |
18,073,640 | 4.06 | % | 5 | ||||||||
| BNP Paribas Noms Pty Ltd |
14,726,496 | 3.31 | % | 6 | ||||||||
| AMP Life Limited |
5,457,079 | 1.22 | % | 7 | ||||||||
| BNP Paribas Nominees Pty Ltd |
5,013,017 | 1.13 | % | 8 | ||||||||
| Australian Foundation Investment Company Limited |
2,851,000 | 0.64 | % | 9 | ||||||||
| BNP Paribas Nominees Pty Ltd |
1,230,000 | 0.28 | % | 10 | ||||||||
| HSBC Custody Nominees (Australia) Limited |
716,898 | 0.16 | % | 11 | ||||||||
| Millenium Pty Ltd |
675,000 | 0.15 | % | 12 | ||||||||
| Djerriwarrh Investments Limited |
655,000 | 0.15 | % | 13 | ||||||||
| Carlton Hotel Limited |
625,362 | 0.14 | % | 14 | ||||||||
| RBC Investor Services Australia Nominees Pty Ltd |
625,246 | 0.14 | % | 15 | ||||||||
| HSBC Custody Nominees (Australia) Limited |
609,048 | 0.14 | % | 16 | ||||||||
| Invia Custodian Pty Limited |
533,575 | 0.12 | % | 17 | ||||||||
| Gwynvill Investments Pty Limited |
518,600 | 0.12 | % | 18 | ||||||||
| Gwynvill Trading Pty Limited |
428,000 | 0.10 | % | 19 | ||||||||
|
Sandhurst Trustees Ltd |
425,382 | 0.10 | % | 20 | ||||||||
|
TOTAL |
406,432,946 | 91.21 | % | |||||||||
| 1 | Entities which hold interests in CUFS solely as a nominee or trustee for another person may have those interests disregarded for the purposes of: (i) substantial shareholder / CUFS holder notification provisions; and (ii) the takeover provisions in the Constitution. Such nominees may hold CUFS for holders included in the substantial CUFS holders named in the preceding table. |
| James Hardie 2016 Annual Report on Form 20-F | 222 |
GLOSSARY OF ABBREVIATIONS AND DEFINITIONS
Abbreviations
| 2001 Plan | 2001 Equity Incentive Plan | |
| ADR |
American Depositary Receipt | |
| ADS | American Depositary Share | |
| AFFA |
Amended and Restated Final Funding Agreement, as amended from time to time | |
| AGM | Annual General Meeting | |
| AICF |
Asbestos Injuries Compensation Fund | |
| ASIC | Australian Securities and Investments Commission | |
| ASX |
Australian Securities Exchange | |
| ATO | Australian Taxation Office | |
| CEO |
Chief Executive Officer | |
| CFO | Chief Financial Officer | |
| CHESS |
Clearing House Electronic Subregister System | |
| Commonwealth | The Commonwealth of Australia | |
| CP Plan |
Company Performance Plan | |
| CUFS | CHESS Units of Foreign Securities | |
| EPS |
Earnings Per Share | |
| FASB | Financial Accounting Standards Board | |
| IP Plan |
Individual Performance Plan | |
| IRS | United States Internal Revenue Service | |
| KPMGA |
KPMG Actuarial Pty Limited | |
| LIBOR | London Interbank Offered Rate | |
| LTI |
Long-Term Incentive | |
| LTIP | Long-Term Incentive Plan 2006 | |
| NAHB |
National Association of Home Builders | |
| NBSK | Northern Bleached Softwood Kraft, the Company’s benchmark grade of pulp relative to our US business | |
| NSW |
New South Wales | |
| NYSE | New York Stock Exchange | |
| RSU |
Restricted Stock Unit | |
| SEC | United States Securities and Exchange Commission | |
| STI |
Short-Term Incentive |
| James Hardie 2016 Annual Report on Form 20-F | 223 |
Definitions
Financial Measures – Australian equivalent terminology
The Remuneration Report included in Section 1 of this Annual Report contains financial measures that are considered to be non-US GAAP, but are consistent with those used by Australian companies. Because the Company prepares its consolidated financial statements in accordance with US GAAP, the following table and definitions listing cross-references each US GAAP financial measure as used in the Company’s consolidated financial statements to the equivalent non-US GAAP financial measure, as used in the “Section 1 – Remuneration Report” and associated reconciliations
| Consolidated Statements of Operations and Other Comprehensive Income (Loss) (US GAAP) | Remuneration Report (non US GAAP) | |
| Net sales | Net sales | |
| Cost of goods sold | Cost of goods sold | |
| Gross profit |
Gross profit | |
| Selling, general and administrative expenses | Selling, general and administrative expenses | |
| Research and development expenses | Research and development expenses | |
| Asbestos adjustments | Asbestos adjustments | |
| Operating income (loss) |
EBIT* | |
| Sum of interest expense and interest income | Net interest income (expense)* | |
| Other income (expense) | Other income (expense) | |
| Income (loss) before income taxes |
Operating profit (loss) before income taxes* | |
| Income tax (expense) benefit | Income tax (expense) benefit | |
| Net income (loss) |
Net operating profit (loss)* | |
| *- Represents non-US GAAP descriptions used by Australian companies. | ||
Operating income and Operating income margin – is equivalent to EBIT and EBIT margin
Income before income taxes – is equivalent to operating profit before income taxes
Net income – is equivalent to net operating profit
Other Financial Measures
mmsf – million square feet, where a square foot is defined as a standard square foot of 5/16” thickness
msf – thousand square feet, where a square foot is defined as a standard square foot of 5/16” thickness
| James Hardie 2016 Annual Report on Form 20-F | 224 |
Non-GAAP Financial Information Derived from GAAP Measures
This Annual Report includes certain financial information to supplement the Company’s consolidated financial statements which are prepared in accordance with accounting principles generally accepted in the United States (“US GAAP”). These financial measures are designed to provide investors with an alternative method for assessing our performance from on-going operations, capital efficiency and profit generation. Management uses these financial measures for the same purposes. These financial measures include:
| • | Adjusted operating income; |
| • | Adjusted operating income margin; |
| • | Adjusted net income; |
| • | Adjusted diluted earnings per share; |
| • | Adjusted operating income before income taxes |
| • | Adjusted income tax expense; |
| • | Adjusted effective tax rate; and |
| • | Adjusted selling, general and administrative expenses (“Adjusted SG&A”) |
These financial measures are or may be non-US GAAP financial measures as defined in the rules of the U.S. Securities and Exchange Commission and may exclude or include amounts that are included or excluded, as applicable, in the calculation of the most directly comparable financial measures calculated in accordance with US GAAP. These financial measures are not meant to be considered in isolation or as a substitute for comparable US GAAP financial measures and should be read only in conjunction with the Company’s consolidated financial statements prepared in accordance with US GAAP. In evaluating these financial measures, investors should note that other companies reporting or describing similarly titled financial measures may calculate them differently and investors should exercise caution in comparing the Company’s financial measures to similar titled measures by other companies.
| Fiscal Years Ended 31 March | ||||||||||||
| (Millions of US dollars) | 2016 | 2015 | 2014 | |||||||||
| Operating income |
$ | 354.0 | $ | 335.0 | $ | 53.1 | ||||||
| Asbestos: |
||||||||||||
| Asbestos adjustments |
(5.5) | (33.4) | 195.8 | |||||||||
| AICF SG&A expenses |
1.7 | 2.5 | 2.1 | |||||||||
| New Zealand weathertightness claims |
0.5 | (4.3) | 1.8 | |||||||||
| Non-recurring stamp duty |
- | 4.2 | - | |||||||||
| Adjusted operating income |
350.7 | 304.0 | 252.8 | |||||||||
| Net sales |
$ | 1,728.2 | $ | 1,656.9 | $ | 1,493.8 | ||||||
| Adjusted operating income margin |
20.3% | 18.3% | 16.9% | |||||||||
| James Hardie 2016 Annual Report on Form 20-F | 225 |
| Fiscal Years Ended 31 March | ||||||||||||
| (Millions of US dollars) | 2016 | 2015 | 2014 | |||||||||
| Net income |
$ 244.4 | $ 291.3 | $ 99.5 | |||||||||
| Excluding: |
||||||||||||
| Asbestos: |
||||||||||||
| Asbestos adjustments |
(5.5) | (33.4) | 195.8 | |||||||||
| AICF SG&A expenses |
1.7 | 2.5 | 2.1 | |||||||||
| AICF interest exepnse (income), net |
0.3 | (1.4) | (2.9) | |||||||||
| New Zealand weathertightness claims |
0.5 | (4.3) | 1.8 | |||||||||
| Non-recurring stamp duty |
- | 4.2 | - | |||||||||
| Asbestos and other tax adjustments |
1.5 | (37.5) | (99.1) | |||||||||
| Adjusted net income |
$ 242.9 | $ 221.4 | $ 197.2 | |||||||||
| Fiscal Years Ended 31 March | ||||||||||||
| (Millions of US dollars) | 2016 | 2015 | 2014 | |||||||||
| Adjusted net income |
$ | 242.9 | $ | 221.4 | $ | 197.2 | ||||||
| Weighted average common shares outstanding — Diluted (millions) |
447.2 | 446.4 | 444.6 | |||||||||
| Adjusted diluted earnings per share (US cents) |
54 | 50 | 44 | |||||||||
| Fiscal Years Ended 31 March | ||||||||||||
| (Millions of US dollars) | 2016 | 2015 | 2014 | |||||||||
| Operating Income before income taxes |
$ | 330.5 | $ | 322.6 | $ | 54.6 | ||||||
| Excluding: |
||||||||||||
| Asbestos: |
||||||||||||
| Asbestos adjustments |
(5.5) | (33.4) | 195.8 | |||||||||
| AICF SG&A expenses |
1.7 | 2.5 | 2.1 | |||||||||
| AICF interest expense (income), net |
0.3 | (1.4) | (2.9) | |||||||||
| New Zealand weathertightness claims |
0.5 | (4.3) | 1.8 | |||||||||
| Non-recurring stamp duty |
- | 4.2 | - | |||||||||
| Adjusted Operating Income before income taxes |
327.5 | 290.2 | 251.4 | |||||||||
| Income tax (expense) benefit |
(86.1) | (31.3) | 44.9 | |||||||||
| Asbestos and other tax adjustments |
1.5 | (37.5) | (99.1) | |||||||||
| Adjusted income tax expense |
$ | (84.6) | $ | (68.8) | $ | (54.2) | ||||||
| Effective tax rate |
26.1% | 9.7% | (82.2%) | |||||||||
| Adjusted Effective Tax Rate |
25.8% | 23.7% | 21.6% | |||||||||
| James Hardie 2016 Annual Report on Form 20-F | 226 |
| Fiscal Years Ended 31 March | ||||||||||||
| (Millions of US dollars) | 2016 | 2015 | 2014 | |||||||||
| Selling, general and administrative (“SG&A”) expenses |
$ | 254.2 | $ | 245.5 | $ | 224.4 | ||||||
| Excluding: |
||||||||||||
| New Zealand weathertightness claims benefit (expenses) |
(0.5 | ) | 4.3 | (1.8 | ) | |||||||
| AICF SG&A expenses |
(1.7 | ) | (2.5 | ) | (2.1 | ) | ||||||
| Non-recurring stamp duty |
- | (4.2 | ) | - | ||||||||
| Adjusted SG&A expenses |
252.0 | 243.1 | 220.5 | |||||||||
| Net Sales |
$ | 1,728.2 | $ | 1,656.9 | $ | 1,493.8 | ||||||
| SG&A expenses as a percentage of net sales |
14.7% | 14.8% | 15.0% | |||||||||
| Adjusted SG&A expenses as a percentage of net sales |
14.6% | 14.7% | 14.8% | |||||||||
| James Hardie 2016 Annual Report on Form 20-F | 227 |
| Exhibit Number |
Exhibit Description | Form | File Number | Exhibit | Date | |||||
| 1.1 | Memorandum of Association of James Hardie Industries plc, as amended | 6-K | 001-15240 | 99.9 | 17 August 2015 | |||||
| 1.2 | Articles of Association of James Hardie Industries plc | 6-K | 001-15240 | 99.9 | 17 August 2015 | |||||
| 2.1 | Amended and Restated Deposit Agreement, dated 1 October 2014, by and among James Hardie Industries plc, Deutsche Bank Trust Company Americas, as depositary, and the holders and beneficial owners of American depositary shares evidenced by American depositary receipts issued thereunder | F-6 | 333-198928 | 99.A | 25 September 2014 | |||||
| 2.2 | Form of Amendment No. 1 to Amended and Restated Deposit Agreement | F-6 POS | 333-198928 | 99(A)(2) | 03 September 2015 | |||||
| 2.3 | Form of Lender Deeds of Confirmation, dated 23 June 2009, by and among James Hardie International Finance B.V., James Hardie Building Products Inc., James Hardie Industries N.V. and Financier | F-4 | 333-160177 | 4.11 | 23 June 2009 | |||||
| 2.4 | Form of Novation Deed, dated 9 October 2009, by and among James Hardie International Finance Limited, James Hardie International Financial B.V., James Hardie Building Products Inc., James Hardie N.V. and Financier | F-4 | 333-165531 | 4.11 | 17 June 2010 | |||||
| 2.5 | Amended and Restated Common Terms Deed Poll, dated 21 January 2013, by and among James Hardie International Finance Limited, James Hardie Building Products, Inc., James Hardie Industries plc, James Hardie International Group Limited and James Hardie Technology Limited | 20-F | 001-15240 | 2.2 | 27 June 2013 | |||||
| 2.6 | Guarantee Trust Deed, dated 19 December 2006, by and between James Hardie Industries N.V. and AET Structured Finance Services Pty Limited | F-4 | 333-165531 | 4.12 | 17 June 2010 |
| James Hardie 2016 Annual Report on Form 20-F | 228 |
| Exhibit Number |
Exhibit Description | Form | File Number | Exhibit | Date | |||||
| 2.7 | Performing Subsidiary Undertaking and Guarantee Trust Deed, dated 19 December 2006, by and between James Hardie James Hardie 117 Pty Limited and AET Structured Finance Services Pty Limited | F-4 | 333-165531 | 4.14 | 17 June 2010 | |||||
| 2.8 | Intercreditor Deed, dated 19 December 2006, by and among The State of New South Wales, James Hardie Industries N.V., Asbestos Injuries Compensation Fund Limited and AET Structured Finance Services Pty Limited | F-4 | 333-165531 | 10.34 | 17 June 2010 | |||||
| 2.9 | Letter Agreement, dated 21 March 2007, amending the Intercreditor Deed, dated 19 December 2006, by and among The State of New South Wales, James Hardie Industries N.V., Asbestos Injuries Compensation Fund Limited and AET Structured Finance Services Pty Limited | F-4 | 333-165531 | 10.35 | 17 June 2010 | |||||
| 2.10 | Performing Subsidiary Intercreditor Deed, dated 19 December 2006, by and among The State of New South Wales, James Hardie 117 Pty Limited, Asbestos Injuries Compensation Fund Limited and AET Structured Finance Services Pty Limited | F-4 | 333-165531 | 10.37 | 17 June 2010 | |||||
| 2.11 | Letter Agreement, dated 21 March 2007, amending the Performing Subsidiary Intercreditor Deed, dated 19 December 2006, by and among The State of New South Wales, James Hardie 117 Pty Limited, Asbestos Injuries Compensation Fund Limited and AET Structured Finance Services Pty Limited | F-4 | 333-165531 | 10.38 | 17 June 2010 | |||||
| 2.12 | Amending Deed to Guarantee Trust Deed, dated 6 October 2009, by and between James Hardie Industries N.V. and AET Structured Finance Services Pty Limited | 20-F | 001-15240 | 2.10 | 30 June 2010 |
| James Hardie 2016 Annual Report on Form 20-F | 229 |
| Exhibit Number |
Exhibit Description | Form | File Number | Exhibit | Date | |||||
| 2.13 | Amending Deed to Performing Subsidiary Undertaking and Guarantee Trust Deed, dated 6 October 2009, by and between James Hardie 117 Pty Limited and AET Structured Finance Services Pty Limited | 20-F | 001-15240 | 2.12 | 30 June 2010 | |||||
| 2.14 | Amending Deed (Intercreditor Deed), dated 23 June 2009, by and among The State of New South Wales, James Hardie Industries N.V., Asbestos Injuries Compensation Fund Limited and AET Structured Finance Services Pty Limited | 20-F | 001-15240 | 4.36 | 30 June 2010 | |||||
| 2.15 | Amending Deed (Performing Subsidiary Intercreditor Deed), dated 23 June 2009, by and among The State of New South Wales, James Hardie 117 Pty Limited, Asbestos Injuries Compensation Fund Limited and AET Structured Finance Services Pty Limited | 20-F | 001-15240 | 4.39 | 30 June 2010 | |||||
| 2.16 | Indenture, dated 10 February 2015, by and among James Hardie International Finance Limited, the guarantors named therein and Deutsche Bank Trust Company Americas | 6-K | 001-15240 | 4.1 | 10 February 2015 | |||||
| 2.17 | Form of 5.875% Senior Note due 2023 | 6-K | 001-15240 | 4.1 | 10 February 2015 | |||||
| 2.18 | Credit and Guaranty Agreement, dated 10 December 2015, by and among James Hardie International Finance Limited and James Hardie Building Products Inc., as borrowers, James Hardie International Group Limited and James Hardie Technolgoy Limted, as guarantors, James Hardie Industries plc, as parent, HSBC Bank USA, National Association, as administrative agent, and the other lender parties thereto.* | |||||||||
| 4.1 | Amended and Restated James Hardie Industries plc 2001 Equity Incentive Plan | 20-F | 001-15240 | 4.1 | 02 July 2012 |
| James Hardie 2016 Annual Report on Form 20-F | 230 |
| Exhibit Number |
Exhibit Description | Form | File Number | Exhibit | Date | |||||
| 4.2 | Amended and Restated James Hardie Industries plc Long Term Incentive Plan 2006 | 6-K | 001-15240 | 99.10 | 17 August 2015 | |||||
| 4.3 | Form of Joint and Several Indemnity Agreement among James Hardie N.V., James Hardie (USA) Inc. and certain indemnitees thereto | 20-F | 001-15240 | 4.15 | 07 July 2005 | |||||
| 4.4 | Form of Joint and Several Indemnity Agreement among James Hardie Industries N.V., James Hardie Inc. and certain indemnitees thereto | 20-F | 001-15240 | 4.16 | 07 July 2005 | |||||
| 4.5 | Form of Deed of Access, Insurance and Indemnity between James Hardie Industries N.V. and supervisory board directors and managing board directors | 20-F | 001-15240 | 4.9 | 08 July 2008 | |||||
| 4.6 | Form of Indemnity Agreement between James Hardie Building Products, Inc. and supervisory board directors, managing board directors and certain executive officers | 20-F | 001-15240 | 4.10 | 08 July 2008 | |||||
| 4.7 | Form of Irish law-governed Deed of Access, Insurance and Indemnity between James Hardie Industries SE, a European Company registered in Ireland, and its directors, company secretary and certain senior employees | F-4 | 333-160177 | 10.10 | 23 June 2009 | |||||
| 4.8 | Form of Deed of Access, Insurance and Indemnity between James Hardie Industries plc, and certain indemnitees thereto | 20-F | 001-15240 | 4.9 | 21 May 2015 | |||||
| 4.9 | Industrial Building Lease Agreement, effective 6 October 2000, by and between James Hardie Building Products Inc. and Fortra Fibre-Cement L.L.C. | 20-F | 001-15240 | 4.25 | 07 July 2005 | |||||
| 4.10 | Deed of Release – Unions and Banton, dated 21 December 2005, by and among James Hardie Industries N.V., Australian Council of Trade Unions, Unions New South Wales, and Bernard Douglas Banton | 20-F | 001-15240 | 4.23 | 29 September 2006 |
| James Hardie 2016 Annual Report on Form 20-F | 231 |
| Exhibit Number |
Exhibit Description | Form | File Number | Exhibit | Date | |||||
| 4.11 | Deed of Release, dated 22 June 2006, by and between James Hardie Industries N.V. and The State of New South Wales | 20-F | 001-15240 | 4.25 | 29 September 2006 | |||||
| 4.12 | Amended and Restated Final Funding Agreement, dated 21 November 2006, by and among James Hardie Industries N.V., James Hardie 117 Pty Ltd, The State of New South Wales and Asbestos Injuries Compensation Fund Limited in its capacity as trustee of the Asbestos Injuries Compensation Fund | 6-K | 001-15240 | 99.4 | 05 January 2007 | |||||
| 4.13 | Asbestos Injuries Compensation Fund Amended and Restated Trust Deed, dated 14 December 2006, by and between James Hardie Industries N.V. and Asbestos Injuries Compensation Fund Limited | 20-F | 001-15240 | 4.22 | 06 July 2007 | |||||
| 4.14 | Second Irrevocable Power of Attorney, dated 14 December 2006, by and between Asbestos Injuries Compensation Fund Limited and The State of New South Wales | 20-F | 001-15240 | 4.60 | 06 July 2007 | |||||
| 4.15 | Deed of Accession, dated 14 December 2006, by and among Asbestos Injuries Compensation Fund Limited, James Hardie Industries N.V., James Hardie 117 Pty Limited and The State of New South Wales | 20-F | 001-15240 | 4.27 | 06 July 2007 | |||||
| 4.16 | Deed Poll, dated 11 June 2008, amendment of the Asbestos Injuries Compensation Fund Amended and Restated Trust Deed | 20-F | 001-15240 | 4.27 | 08 July 2008 | |||||
| 4.17 | Amendment to Amended and Restated Final Funding Agreement, dated 6 August 2007, by and among, James Hardie Industries NV, James Hardie 117 Pty Limited, The State of New South Wales and Asbestos Injuries Compensation Fund Limited in its capacity as trustee of the Asbestos Injuries Compensation Fund | 20-F | 001-15240 | 4.22 | 08 July 2008 |
| James Hardie 2016 Annual Report on Form 20-F | 232 |
| Exhibit Number |
Exhibit Description | Form | File Number | Exhibit | Date | |||||
| 4.18 | Amendment to Amended and Restated Final Funding Agreement, dated 8 November 2007, by and among, James Hardie Industries NV, James Hardie 117 Pty Limited, The State of New South Wales and Asbestos Injuries Compensation Fund Limited in its capacity as trustee of the Asbestos Injuries Compensation Fund | 20-F | 001-15240 | 4.23 | 08 July 2008 | |||||
| 4.19 | Amendment to Amended and Restated Final Funding Agreement, dated 11 June 2008, by and among, James Hardie Industries NV, James Hardie 117 Pty Limited, The State of New South Wales and Asbestos Injuries Compensation Fund Limited in its capacity as trustee of the Asbestos Injuries Compensation Fund | 20-F | 001-15240 | 4.24 | 08 July 2008 | |||||
| 4.20 | Amended and Restated Final Funding Agreement – Address for Service of Notice on Trustee, dated 13 June 2008 | 20-F | 001-15240 | 4.25 | 08 July 2008 | |||||
| 4.21 | Amendment to Amended and Restated Final Funding Agreement, dated 17 July 2008, by and among, James Hardie Industries NV, James Hardie 117 Pty Limited, The State of New South Wales and Asbestos Injuries Compensation Fund Limited in its capacity as trustee of the Asbestos Injuries Compensation Fund | F-4 | 333-160177 | 10.27 | 23 June 2009 | |||||
| 4.22 | Deed of Confirmation, dated 23 June 2009, by and among James Hardie Industries N.V, James Hardie 117 Pty Limited, The State of New South Wales and Asbestos Injuries Compensation Fund Limited in its capacity as trustee of the Asbestos Injuries Compensation Fund | F-4 | 333-160177 | 10.37 | 10 July 2009 | |||||
| 4.23 | Amending Agreement (Parent Guarantee), dated 23 June 2009, by and among Asbestos Injuries Compensation Fund Limited, The State of New South Wales and James Hardie Industries N.V. | 20-F | 001-15240 | 4.30 | 30 June 2010 |
| James Hardie 2016 Annual Report on Form 20-F | 233 |
| Exhibit Number |
Exhibit Description | Form | File Number | Exhibit | Date | |||||
| 4.24 | Deed to amend the Amended and Restated Final Funding Agreement and facilitate the Authorized Loan Facility, dated 9 December 2010, by and among James Hardie Industries SE, James Hardie 117 Pty Limited, The State of New South Wales and Asbestos Injuries Compensation Fund Limited in its capacity as trustee of each of the Compensation Funds | 20-F | 001-15240 | 4.25 | 29 June 2011 | |||||
| 4.25 | AICF facility agreement, dated 9 December 2010, by and among Asbestos Injuries Compensation Fund Limited, ABN 60 Pty Limited, Amaca Pty Ltd, Amaba Pty Ltd and The State of New South Wales | 20-F | 001-15240 | 4.40 | 29 June 2011 | |||||
| 4.26 | Fixed and Floating Charge, dated 9 December 2010, by and among Asbestos Injuries Compensation Fund Limited, ABN 60 Pty Limited, Amaca Pty Ltd, Amaba Pty Ltd and The State of New South Wales | 20-F | 001-15240 | 4.40 | 29 June 2011 | |||||
| 4.27 | Deed to amend the Amended and Restated Final Funding Agreement, dated 29 February 2012, by and among James Hardie Industries SE, James Hardie 117 Pty Limited, The State of New South Wales and Asbestos Injuries Compensation Fund Limited in its capacity as trustee of each of the Compensation Funds | 20-F | 001-15240 | 4.28 | 02 July 2012 | |||||
| 4.28 | Deed to amend the Amended and Restated Final Funding Agreement, dated 28 March 2012, by and among James Hardie Industries SE, James Hardie 117 Pty Limited, The State of New South Wales and Asbestos Injuries Compensation Fund Limited in its capacity as trustee of each of the Compensation Funds | 20-F | 001-15240 | 4.29 | 02 July 2012 |
| James Hardie 2016 Annual Report on Form 20-F | 234 |
| Exhibit Number |
Exhibit Description | Form | File Number | Exhibit | Date | |||||
| 4.29 | Summary of Amendments to Amended and Restated Final Funding Agreement, dated 20 December 2013, by and among, James Hardie Industries NV, James Hardie 117 Pty Limited, The State of New South Wales and Asbestos Injuries Compensation Fund Limited in its capacity as trustee of the Asbestos Injuries Compensation Fund | 20-F | 001-15240 | 4.37 | 26 June 2014 | |||||
| 4.30 | Deed of Amendment, dated 27 February 2015, by and among Asbestos Injuries Compensation Fund Limited, ABN 60 Pty Limited, Amaca Pty Ltd, Amaba Pty Ltd and The State of New South Wales | 20-F | 001-15240 | 4.32 | 21 May 2015 | |||||
| 8.1 | List of significant subsidiaries of James Hardie Industries plc* | |||||||||
| 12.1 | Certification of the Chief Executive Officer pursuant to Section 302 of the Sarbanes-Oxley Act of 2002* | |||||||||
| 12.2 | Certification of the Chief Financial Officer pursuant to Section 302 of the Sarbanes-Oxley Act of 2002* | |||||||||
| 13.1 | Certification of the Chief Executive Officer and Chief Financial Officer pursuant to Section 906 of the Sarbanes-Oxley Act of 2002* | |||||||||
| 15.1 | Consent of Ernst & Young LLP, independent registered public accounting firm* | |||||||||
| 15.2 | Consent of KPMG Actuarial Pty Limited* | |||||||||
| 101.INS | XBRL Instance Document* | |||||||||
| 101.SCH | XBRL Taxonomy Extension Schema Document* | |||||||||
| 101.CAL | XBRL Taxonomy Extension Calculation Linkbase Document* | |||||||||
| 101.DEF | XBRL Taxonomy Extension Definition Linkbase Document* | |||||||||
| 101.LAB | XBRL Taxonomy Extension Labels Linkbase Document* | |||||||||
| 101.PRE | XBRL Taxonomy Extension Presentation Linkbase Document* |
| * | Filed herewith |
| James Hardie 2016 Annual Report on Form 20-F | 235 |
The registrant hereby certifies that it meets all of the requirements for filing on Form 20-F and that it has duly caused and authorized the undersigned to sign this Annual Report on its behalf.
| JAMES HARDIE INDUSTRIES plc | ||||||||
| By: | /S/ LOUIS GRIES | |||||||
| Louis Gries | ||||||||
| Date: 19 May 2016 | Chief Executive Officer | |||||||
This Annual Report has been approved by the Board of Directors of James Hardie Industries plc.
| JAMES HARDIE INDUSTRIES plc | ||||||||
| By: | /S/ MICHAEL N. HAMMES | |||||||
| Michael N. Hammes | ||||||||
| Date: 19 May 2016 | Chairman | |||||||