
Manufacturing and operations Ryan Kilcullen September 2016 Exhibit 99.4
Agenda MANUFACTURING AND OPERATIONS OVERVIEW JAMES HARDIE MANUFACTURING ADVANTAGE JAMES HARDIE MANUFACTURING APPROACH APPROACH TO NEW LINE COMMISSIONING
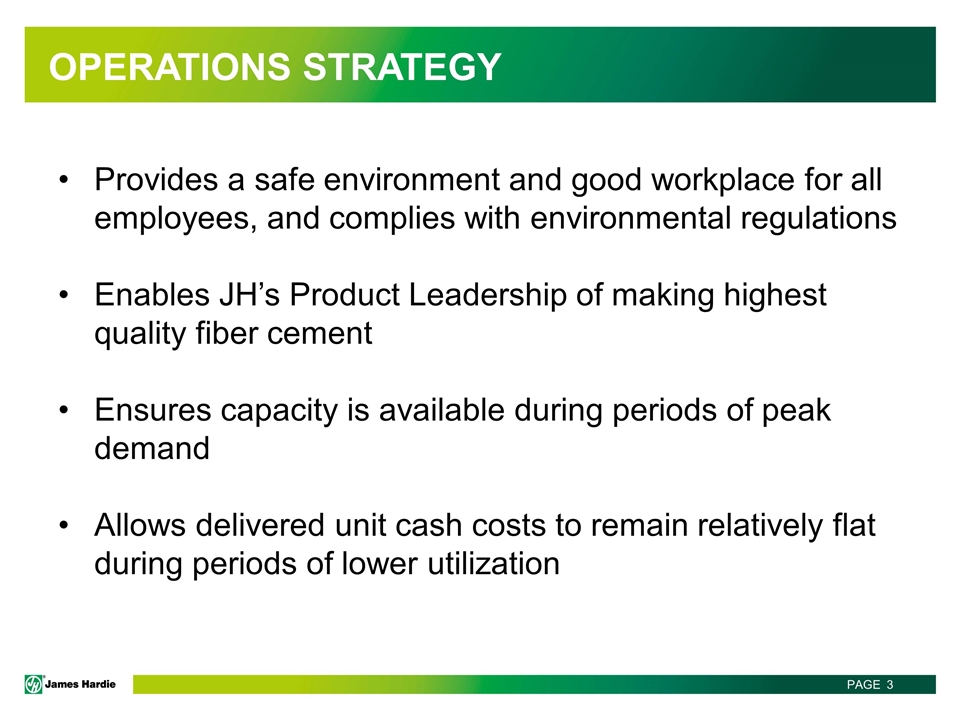
Operations Strategy Provides a safe environment and good workplace for all employees, and complies with environmental regulations Enables JH’s Product Leadership of making highest quality fiber cement Ensures capacity is available during periods of peak demand Allows delivered unit cash costs to remain relatively flat during periods of lower utilization
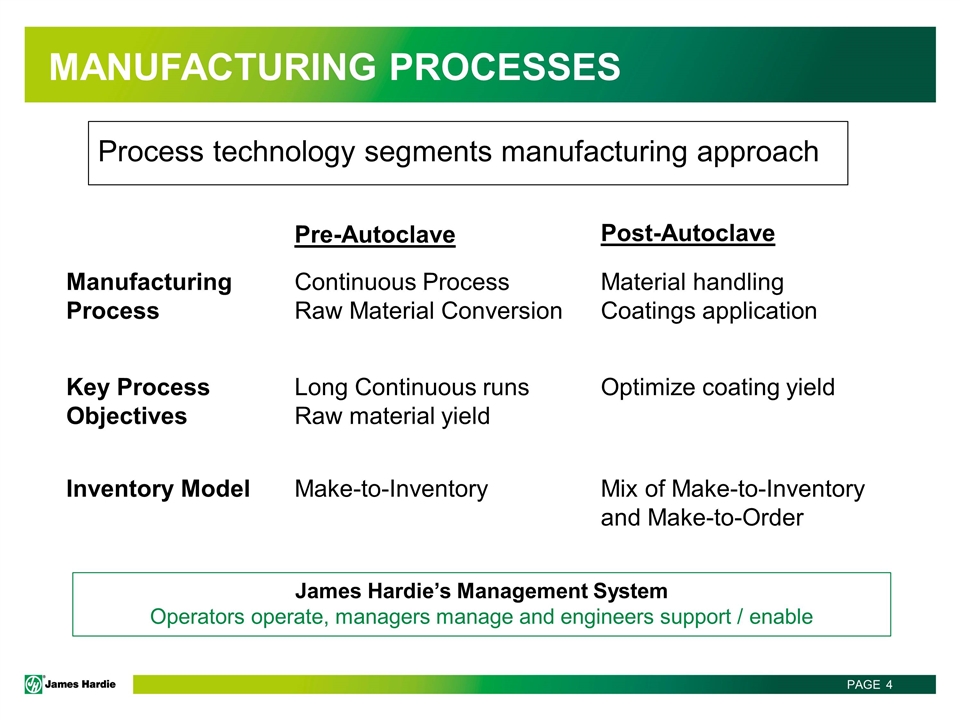
Manufacturing Processes Process technology segments manufacturing approach Pre-Autoclave Post-Autoclave Manufacturing Process Continuous Process Raw Material Conversion Key Process Objectives Material handling Coatings application Long Continuous runs Raw material yield Optimize coating yield Inventory Model Make-to-Inventory Mix of Make-to-Inventory and Make-to-Order James Hardie’s Management System Operators operate, managers manage and engineers support / enable
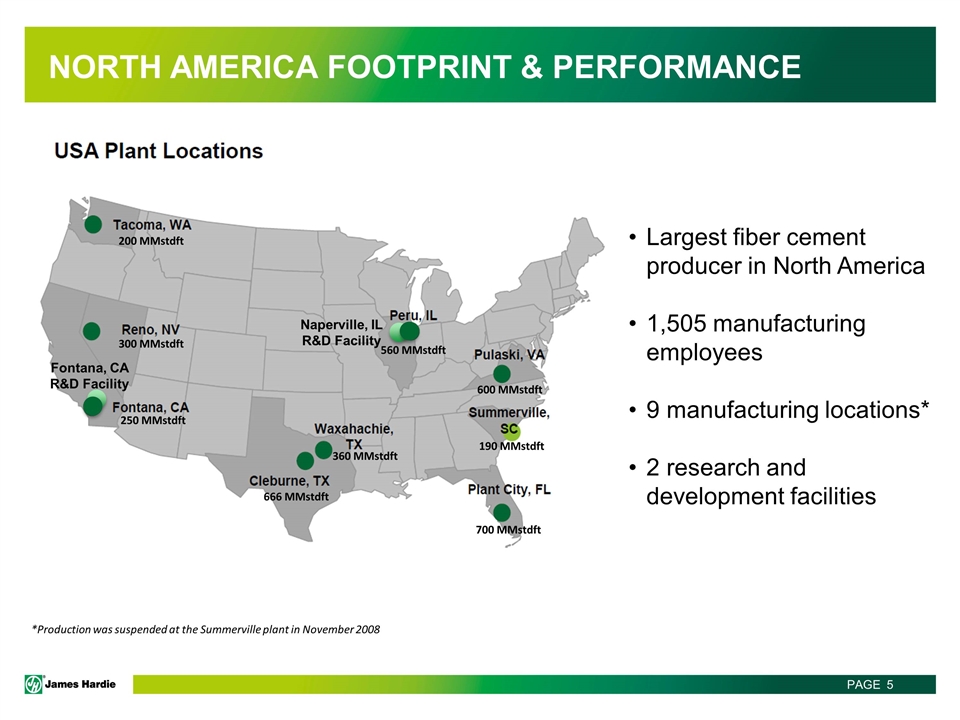
North America footprint & Performance *Production was suspended at the Summerville plant in November 2008 200 MMstdft 360 MMstdft 666 MMstdft 250 MMstdft 300 MMstdft 600 MMstdft 700 MMstdft 560 MMstdft 190 MMstdft Largest fiber cement producer in North America 1,505 manufacturing employees 9 manufacturing locations* 2 research and development facilities Naperville, IL R&D Facility Fontana, CA R&D Facility
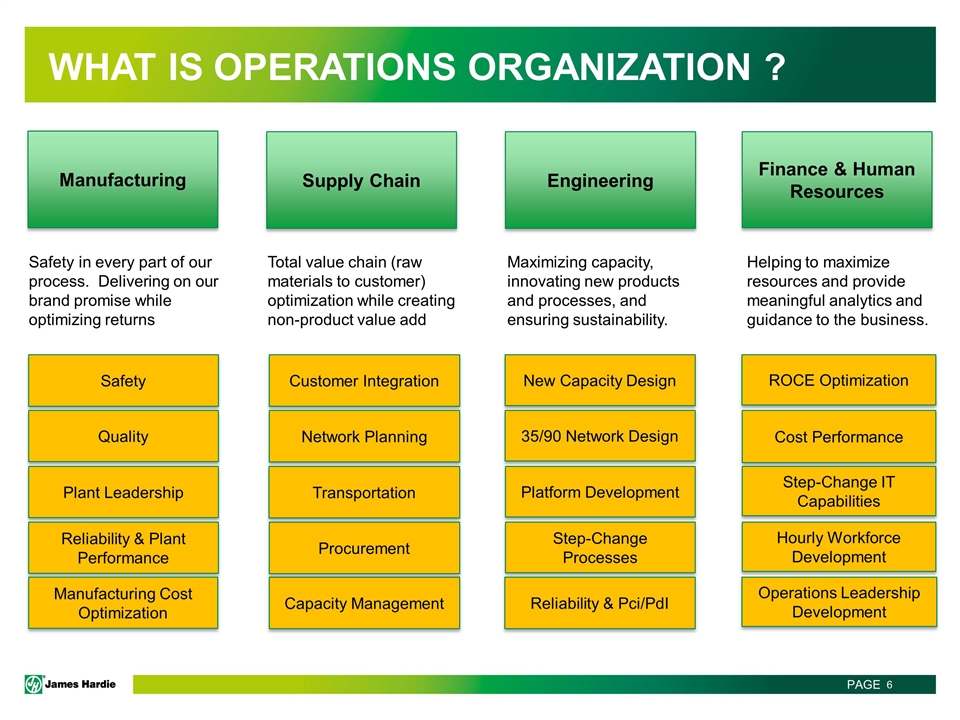
What is Operations Organization ? Supply Chain New Capacity Design Reliability & Pci/PdI Platform Development Finance & Human Resources Engineering Manufacturing ROCE Optimization Cost Performance Safety in every part of our process. Delivering on our brand promise while optimizing returns Total value chain (raw materials to customer) optimization while creating non-product value add Maximizing capacity, innovating new products and processes, and ensuring sustainability. Helping to maximize resources and provide meaningful analytics and guidance to the business. Safety Capacity Management Procurement Transportation Customer Integration Network Planning Plant Leadership Reliability & Plant Performance Quality Step-Change IT Capabilities Manufacturing Cost Optimization Step-Change Processes 35/90 Network Design Hourly Workforce Development Operations Leadership Development
James Hardie’s manufacturing advantage
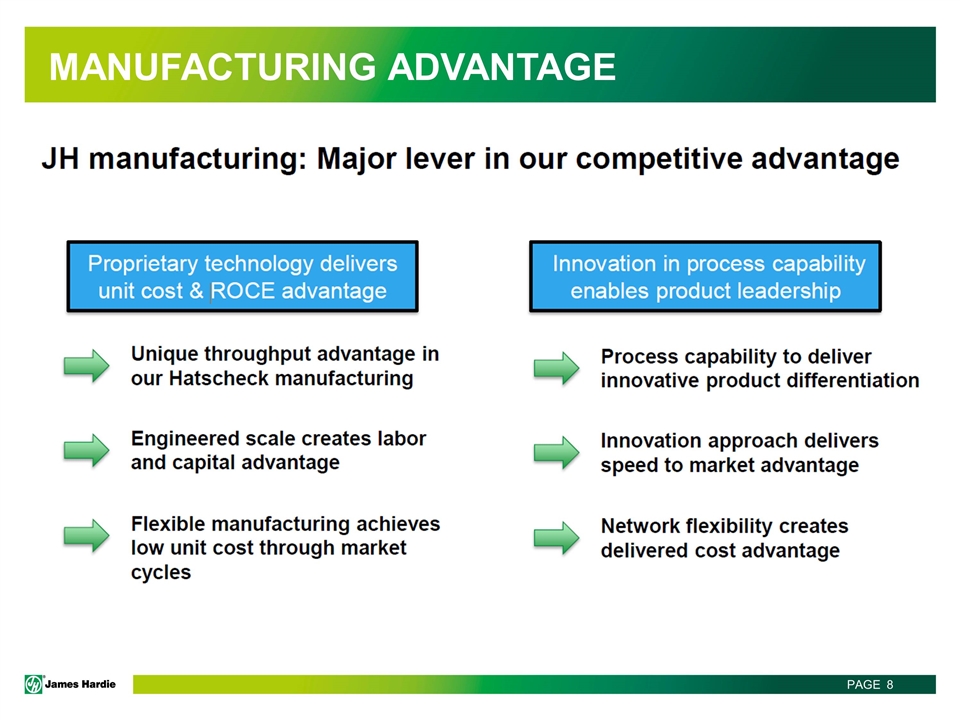
Manufacturing advantage
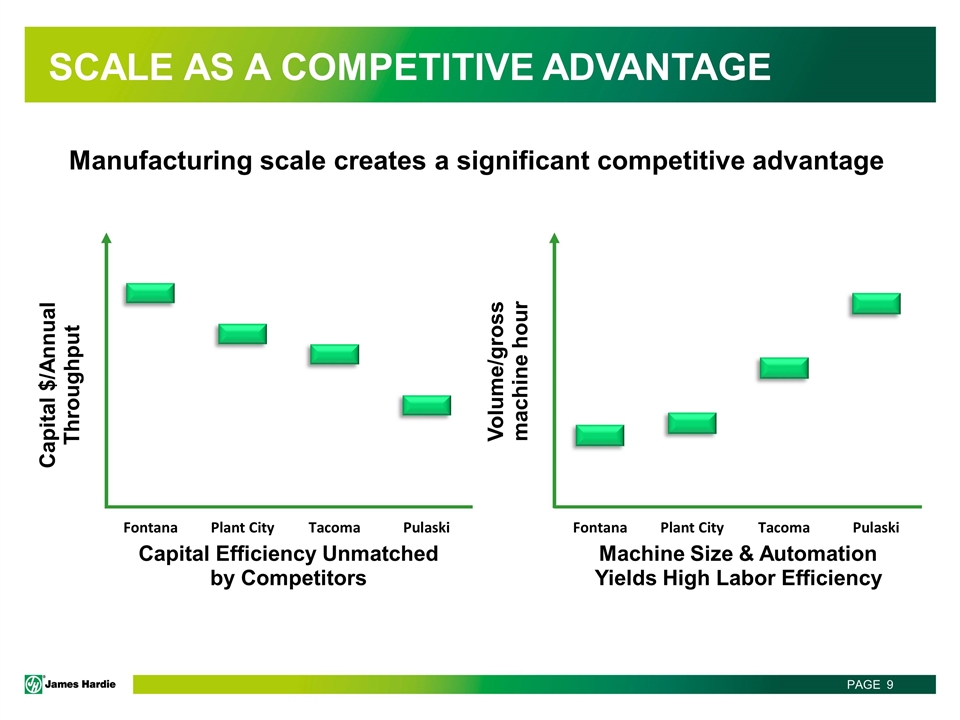
SCALE AS A COMPETITIVE ADVANTAGE Manufacturing scale creates a significant competitive advantage
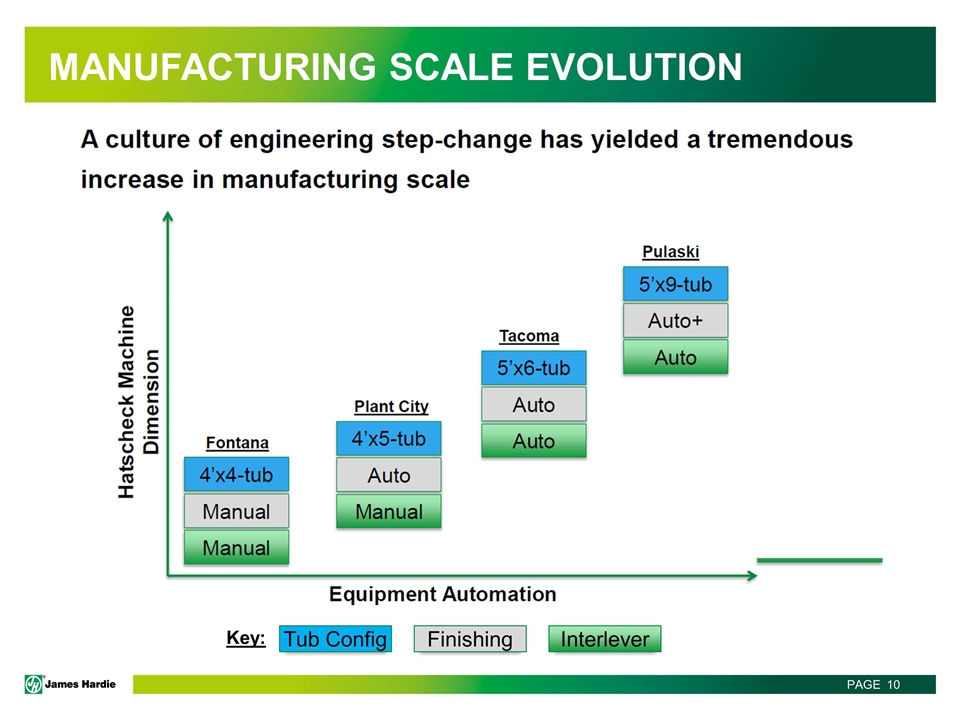
Manufacturing scale evolution Interlever Finishing Tub Config Key:
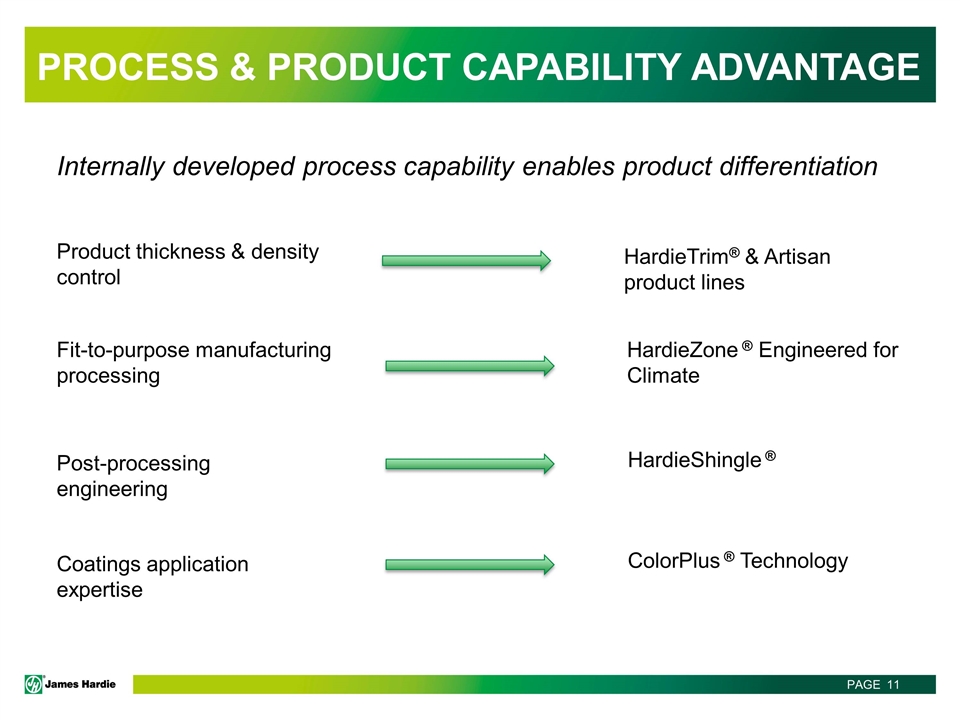
Process & Product capability advantage Product thickness & density control HardieTrim® & Artisan product lines Fit-to-purpose manufacturing processing HardieZone ® Engineered for Climate Post-processing engineering HardieShingle ® Coatings application expertise ColorPlus ® Technology Internally developed process capability enables product differentiation
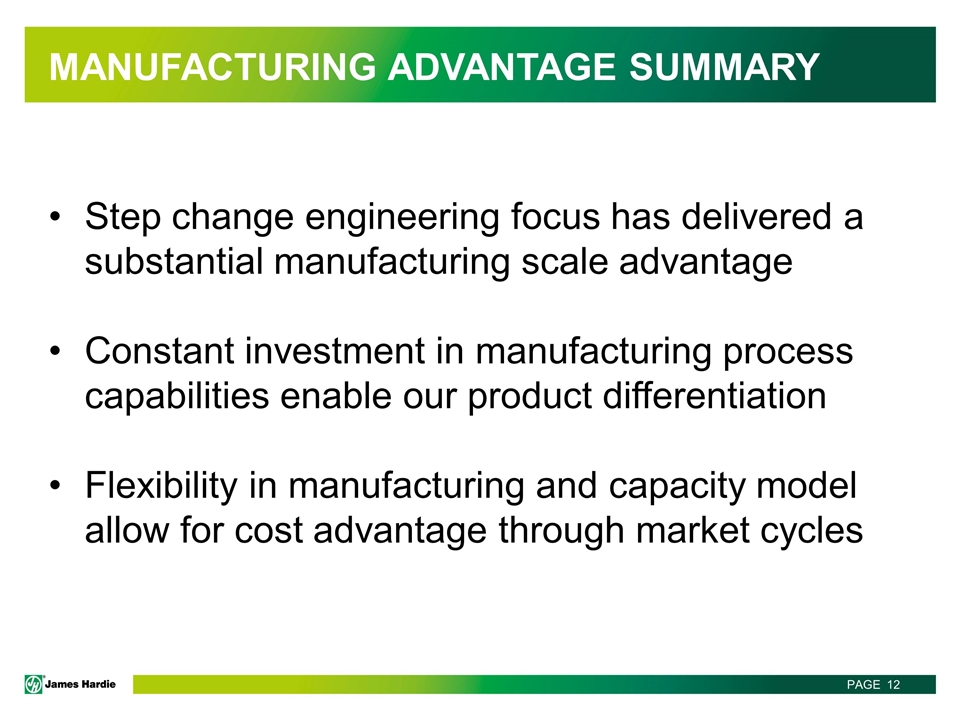
Manufacturing advantage summary Step change engineering focus has delivered a substantial manufacturing scale advantage Constant investment in manufacturing process capabilities enable our product differentiation Flexibility in manufacturing and capacity model allow for cost advantage through market cycles
James Hardie’s manufacturing Management System
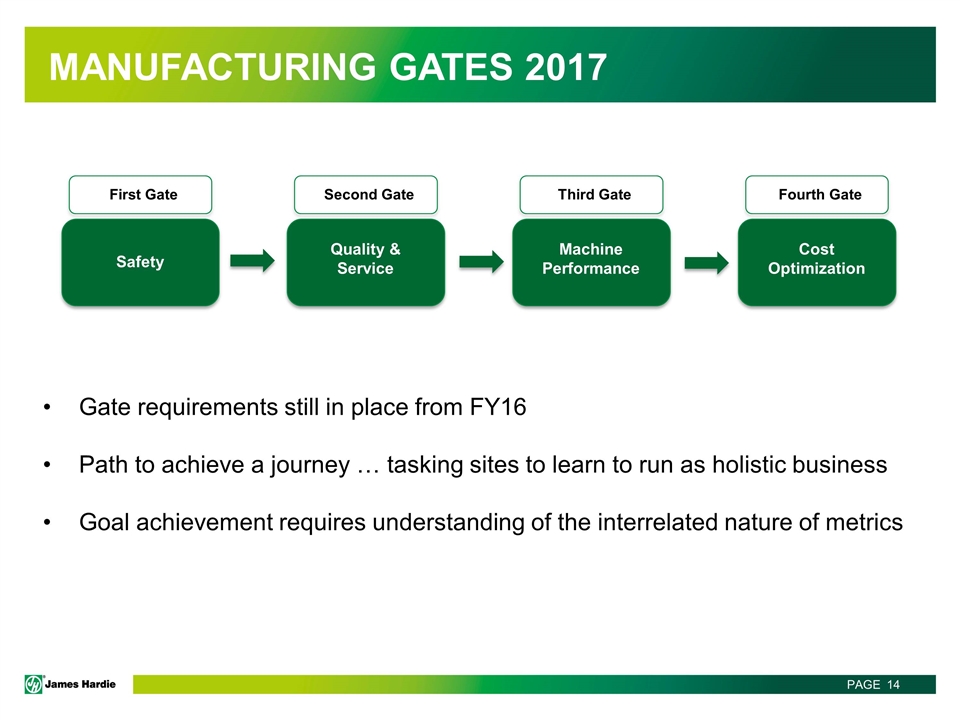
Manufacturing Gates 2017 Gate requirements still in place from FY16 Path to achieve a journey … tasking sites to learn to run as holistic business Goal achievement requires understanding of the interrelated nature of metrics Safety First Gate Quality & Service Second Gate Machine Performance Third Gate Cost Optimization Fourth Gate
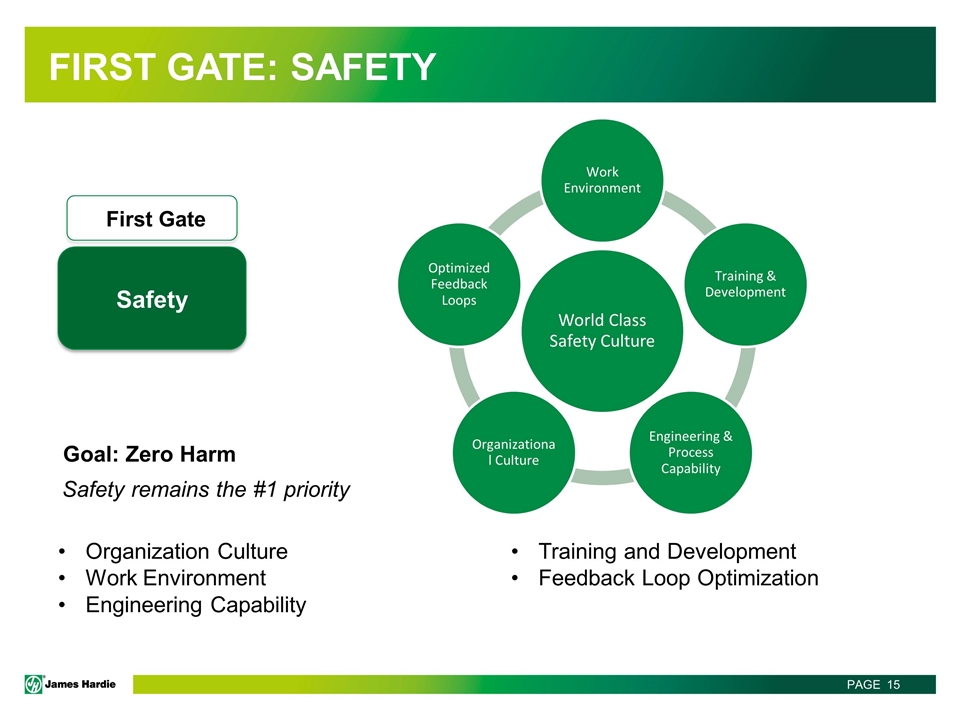
First Gate: Safety Safety First Gate Goal: Zero Harm Safety remains the #1 priority Organization Culture Work Environment Engineering Capability Training and Development Feedback Loop Optimization World Class Safety Culture Work Environment Training & Development Engineering & Process Capability Organizational Culture Optimized Feedback Loops
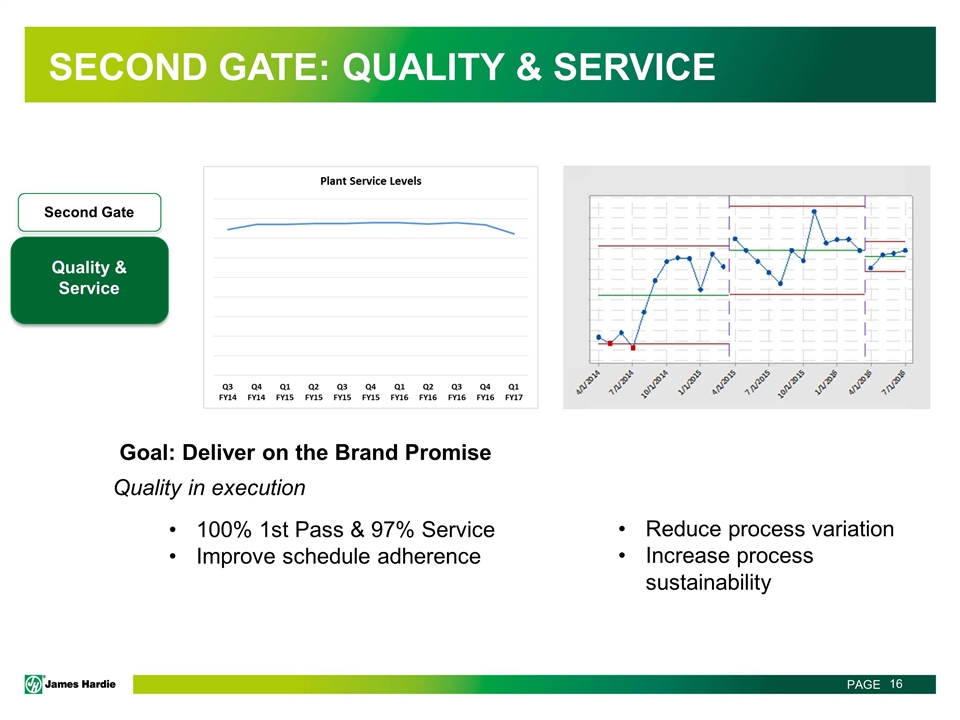
Second Gate: Quality & Service 100% 1st Pass & 97% Service Improve schedule adherence Quality & Service Second Gate Goal: Deliver on the Brand Promise Quality in execution Reduce process variation Increase process sustainability
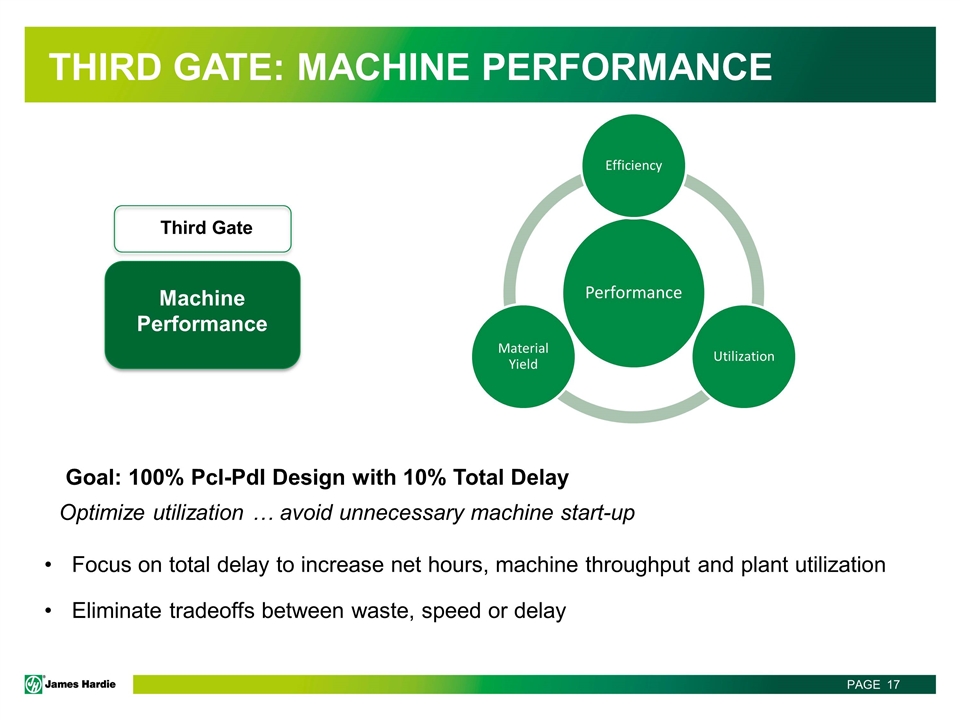
Third Gate: Machine Performance Machine Performance Third Gate Goal: 100% PcI-PdI Design with 10% Total Delay Optimize utilization … avoid unnecessary machine start-up Focus on total delay to increase net hours, machine throughput and plant utilization Eliminate tradeoffs between waste, speed or delay Performance Efficiency Utilization Material Yield
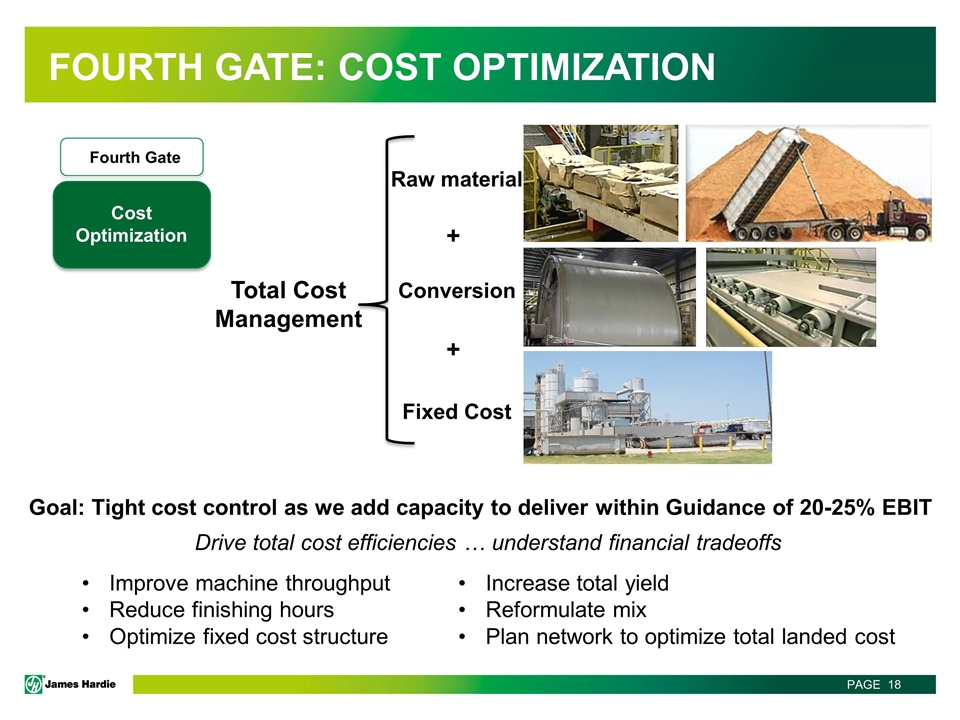
Fourth Gate: Cost Optimization Cost Optimization Fourth Gate Goal: Tight cost control as we add capacity to deliver within Guidance of 20-25% EBIT Drive total cost efficiencies … understand financial tradeoffs Improve machine throughput Reduce finishing hours Optimize fixed cost structure Increase total yield Reformulate mix Plan network to optimize total landed cost Raw material Fixed Cost Conversion + + Total Cost Management
Start-up Performance
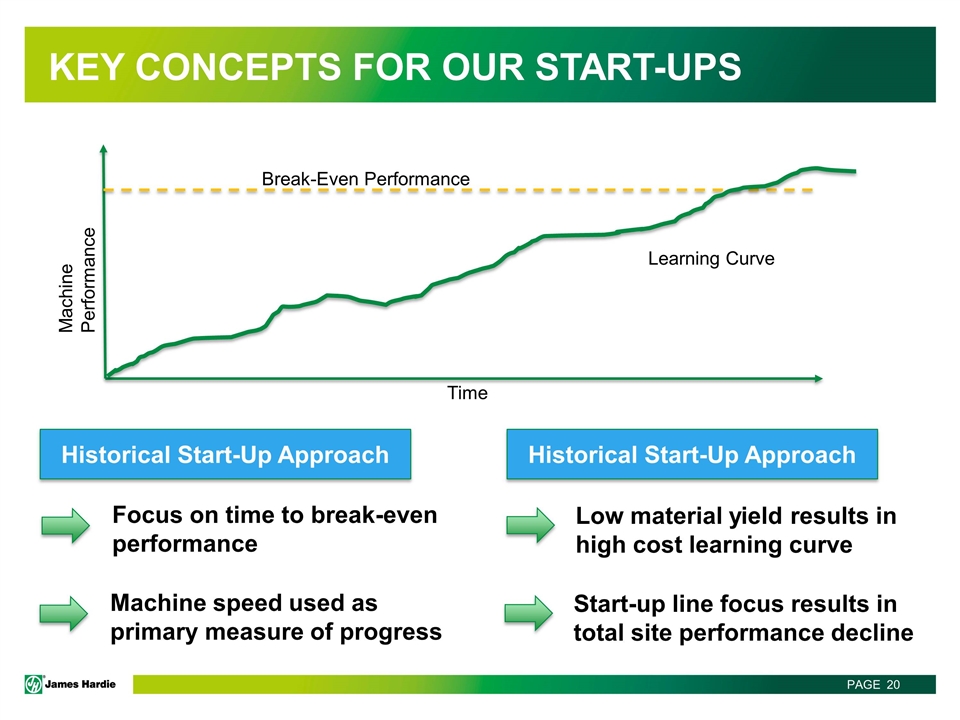
Key concepts for our start-ups Machine Performance Time Learning Curve Break-Even Performance Historical Start-Up Approach Focus on time to break-even performance Machine speed used as primary measure of progress Historical Start-Up Approach Low material yield results in high cost learning curve Start-up line focus results in total site performance decline
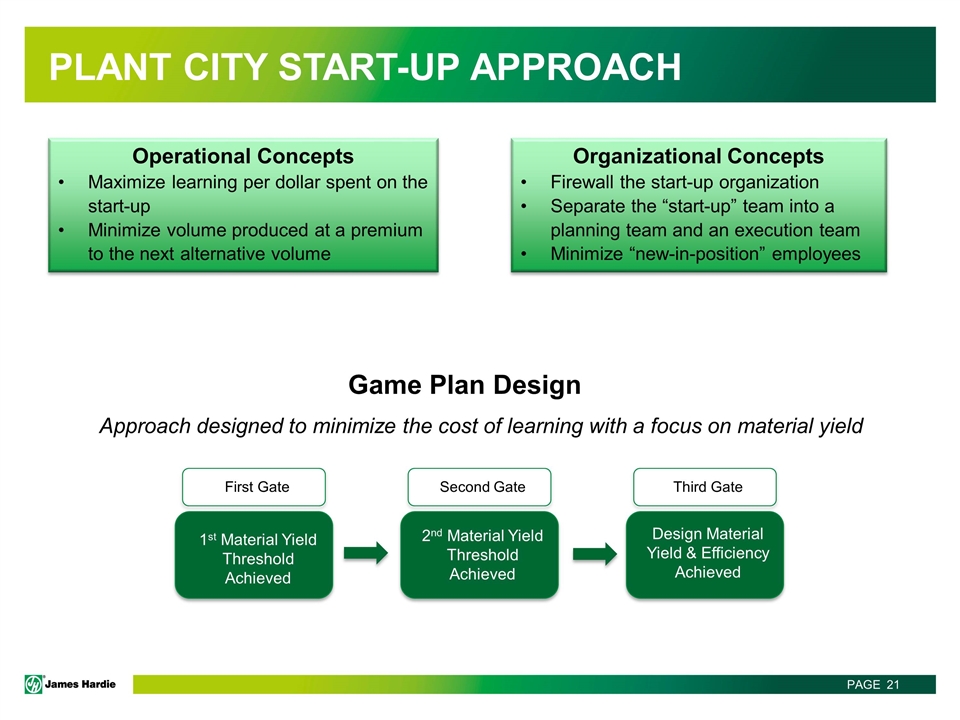
Plant City start-up approach Organizational Concepts Firewall the start-up organization Separate the “start-up” team into a planning team and an execution team Minimize “new-in-position” employees Operational Concepts Maximize learning per dollar spent on the start-up Minimize volume produced at a premium to the next alternative volume Game Plan Design Approach designed to minimize the cost of learning with a focus on material yield 1st Material Yield Threshold Achieved First Gate Second Gate Third Gate 2nd Material Yield Threshold Achieved Design Material Yield & Efficiency Achieved
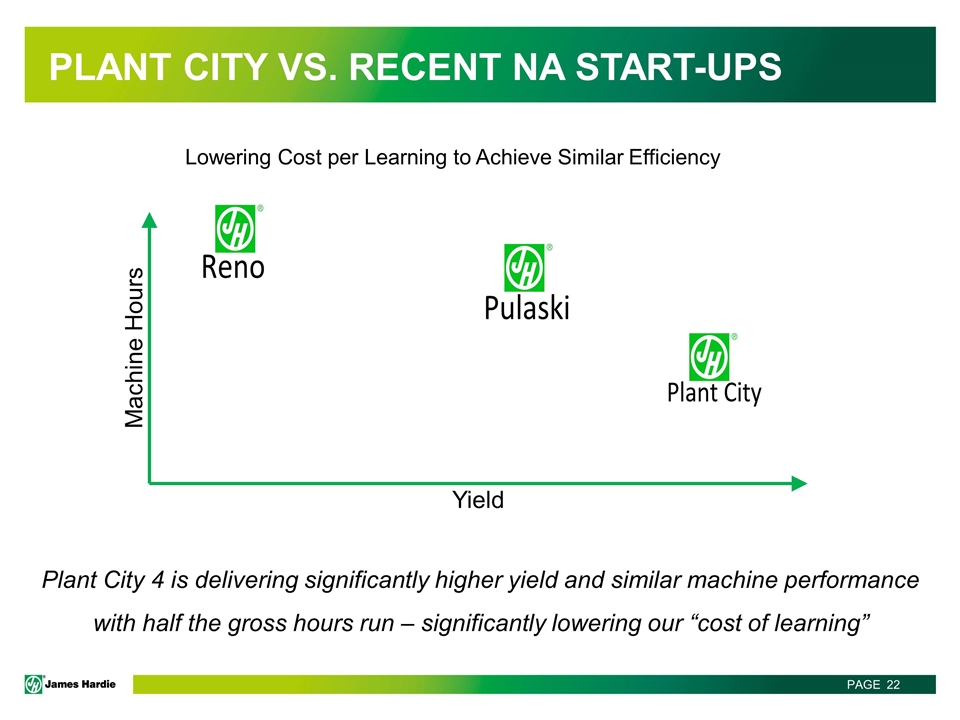
Plant City vs. recent na start-ups Plant City 4 is delivering significantly higher yield and similar machine performance with half the gross hours run – significantly lowering our “cost of learning”
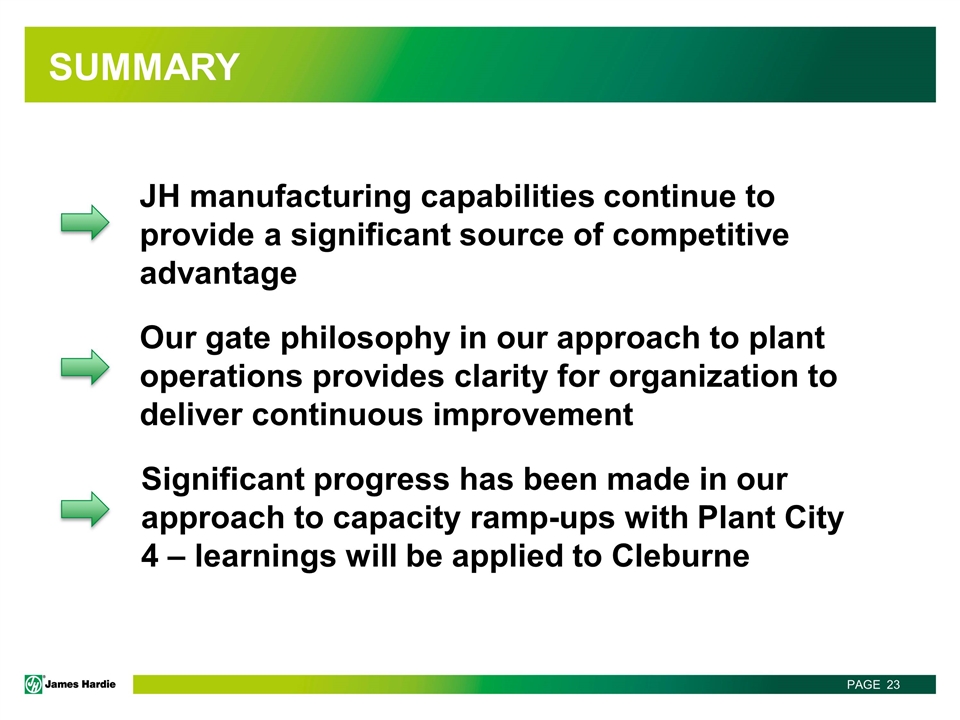
Summary JH manufacturing capabilities continue to provide a significant source of competitive advantage Our gate philosophy in our approach to plant operations provides clarity for organization to deliver continuous improvement Significant progress has been made in our approach to capacity ramp-ups with Plant City 4 – learnings will be applied to Cleburne