Exhibit 99.4
James Hardie
Q4 FY17
MANAGEMENT PRESENTATION
18 May 2017
CAUTIONARY NOTE ON FORWARD-LOOKING STATEMENTS
This Management Presentation contains forward-looking statements. James Hardie Industries plc (the “company”) may from time to time make forward-looking statements in its
periodic reports filed with or furnished to the Securities and Exchange Commission, on Forms 20-F and 6-K, in its annual reports to shareholders, in offering circulars,
invitation memoranda and prospectuses, in media releases and other written materials and in oral statements made by the company’s officers, directors or employees to analysts, institutional investors, existing and potential lenders,
representatives of the media and others. Statements that are not historical facts are forward-looking statements and such forward-looking statements are statements made pursuant to the Safe Harbor Provisions of the Private Securities Litigation
Reform Act of 1995.
Examples of forward-looking statements include:
statements about the company’s future performance;
projections of the
company’s results of operations or financial condition;
statements regarding the company’s plans, objectives or goals, including those relating to
strategies, initiatives, competition, acquisitions, dispositions and/or its products;
expectations concerning the costs associated with the suspension or closure
of operations at any of the company’s plants and future plans with respect to any such plants;
expectations concerning the costs associated with the
significant capital expenditure projects at any of the company’s plants and future plans with respect to any such projects;
expectations regarding the
extension or renewal of the company’s credit facilities including changes to terms, covenants or ratios;
expectations concerning dividend payments and share buy-backs;
statements concerning the company’s corporate and tax domiciles and structures and potential changes to them,
including potential tax charges;
statements regarding tax liabilities and related audits, reviews and proceedings;
statements regarding the possible consequences and/or potential outcome of legal proceedings brought against us and the potential liabilities, if any, associated with such
proceedings;
expectations about the timing and amount of contributions to Asbestos Injuries Compensation Fund (AICF), a special purpose fund for the compensation
of proven Australian asbestos-related personal injury and death claims;
expectations concerning the adequacy of the company’s warranty provisions and
estimates for future warranty-related costs;
statements regarding the company’s ability to manage legal and regulatory matters (including but not limited to
product liability, environmental, intellectual property and competition law matters) and to resolve any such pending legal and regulatory matters within current estimates and in anticipation of certain third-party recoveries; and
statements about economic conditions, such as changes in the US economic or housing market conditions or changes in the market conditions in the Asia Pacific region, the levels of
new home construction and home renovations, unemployment levels, changes in consumer income, changes or stability in housing values, the availability of mortgages and other financing, mortgage and other interest rates, housing affordability and
supply, the levels of foreclosures and home resales, currency exchange rates, and builder and consumer confidence.
James Hardie PAGE 2
CAUTIONARY NOTE ON FORWARD-LOOKING STATEMENTS (continued)
Words such as “believe,” “anticipate,” “plan,” “expect,” “intend,” “target,” “estimate,” “project,”
“predict,” “forecast,” “guideline,” “aim,” “will,” “should,” “likely,” “continue,” “may,” “objective,” “outlook” and similar expressions
are intended to identify forward-looking statements but are not the exclusive means of identifying such statements. Readers are cautioned not to place undue reliance on these forward-looking statements and all such forward-looking statements are
qualified in their entirety by reference to the following cautionary statements.
Forward-looking statements are based on the company’s current expectations,
estimates and assumptions and because forward-looking statements address future results, events and conditions, they, by their very nature, involve inherent risks and uncertainties, many of which are unforeseeable and beyond the company’s
control. Such known and unknown risks, uncertainties and other factors may cause actual results, performance or other achievements to differ materially from the anticipated results, performance or achievements expressed, projected or implied by
these forward-looking statements. These factors, some of which are discussed under “Risk Factors” in Section 3 of the Form 20-F filed with the Securities and Exchange Commission on 18 May
2017, include, but are not limited to: all matters relating to or arising out of the prior manufacture of products that contained asbestos by current and former company subsidiaries; required contributions to AICF, any shortfall in AICF and the
effect of currency exchange rate movements on the amount recorded in the company’s financial statements as an asbestos liability; governmental loan facility to AICF; compliance with and changes in tax laws and treatments; competition and
product pricing in the markets in which the company operates; the consequences of product failures or defects; exposure to environmental, asbestos, putative consumer class action or other legal proceedings; general economic and market conditions;
the supply and cost of raw materials; possible increases in competition and the potential that competitors could copy the company’s products; reliance on a small number of customers; a customer’s inability to pay; compliance with and
changes in environmental and health and safety laws; risks of conducting business internationally; compliance with and changes in laws and regulations; currency exchange risks; dependence on customer preference and the concentration of the
company’s customer base on large format retail customers, distributors and dealers; dependence on residential and commercial construction markets; the effect of adverse changes in climate or weather patterns; possible inability to renew credit
facilities on terms favorable to the company, or at all; acquisition or sale of businesses and business segments; changes in the company’s key management personnel; inherent limitations on internal controls; use of accounting estimates; and all
other risks identified in the company’s reports filed with Australian, Irish and US securities regulatory agencies and exchanges (as appropriate). The company cautions you that the foregoing list of factors is not exhaustive and that other
risks and uncertainties may cause actual results to differ materially from those referenced in the company’s forward-looking statements. Forward-looking statements speak only as of the date they are made and are statements of the company’s
current expectations concerning future results, events and conditions. The company assumes no obligation to update any forward-looking statements or information except as required by law.
James Hardie PAGE 3
NOTE TO THE READER
As of
30 June 2016, the Company changed its reportable operating segments. Previously, the Company reported on three operating segments: (i) North America and Europe Fiber Cement, (ii) Asia Pacific Fiber Cement, and (iii) Research and
Development. As of 30 June 2016, the Company began reporting on four operating segments: (i) North America Fiber Cement, (ii) International Fiber Cement, (iii) Other Businesses, and (iv) Research and Development. The
significant changes to how certain businesses are reported in the new segment structure are as follows: (i) our European business is now reported in the International Fiber Cement segment, along with the other businesses that were historically
reported in the Asia Pacific Fiber Cement segment, and (ii) business development, including some non-fiber cement operations, such as our windows business in North America, are now reported in the Other
Businesses segment as opposed to previously being reported in the North America and Europe Fiber Cement segment. The Company has provided its historical segment information for the fourth quarter and full year ended 31 March 2016 and 2015 to be
consistent with the new reportable segment structure. The change in reportable segments had no effect on the Company’s financial position, results of operations or cash flows for the periods presented. Readers are referred to Note 17 of our
consolidated financial statements for further information on our segments.
James Hardie PAGE 4
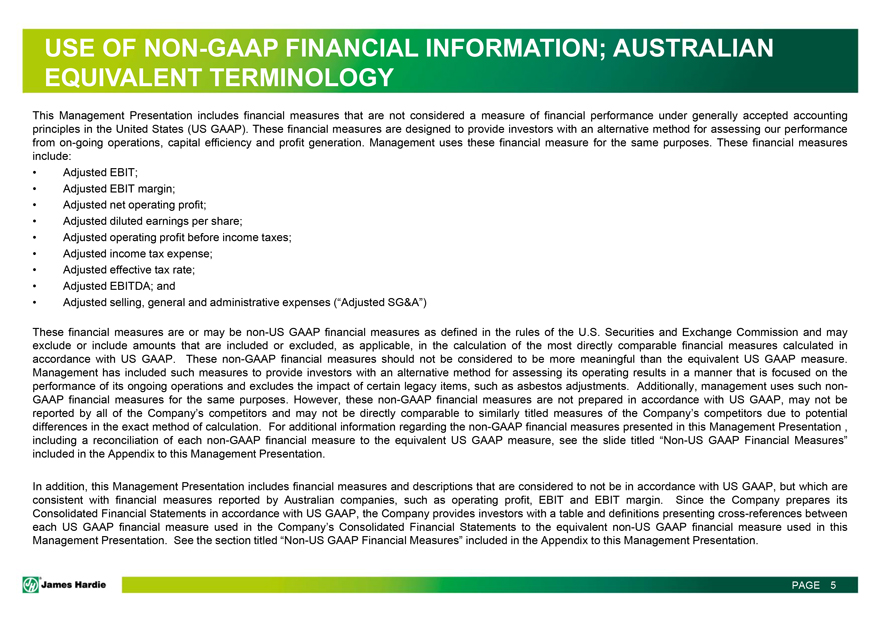
USE OF NON-GAAP FINANCIAL INFORMATION; AUSTRALIAN EQUIVALENT
TERMINOLOGY
This Management Presentation includes financial measures that are not considered a measure of financial performance under generally accepted accounting
principles in the United States (US GAAP). These financial measures are designed to provide investors with an alternative method for assessing our performance from on-going operations, capital efficiency and
profit generation. Management uses these financial measure for the same purposes. These financial measures include:
Adjusted EBIT;
Adjusted EBIT margin;
Adjusted net operating profit;
Adjusted diluted earnings per share;
Adjusted operating profit before income taxes;
Adjusted income tax expense;
Adjusted effective tax rate;
Adjusted EBITDA; and
Adjusted selling, general and administrative expenses (“Adjusted
SG&A”)
These financial measures are or may be non-US GAAP financial measures as defined in the rules of the U.S.
Securities and Exchange Commission and may exclude or include amounts that are included or excluded, as applicable, in the calculation of the most directly comparable financial measures calculated in accordance with US GAAP. These non-GAAP financial measures should not be considered to be more meaningful than the equivalent US GAAP measure. Management has included such measures to provide investors with an alternative method for
assessing its operating results in a manner that is focused on the performance of its ongoing operations and excludes the impact of certain legacy items, such as asbestos adjustments. Additionally, management uses such
non-GAAP financial measures for the same purposes. However, these non-GAAP financial measures are not prepared in accordance with US GAAP, may not be reported by
all of the Company’s competitors and may not be directly comparable to similarly titled measures of the Company’s competitors due to potential differences in the exact method of calculation. For additional information regarding the non-GAAP financial measures presented in this Management Presentation , including a reconciliation of each non-GAAP financial measure to the equivalent US GAAP measure,
see the slide titled “Non-US GAAP Financial Measures” included in the Appendix to this Management Presentation.
In addition, this Management Presentation includes financial measures and descriptions that are considered to not be in accordance with US GAAP, but which are
consistent with financial measures reported by Australian companies, such as operating profit, EBIT and EBIT margin. Since the Company prepares its Consolidated Financial Statements in accordance with US GAAP, the Company provides investors
with a table and definitions presenting cross-references between each US GAAP financial measure used in the Company’s Consolidated Financial Statements to the equivalent non-US GAAP financial measure
used in this Management Presentation. See the section titled “Non-US GAAP Financial Measures” included in the Appendix to this Management Presentation.
James Hardie PAGE 5
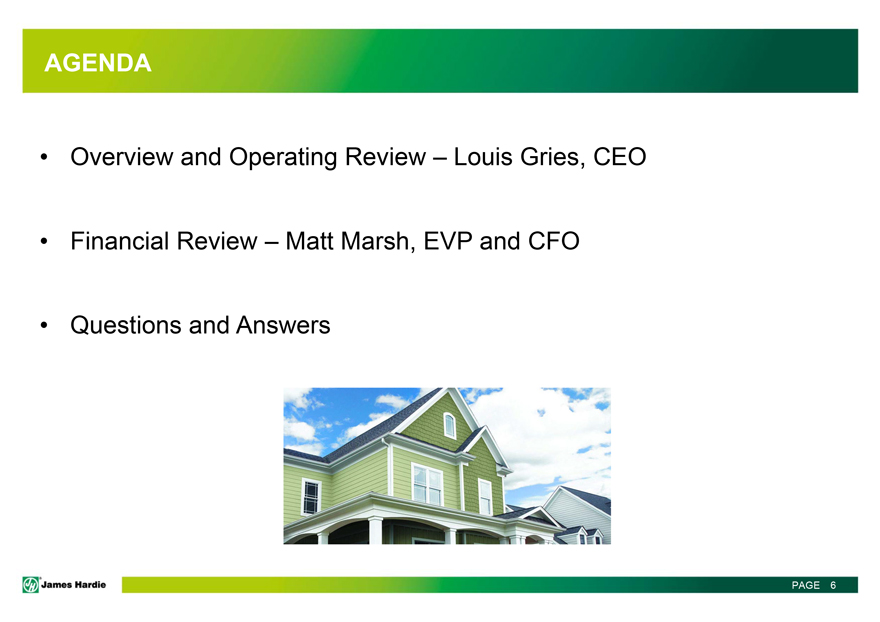
AGENDA
Overview and
Operating Review – Louis Gries, CEO
Financial Review – Matt Marsh, EVP and CFO
Questions and Answers
James Hardie PAGE 6

James Hardie
OVERVIEW AND
OPERATING REVIEW
Louis Gries, CEO
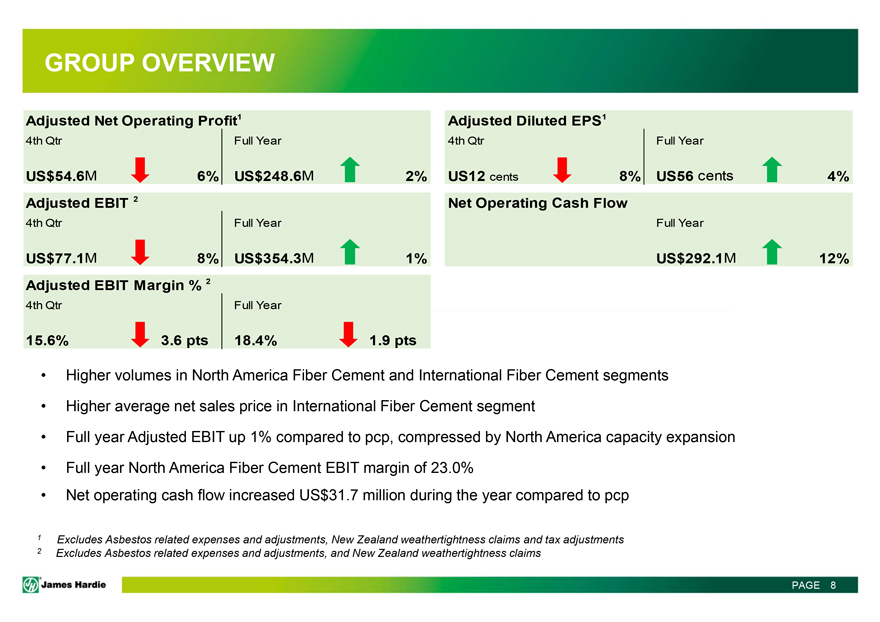
GROUP OVERVIEW
Adjusted
Net Operating Profit1
4th Qtr
Full Year
US$54.6M 6%
US$248.6M 2%
Adjusted EBIT
2
4th Qtr
Full Year
US$77.1M 8% US$354.3M
1%
Adjusted EBIT
Margin % 2
4th Qtr
Full Year
15.6%
3.6 pts
18.4%
1.9 pts
Adjusted Diluted EPS1
4th Qtr
Full Year
US12 cents
8%
US56 cents
4%
Net Operating Cash Flow
Full Year
US$292.1M
12%
Higher volumes in North America Fiber Cement and International Fiber Cement segments
Higher average net sales price in International Fiber Cement segment
Full
year Adjusted EBIT up 1% compared to pcp, compressed by North America capacity expansion
Full year North America Fiber Cement EBIT margin of 23.0%
Net operating cash flow increased US$31.7 million during the year compared to pcp
1
Excludes Asbestos related expenses and adjustments, New Zealand weathertightness claims and tax adjustments
2 Excludes Asbestos related expenses and adjustments,
and New Zealand weathertightness claims
James Hardie PAGE 8
NORTH AMERICA FIBER CEMENT SUMMARY
Q4’17 Full Year
Net Sales
US$387.7M US$1,493.4M
12%
12%
Sales Volume
578.6 mmsf
2,215.4 mmsf
12%
13%
Average Price
US$662 per msf US$665 per msf
1%
1%
EBIT
US$76.1M US$343.9M
11%
2%
Volume
Steady growth in R&R and new construction markets
Market penetration was strong
EBIT
EBIT for the year decreased compared to pcp driven by:
Unfavorable plant performance due to:
Elevated spend
Production inefficiencies
Higher start-up costs due to:
Acceleration of start
ups into FY17
Inefficient start-ups in some locations
Higher freight costs
Continued investment in headcount and other programs to support and drive
future growth
James Hardie PAGE 9
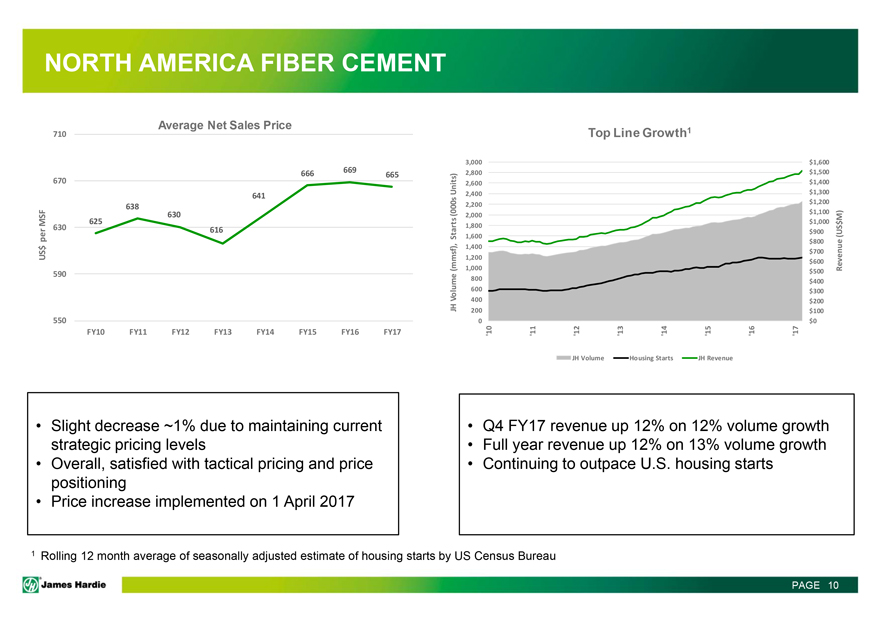
NORTH AMERICA FIBER CEMENT
US$ per MSF
Average Net Sales Price
710
670
630
590
550
669
666
665
641
638
630
625
616
FY10 FY11 FY12 FY13 FY14 FY15 FY16 FY17
Slight decrease ~1% due to maintaining current strategic pricing levels
Overall, satisfied
with tactical pricing and price positioning
Price increase implemented on 1 April 2017
Top Line Growth1
JH Volume (mmsf), Starts (000s Units)
Revenue (US$M)
3,000
2,800
2,600
2,400
2,200
2,000
1,800
1,600
1,400
1,200
1,000
800
400
200
0
$1,600
$1,500
$1,400
$1,300
$1,200
$1,100
$1,000
$900
$800
$700
$600
$500
$400
$300
$200
$100
$0
‘10
‘11
‘12
‘13
‘14
‘15
‘16
‘17
JH Volume Housing Starts JH Revenue
Q4 FY17 revenue up 12% on 12% volume growth
Full year revenue up 12% on 13% volume growth
Continuing to outpace U.S. housing starts
1 Rolling 12 month average of
seasonally adjusted estimate of housing starts by US Census Bureau
JH James Hardie PAGE 10
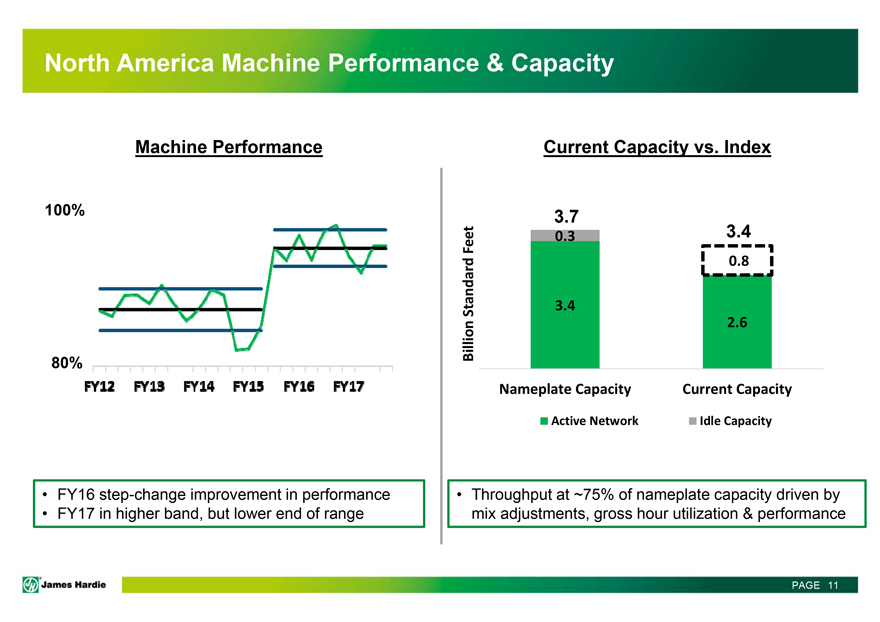
North America Machine Performance & Capacity
Machine Performance
100%
80%
FY12 FY13 FY14 FY15 FY16 FY17
FY16 step-change improvement in performance
FY17 in higher band, but lower end of range
Current Capacity vs. Index
Billion Standard Feet
3.7
0.3 3.4
0.8
3.4
2.6
Nameplate Capacity Current Capacity
Active Network Idle Capacity
Throughput at ~75% of nameplate capacity driven by mix
adjustments, gross hour utilization & performance
JH James Hardie PAGE 11
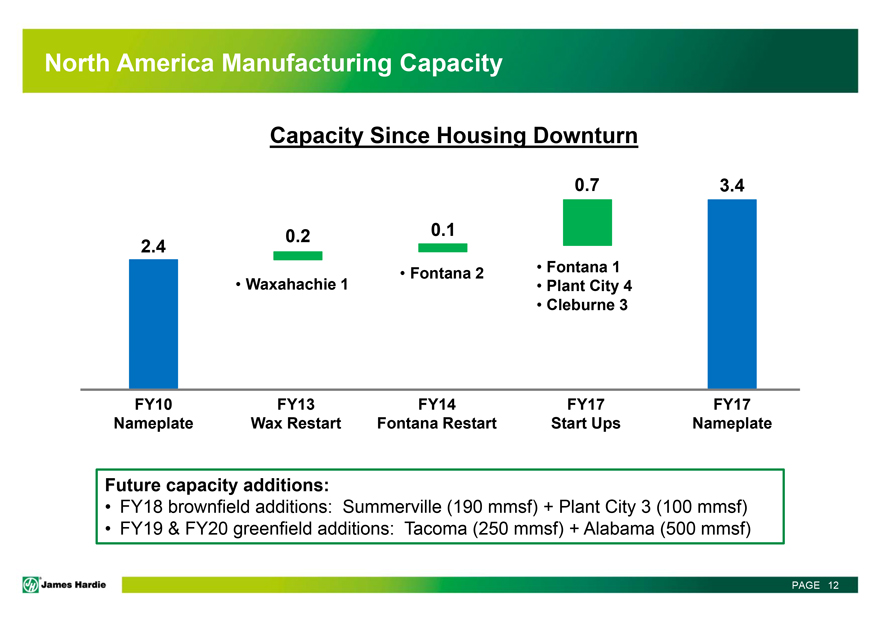
North America Manufacturing Capacity
Capacity Since Housing Downturn
0.7 3.4
0.2 0.1
2.4
Fontana 2 Fontana 1
Waxahachie 1 Plant City 4
Cleburne 3
FY10 FY13 FY14 FY17 FY17
Nameplate Wax Restart Fontana Restart Start Ups Nameplate
Future capacity additions:
FY18 brownfield additions: Summerville (190 mmsf) + Plant City 3 (100 mmsf)
FY19 & FY20 greenfield additions: Tacoma (250 mmsf) + Alabama (500 mmsf)
JH James Hardie PAGE 12
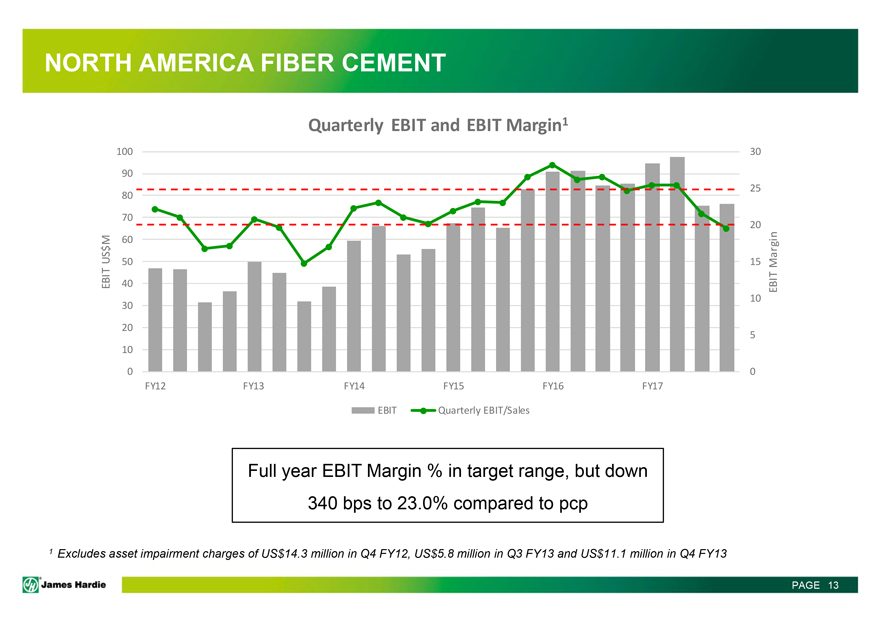
NORTH AMERICA FIBER CEMENT
Quarterly EBIT and EBIT Margin1
EBIT US$M
EBIT Margin
100
90
80
70
60
50
40
30
20
10
0
30
25
20
15
10
5
0
FY12
FY13 FY14 FY15 FY16 FY17
EBIT Quarterly EBIT/Sales
Full year EBIT Margin
% in target range, but down 340 bps to 23.0% compared to pcp
1 Excludes asset impairment charges of US$14.3 million in Q4 FY12, US$5.8 million in Q3 FY13
and US$11.1 million in Q4 FY13
JH James Hardie PAGE 13
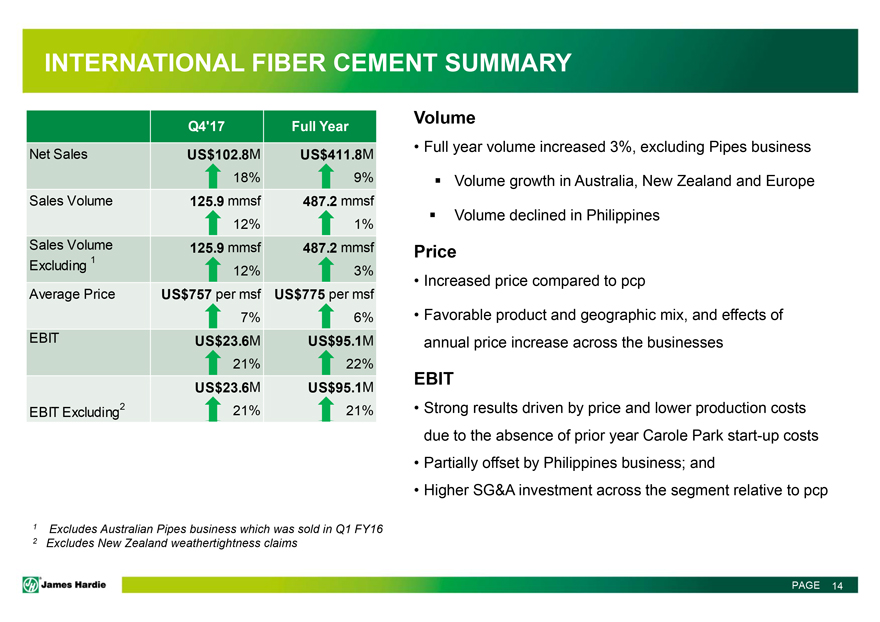
INTERNATIONAL FIBER CEMENT SUMMARY
Q4’17 Full Year
Net SalesUS$102.8M US$411.8M
18% 9%
Sales Volume 125.9 mmsf 487.2 mmsf
12% 1%
Sales Volume 125.9 mmsf 487.2 mmsf
Excluding 1 12% 3%
Average Price US$757 per msf US$775 per msf
7% 6%
EBIT US$23.6M US$95.1M
21% 22%
US$23.6M US$95.1M
EBIT Excluding2 21% 21%
Volume
Full year volume increased 3%, excluding Pipes business
Volume growth in Australia, New
Zealand and Europe
Volume declined in Philippines
Price
Increased price compared to pcp
Favorable product and geographic mix, and effects of annual
price increase across the businesses
EBIT
Strong results driven by price and
lower production costs due to the absence of prior year Carole Park start-up costs
Partially offset by Philippines
business; and
Higher SG&A investment across the segment relative to pcp
1
Excludes Australian Pipes business which was sold in Q1 FY16
2 Excludes New Zealand weathertightness claims
JH James Hardie PAGE 14
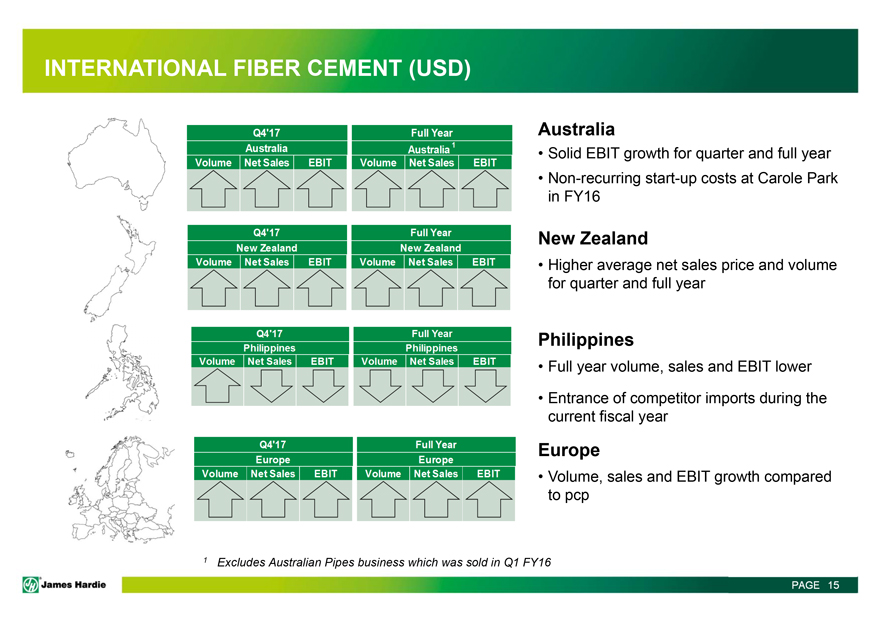
INTERNATIONAL FIBER CEMENT (USD)
Q4’17 Full Year
Australia Australia1
Volume Net Sales EBIT Volume Net Sales EBIT
Q4’17 Full Year
New Zealand New Zealand
Volume Net Sales EBIT Volume Net Sales EBIT
Q4’17 Full Year
Philippines Philippines
Volume Net Sales EBIT Volume Net Sales EBIT
Q4’17 Full Year
Europe Europe
Volume Net Sales EBIT Volume Net Sales EBIT
Australia
Solid EBIT growth for quarter and full year
Non-recurring start-up costs at Carole Park in FY16
New Zealand
Higher average net sales price and volume for quarter and full year
Philippines
Full year volume, sales and EBIT lower
Entrance of competitor imports during the current
fiscal year
Europe
Volume, sales and EBIT growth compared to pcp
1 Excludes Australian Pipes business which was sold in Q1 FY16
James Hardie PAGE 15
JH James Hardie
FINANCIAL
REVIEW
Matt Marsh, EVP and CFO
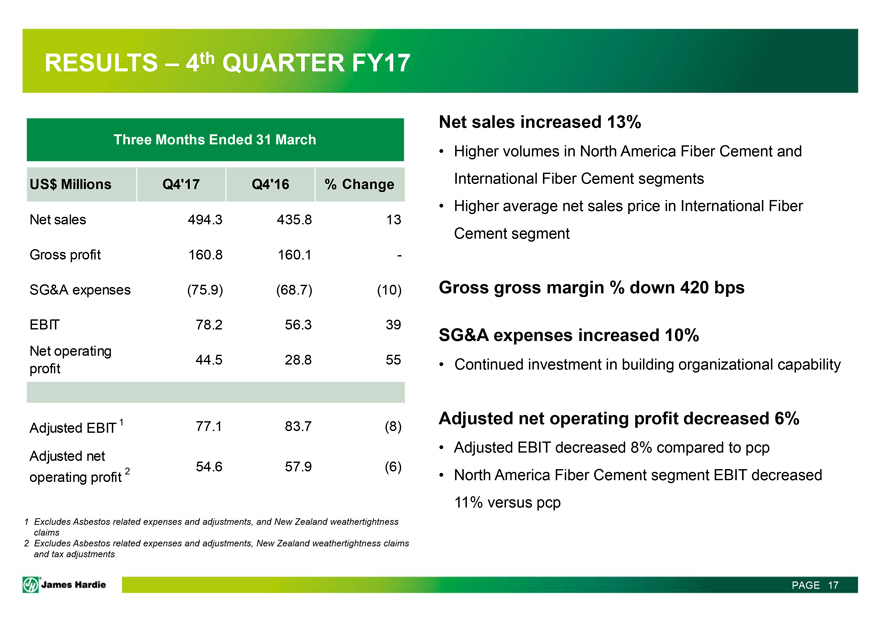
RESULTS – 4th QUARTER FY17
Three Months Ended 31 March
US$ Millions Q4’17 Q4’16 % Change
Net sales 494.3 435.8 13
Gross profit 160.8 160.1 -
SG&A expenses (75.9) (68.7) (10)
EBIT 78.2 56.3 39
Net operating 44.5 28.8 55
profit
Adjusted EBIT 1 77.1 83.7 (8)
Adjusted net
2 54.6 57.9 (6)
operating profit
Net sales increased 13%
Higher volumes in North America Fiber Cement and International Fiber
Cement segments
Higher average net sales price in International Fiber Cement segment
Gross gross margin % down 420 bps
SG&A expenses increased 10%
Continued investment in building organizational capability
Adjusted net operating profit
decreased 6%
Adjusted EBIT decreased 8% compared to pcp
North America Fiber
Cement segment EBIT decreased 11% versus pcp
1 Excludes Asbestos related expenses and adjustments, and New Zealand weathertightness claims
2 Excludes Asbestos related expenses and adjustments, New Zealand weathertightness claims and tax adjustments
JH James Hardie PAGE 17
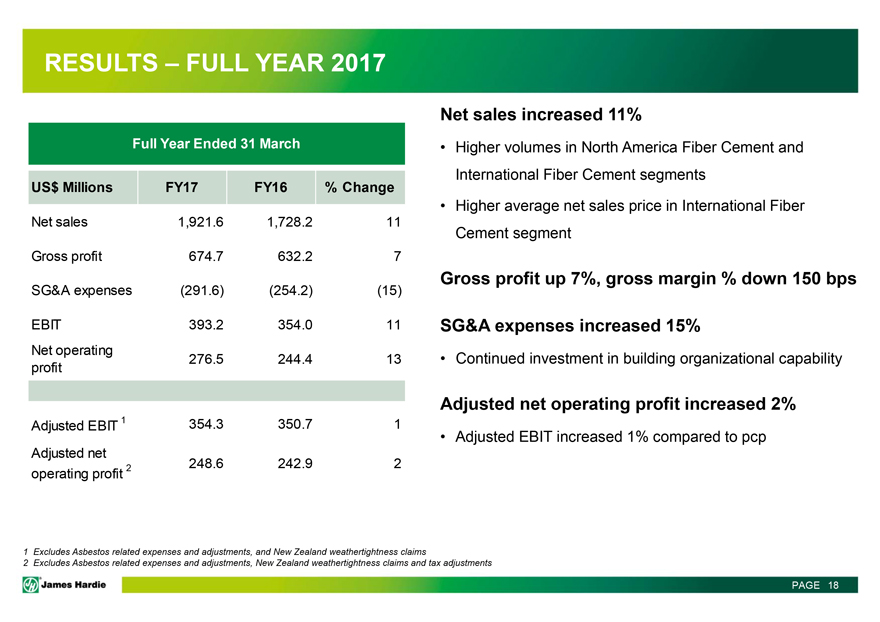
RESULTS – FULL YEAR 2017
Full Year Ended 31 March
US$ Millions FY17 FY16 % Change
Net sales 1,921.6 1,728.2 11
Gross profit 674.7 632.2 7
SG&A expenses (291.6) (254.2) (15)
EBIT 393.2 354.0 11
Net operating profit 276.5 244.4 13
Adjusted EBIT 1 354.3 350.7 1
Adjusted net
2 248.6 242.9 2
operating profit
Net sales increased 11%
Higher volumes in North America Fiber Cement and International Fiber Cement segments
Higher
average net sales price in International Fiber Cement segment
Gross profit up 7%, gross margin % down 150 bps
SG&A expenses increased 15%
Continued investment in building organizational capability
Adjusted net operating profit increased 2%
Adjusted EBIT increased 1%
compared to pcp
1 Excludes Asbestos related expenses and adjustments, and New Zealand weathertightness claims
2 Excludes Asbestos related expenses and adjustments, New Zealand weathertightness claims and tax adjustments
JH James Hardie PAGE 18
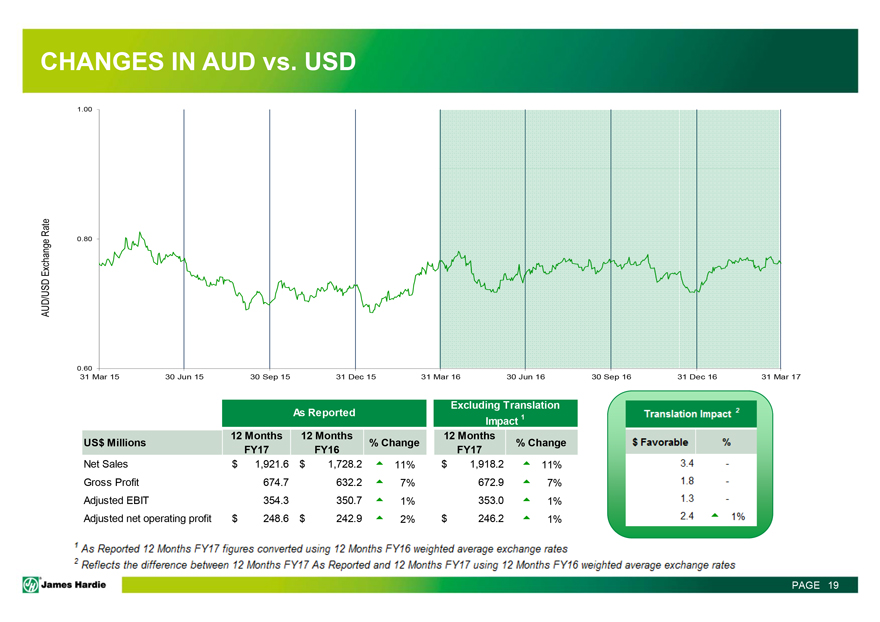
CHANGES IN AUD vs. USD
AUD/USD Exchange Rate
1.00
0.80
0.60
31 Mar 15 30 Jun 15 30 Sep 15 31 Dec 15 31 Mar 16 30 Jun 16 30 Sep 16 31 Dec 16 31 Mar 17
As Reported Excluding Translation Impact 1
US$ Millions % Change 12 Months FY17 12 Months FY16
12 Months FY17 % Change
Net Sales $1,921.6 $1,728.2 11% $1,918.2 11%
Gross
Profit 674.7 632.2 7% 672.9 7%
Adjusted EBIT 354.3 350.7 1% 353.0 1%
Adjusted
net operating profit $248.6 $242.9 2% $246.2 1%
Translation Impact2
$
Favorable %
3.4 -
1.8 -
1.3 -
2.4 1%
1 As Reported 12 Months FY17 figures converted using 12 Months FY16 weighted average exchange rates
2 Reflects the difference between 12 Months FY17 As Reported and 12 Months FY17 using 12 Months FY16 weighted average exchange rates
JH James Hardie PAGE 19
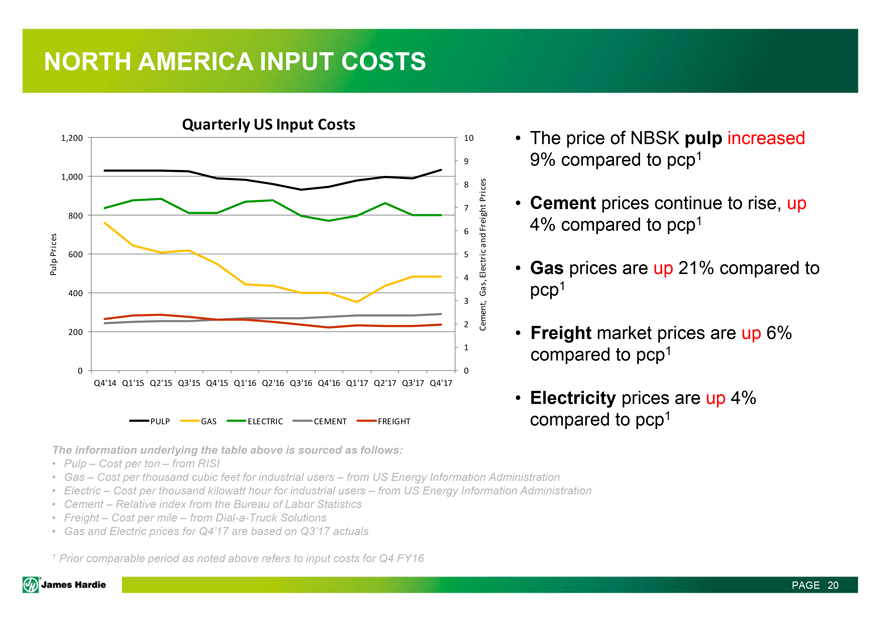
NORTH AMERICA INPUT COSTS
Quarterly US Input Costs
Pulp Prices
Cement, Gas, Electric and Freight Prices
1,200
1,000
800
600
400
200
0
10
9
8
7
6
5
4
3
2
1
0
Q4’14 Q1’15 Q2’15 Q3’15 Q4’15 Q1’16 Q2’16 Q3’16 Q4’16 Q1’17 Q2’17 Q3’17 Q4’17
PULP GAS ELECTRIC CEMENT FREIGHT
The price of NBSK pulp increased 9% compared to pcp1
Cement prices continue to rise, up 4% compared to pcp1
Gas prices are up 21%
compared to pcp1
Freight market prices are up 6% compared to pcp1
Electricity
prices are up 4% compared to pcp1
The information underlying the table above is sourced as follows:
Pulp – Cost per ton – from RISI
Gas – Cost per thousand cubic feet for
industrial users – from US Energy Information Administration
Electric – Cost per thousand kilowatt hour for industrial users – from US Energy
Information Administration
Cement – Relative index from the Bureau of Labor Statistics
Freight – Cost per mile – from Dial-a-Truck Solutions
Gas and Electric prices for
Q4’17 are based on Q3’17 actuals
1 Prior comparable period as noted above refers to input costs for Q4 FY16
JH James Hardie PAGE 20
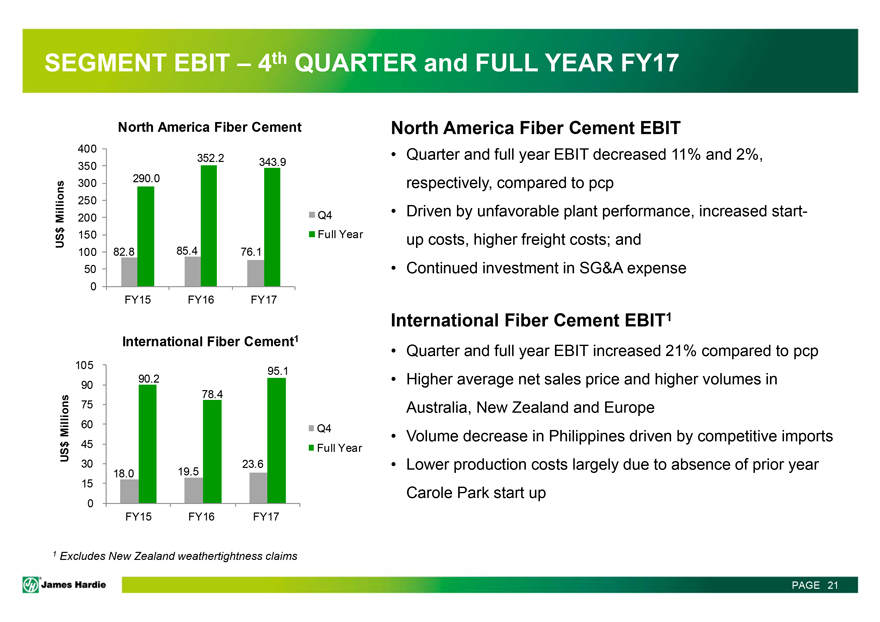
SEGMENT EBIT – 4th QUARTER and FULL YEAR FY17
North America Fiber Cement
US$ Millions
400
350
300
250
200
150
100
50
0
352.2 343.9 290.0 82.8 85.4 76.1
FY15 FY16 FY17
Q4
Full Year
International Fiber Cement1
US$ Millions
105
90
75
60
45
30
15
0
95.1 90.2 78.4 23.6 18.0 19.5
FY15 FY16 FY17
Q4
Full Year
North America Fiber Cement EBIT
Quarter and full year EBIT decreased 11% and 2%, respectively,
compared to pcp
Driven by unfavorable plant performance, increased startup costs, higher freight costs; and
Continued investment in SG&A expense
International Fiber Cement EBIT1
Quarter and full year EBIT increased 21% compared to pcp
Higher average net sales price and
higher volumes in Australia, New Zealand and Europe
Volume decrease in Philippines driven by competitive imports
Lower production costs largely due to absence of prior year Carole Park start up
1 Excludes
New Zealand weathertightness claims
JH James Hardie PAGE 21
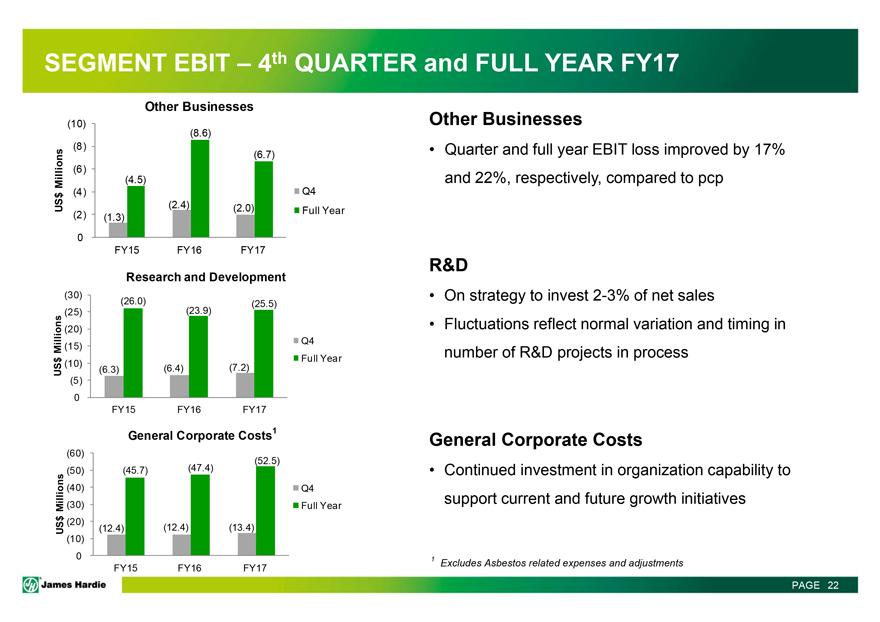
SEGMENT EBIT – 4th QUARTER and FULL YEAR FY17
Other Businesses
US$ Millions
(10)
(8)
(6)
(4)
(2)
0
(8.6) (6.7) (4.5) (2.4) (2.0) (1.3)
FY15 FY16 FY17
Q4
Full Year
Research and Development
US$ Millions
(30)
(25)
(20)
(15)
(10)
(5)
0
(26.0) (25.5) (23.9) (6.3) (6.4) (7.2)
FY15 FY16 FY17
Q4
Full Year
General Corporate Costs1
US$ Millions
(60)
(50)
(40)
(30)
(20)
(10)
0
(52.5) (45.7) (47.4) (12.4) (12.4) (13.4)
FY15 FY16 FY17
Q4
Full Year
Other Businesses
Quarter and full year EBIT loss improved by 17% and 22%, respectively,
compared to pcp
R&D
On strategy to invest 2-3% of net sales
Fluctuations reflect normal variation and timing in number of R&D projects in process
General Corporate Costs
Continued investment in organization capability to
support current and future growth initiatives
1 Excludes Asbestos related expenses and adjustments
JH James Hardie PAGE 22
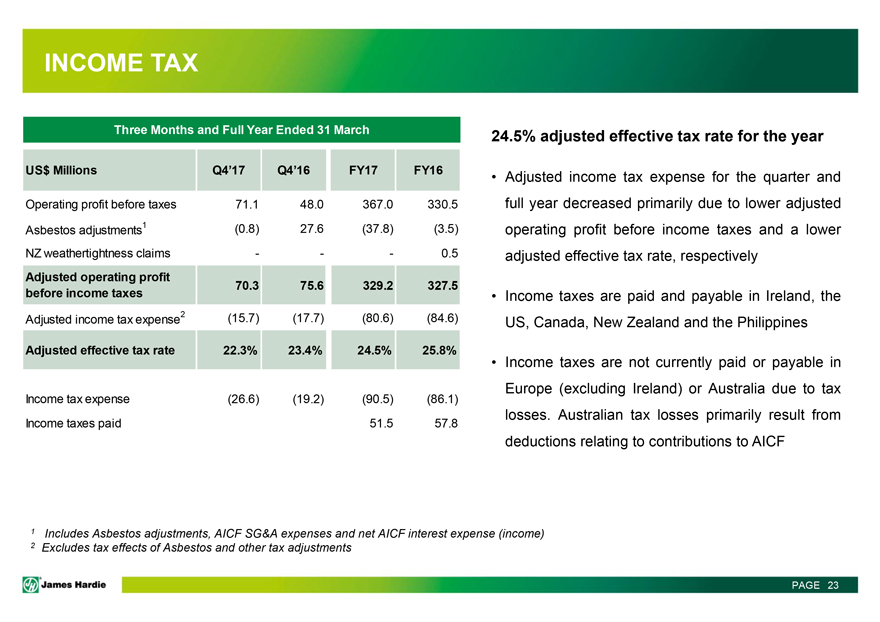
INCOME TAX
Three Months
and Full Year Ended 31 March US$ Millions Q4’17 Q4’16 FY17 FY16 Operating profit before taxes 71.1 48.0 367.0 330.5 Asbestos adjustments1 (0.8) 27.6 (37.8) (3.5) NZ weathertightness claims — —
— 0.5 Adjusted operating profit before income taxes 70.3 75.6 329.2 327.5 Adjusted income tax expense2 (15.7) (17.7) (80.6) (84.6) Adjusted effective tax rate 22.3% 23.4% 24.5% 25.8% Income tax expense (26.6) (19.2) (90.5) (86.1)
Income taxes paid 51.5 57.8
24.5% adjusted effective tax rate for the year
Adjusted income tax expense for the quarter and full year decreased primarily due to lower adjusted operating profit before income taxes and a lower adjusted
effective tax rate, respectively
Income taxes are paid and payable in Ireland, the US, Canada, New Zealand and the Philippines
Income taxes are not currently paid or payable in Europe (excluding Ireland) or Australia due to tax losses. Australian tax losses primarily result from deductions relating to
contributions to AICF
1 Includes Asbestos adjustments, AICF SG&A expenses and net AICF interest expense (income)
2 Excludes tax effects of Asbestos and other tax adjustments
JH James Hardie PAGE 23
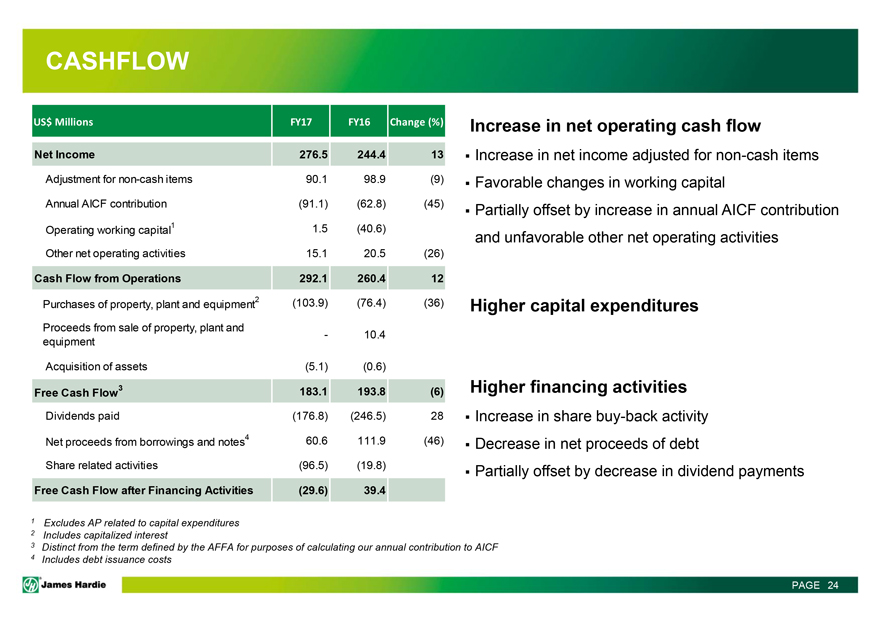
CASHFLOW
US$ Millions
FY17 FY16 Change (%) Net Income 276.5 244.4 13 Adjustment for non-cash items 90.1 98.9 (9) Annual AICF contribution (91.1) (62.8) (45) Operating working capital1 1.5 (40.6) Other net operating activities 15.1 20.5 (26) Cash Flow from Operations
292.1 260.4 12 Purchases of property, plant and equipment2 (103.9) (76.4) (36) Proceeds from sale of property, plant and equipment — 10.4 Acquisition of assets (5.1) (0.6) Free Cash Flow3 183.1 193.8 (6) Dividends paid (176.8) (246.5) 28 Net
proceeds from borrowings and notes4 60.6 111.9 (46) Share related activities (96.5) (19.8) Free Cash Flow after Financing Activities (29.6) 39.4
Increase in net
operating cash flow
Increase in net income adjusted for non-cash items
Favorable changes in working capital
Partially offset by increase in annual
AICF contribution and unfavorable other net operating activities
Higher capital expenditures
Higher financing activities
Increase in share buy-back activity
Decrease in net proceeds of debt
Partially offset by decrease in dividend payments
1 Excludes AP related to capital expenditures
2 Includes capitalized interest
3 Distinct from the term defined by the AFFA for purposes of calculating our annual contribution to AICF
4 Includes debt issuance costs
JH James Hardie PAGE 24
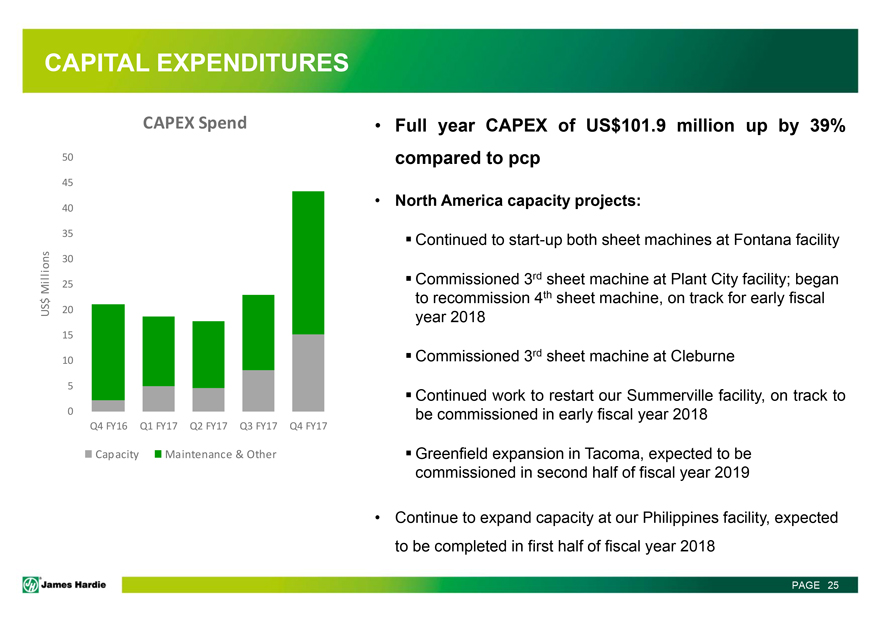
CAPITAL EXPENDITURES
CAPEX Spend
US$ Millions
50
45
40
35
30
25
20
15
10
5
0
Q4 FY16 Q1 FY17 Q2 FY17 Q3 FY17 Q4 FY17
Capacity Maintenance & Other
Full year CAPEX of US$101.9 million up by 39% compared to pcp
North America capacity projects:
Continued to start-up both sheet machines at
Fontana facility
Commissioned 3rd sheet machine at Plant City facility; began to recommission 4th sheet machine, on track for early fiscal year 2018
Commissioned 3rd sheet machine at Cleburne
Continued work to restart our Summerville facility,
on track to be commissioned in early fiscal year 2018
Greenfield expansion in Tacoma, expected to be commissioned in second half of fiscal year 2019
Continue to expand capacity at our Philippines facility, expected to be completed in first half of fiscal year 2018
JH James Hardie PAGE 25
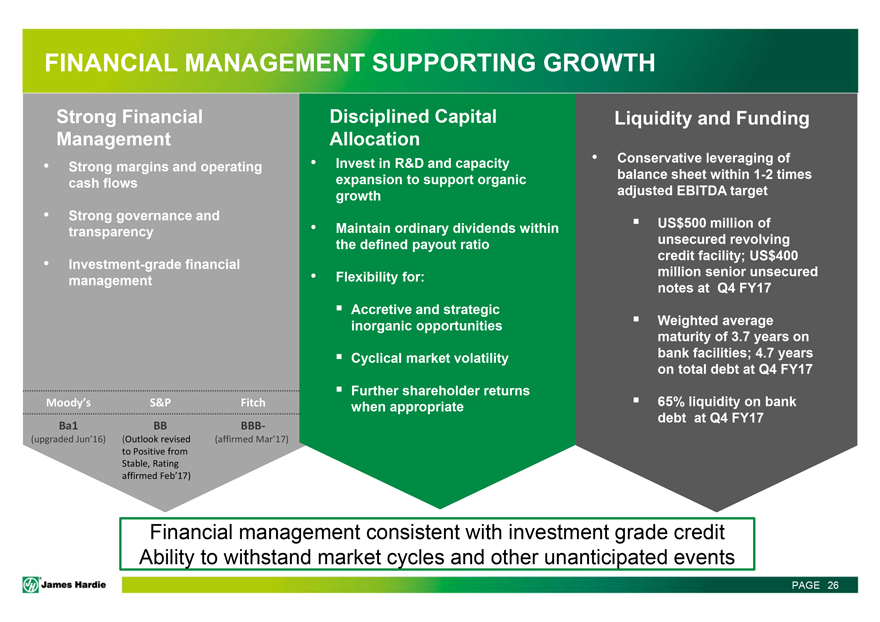
FINANCIAL MANAGEMENT SUPPORTING GROWTH
Strong Financial Management
Strong margins and operating cash flows
Strong governance and transparency
Investment-grade financial management
Moody’s Ba1 (upgraded Jun’16) S&P BB (Outlook revised to Positive from Stable, Rating affirmed Feb’17) Fitch BBB- (affirmed Mar’17)
Disciplined Capital Allocation
Invest in R&D and capacity expansion to support organic
growth
Maintain ordinary dividends within the defined payout ratio
Flexibility for:
Accretive and strategic inorganic opportunities
Cyclical market volatility Further shareholder returns when appropriate
Liquidity and Funding
Conservative leveraging of balance sheet within 1-2 times adjusted EBITDA target
US$500 million of unsecured revolving credit facility; US$400 million senior unsecured notes at Q4 FY17
Weighted average maturity of 3.7 years on bank facilities; 4.7 years on total debt at Q4 FY17
65% liquidity on bank debt at Q4 FY17
Financial management consistent with
investment grade credit Ability to withstand market cycles and other unanticipated events
JH James Hardie PAGE 26
LIQUIDITY PROFILE
Debt
Profile
US$ Millions
$2501 $500 $400 2 $175 $400
Available Debt Outstanding at 31 March 2017
Senior Notes Bank Facilities Accordion
US$175m bank facilities drawn at Q4 FY17; US$78.9m held in cash
1 Incremental liquidity of up
to US$250 million may be accessed via an accordion feature, which is provided for under the terms of the syndicated revolving credit facility agreement, but not credit approved
2 Callable from 15 February 2018; callable at par from 15 February 2021
3 Excludes Short-term
debt – Asbestos; includes unamortized OID ($1.9 million); bond premium ($2.0 million) and debt issuance costs ($10.6 million)
Strong balance sheet
US$78.9 million cash
US$485.6 million net debt3 at 31 March 2017
65% liquidity on bank debt at 31 March 2017
Corporate debt structure
US$500 million unsecured revolving credit facility, with a December 2020 maturity
US$400
million senior unsecured notes2 maturing February 2023
Leverage strategy
1.1x
net debt to EBITDA excluding asbestos; within the 1-2x leverage target range
JH James Hardie PAGE 27
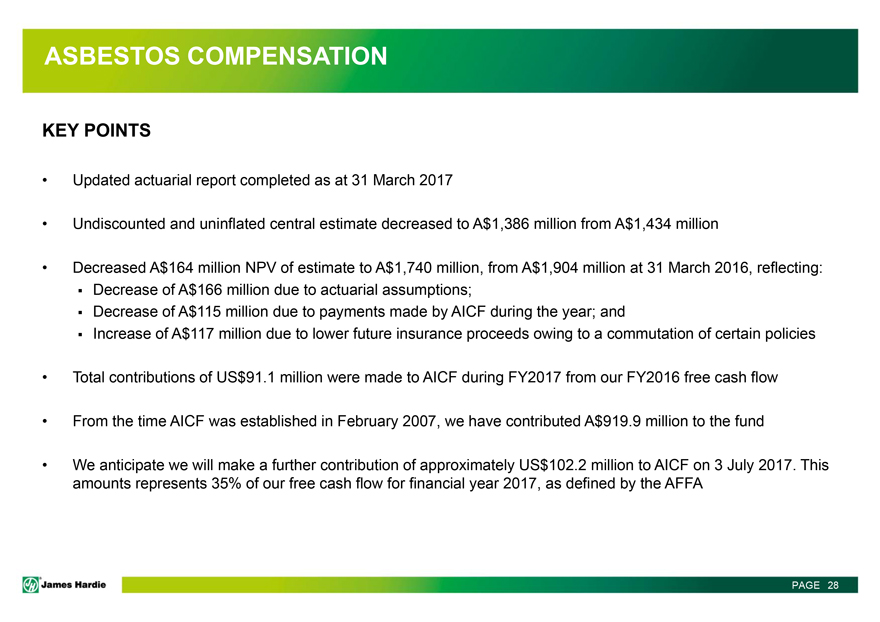
ASBESTOS COMPENSATION
KEY
POINTS
Updated actuarial report completed as at 31 March 2017
Undiscounted and uninflated central estimate decreased to A$1,386 million from A$1,434 million
Decreased A$164 million NPV of estimate to A$1,740 million, from A$1,904 million at 31 March 2016, reflecting:
Decrease of A$166 million due to actuarial assumptions;
Decrease of A$115 million
due to payments made by AICF during the year; and
Increase of A$117 million due to lower future insurance proceeds owing to a commutation of certain policies
Total contributions of US$91.1 million were made to AICF during FY2017 from our FY2016 free cash flow
From the time AICF was established in February 2007, we have contributed A$919.9 million to the fund
We anticipate we will make a further contribution of approximately US$102.2 million to AICF on 3 July 2017. This amounts represents 35% of our free cash flow for
financial year 2017, as defined by the AFFA
JH James Hardie PAGE 28
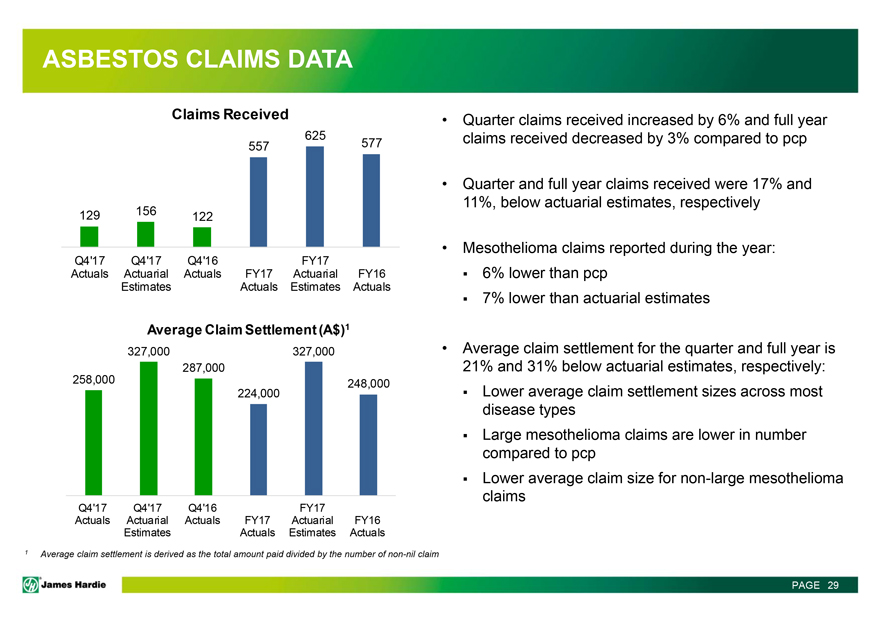
ASBESTOS CLAIMS DATA
Claims Received
625
557 577
129 156 122
Q4’17 Actuals
Q4’17 Actuarial Estimates
Q4’16 Actuals
FY17 Actuals
FY17 Actuarial Estimates
FY16 Actuals
Average Claim Settlement (A$)1
327,000 327,000
287,000
258,000 248,000
224,000
Q4’17 Actuals
Q4’17 Actuarial Estimates
Q4’16 Actuals
FY17 Actuals
FY17 Actuarial Estimates
FY16 Actuals
1 Average claim settlement is derived as the total amount paid divided by the
number of non-nil claim
Quarter claims received increased by 6% and full year claims received decreased by 3% compared to
pcp
Quarter and full year claims received were 17% and 11%, below actuarial estimates, respectively
Mesothelioma claims reported during the year:
6% lower than pcp
7% lower than actuarial estimates
Average claim settlement for the quarter and full year is
21% and 31% below actuarial estimates, respectively:
Lower average claim settlement sizes across most disease types
Large mesothelioma claims are lower in number compared to pcp
Lower average claim size for non-large mesothelioma claims
JH James Hardie PAGE 29
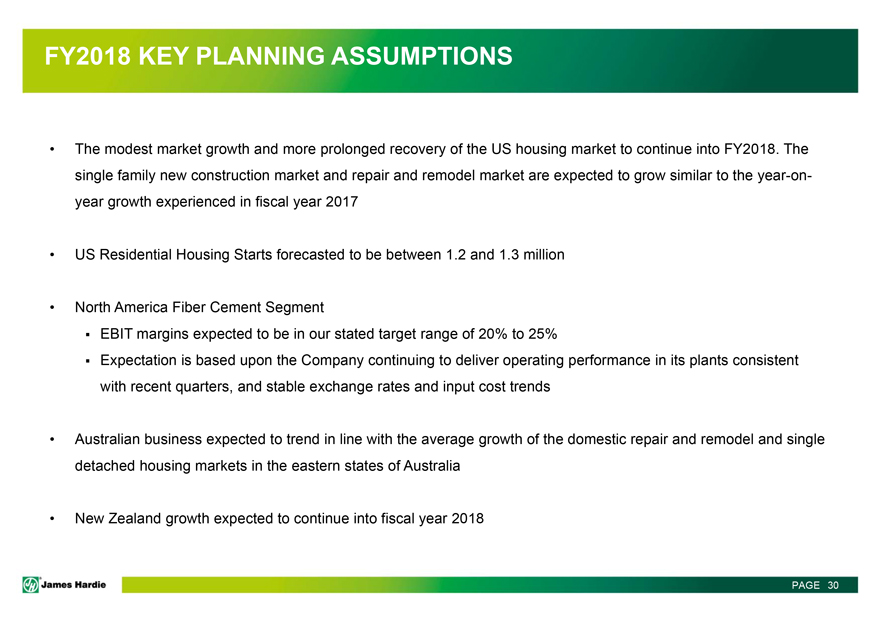
FY2018 KEY PLANNING ASSUMPTIONS
The modest market growth and more prolonged recovery of the US housing market to continue into FY2018. The single family new construction market and repair and remodel market are
expected to grow similar to the year-on-year growth experienced in fiscal year 2017
US Residential Housing Starts forecasted to be between 1.2 and 1.3 million
North America Fiber Cement Segment
EBIT margins expected to be in our stated
target range of 20% to 25%
Expectation is based upon the Company continuing to deliver operating performance in its plants consistent with recent quarters, and
stable exchange rates and input cost trends
Australian business expected to trend in line with the average growth of the domestic repair and remodel and single
detached housing markets in the eastern states of Australia
New Zealand growth expected to continue into fiscal year 2018
JH James Hardie PAGE 30
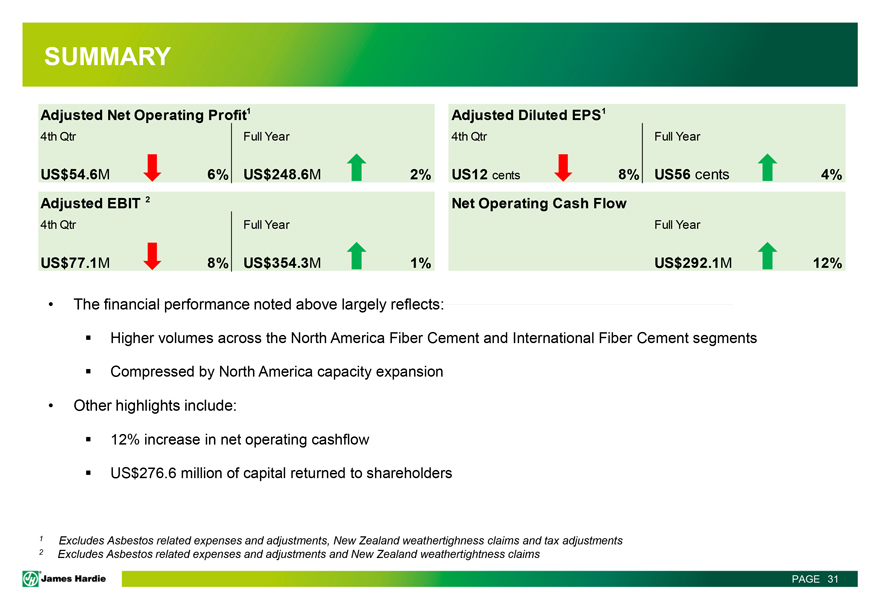
SUMMARY
Adjusted Net
Operating Profit1
4th Qtr Full Year
US$54.6M 6% US$248.6M 2%
Adjusted EBIT 2
4th Qtr Full Year
US$77.1M 8% US$354.3M 1%
Adjusted Diluted EPS1
4th Qtr Full Year
US12 cents 8% US56 cents 4%
Net Operating Cash Flow
Full Year
US$292.1M 12%
The financial performance noted above largely reflects:
Higher volumes across the North America Fiber Cement and International Fiber Cement segments
Compressed by North America capacity expansion
Other highlights include:
12% increase in net operating cashflow
US$276.6 million of capital
returned to shareholders
1 Excludes Asbestos related expenses and adjustments, New Zealand weathertighness claims and tax adjustments
2 Excludes Asbestos related expenses and adjustments and New Zealand weathertightness claims
JH James Hardie PAGE 31

JH James Hardie
QUESTIONS
JH James Hardie
APPENDIX
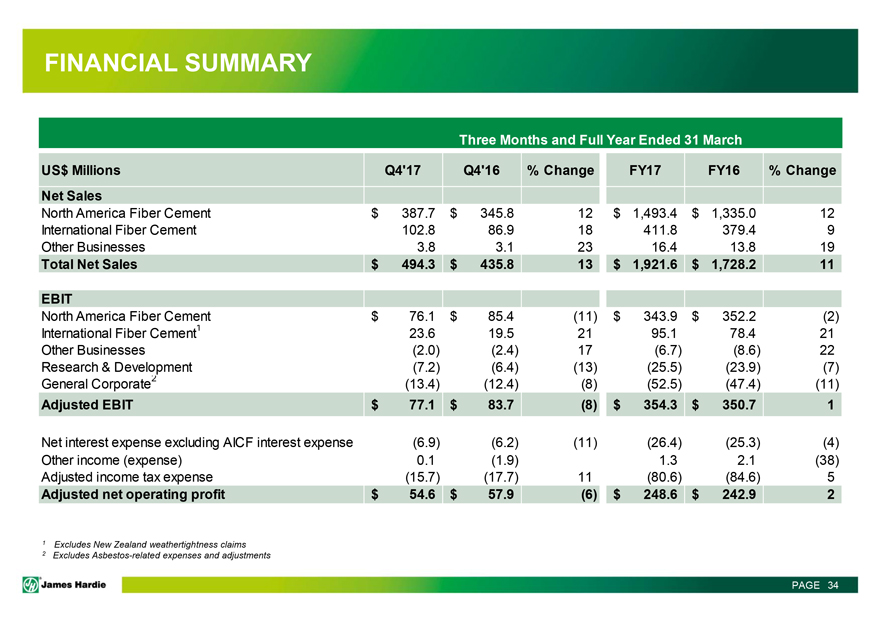
FINANCIAL SUMMARY
Three
Months and Full Year Ended 31 March
US$ Millions Q4’17 Q4’16 % Change FY17 FY16 % Change
Net Sales
North America Fiber Cement $ 387.7 $ 345.8 12 $ 1,493.4 $ 1,335.0 12
International Fiber Cement 102.8 86.9 18 411.8 379.4 9
Other Businesses 3.8 3.1 23 16.4 13.8
19
Total Net Sales $ 494.3 $ 435.8 13 $ 1,921.6 $ 1,728.2 11
EBIT
North America Fiber Cement $ 76.1 $ 85.4 (11) $ 343.9 $ 352.2 (2)
International Fiber Cement1
23.6 19.5 21 95.1 78.4 21
Other Businesses (2.0) (2.4) 17 (6.7) (8.6) 22
Research & Development (7.2) (6.4) (13) (25.5) (23.9) (7)
General
Corporate2 (13.4) (12.4) (8) (52.5) (47.4) (11)
Adjusted EBIT $ 77.1 $ 83.7 (8) $ 354.3 $ 350.7 1
Net interest expense excluding AICF interest expense (6.9) (6.2) (11) (26.4) (25.3) (4)
Other
income (expense) 0.1 (1.9) 1.3 2.1 (38)
Adjusted income tax expense (15.7) (17.7) 11 (80.6) (84.6) 5
Adjusted net operating profit $ 54.6 $ 57.9 (6) $ 248.6 $ 242.9 2
1 Excludes New Zealand
weathertightness claims
2 Excludes Asbestos-related expenses and adjustments
JH James Hardie PAGE 34
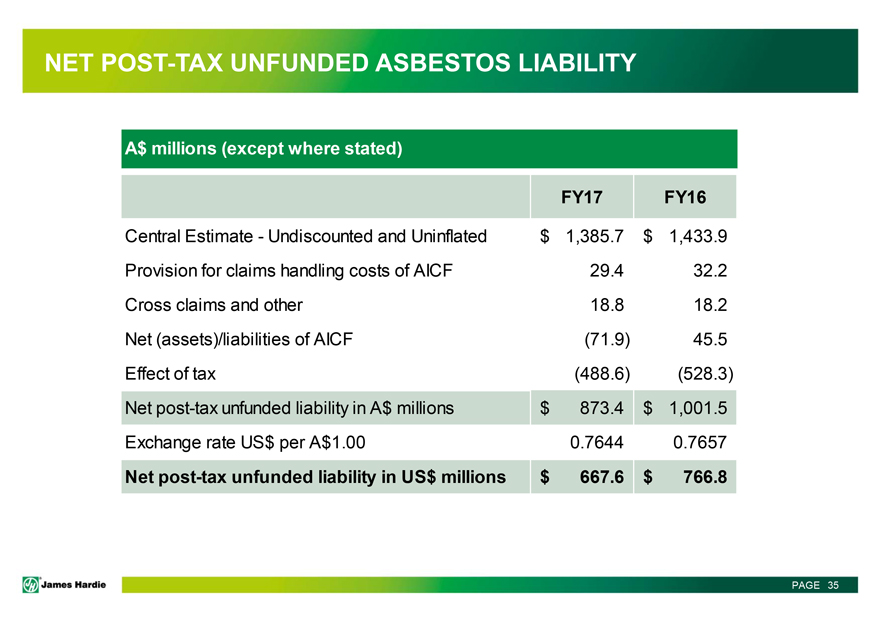
NET POST-TAX UNFUNDED ASBESTOS LIABILITY
A$ millions (except where stated)
FY17 FY16
Central Estimate - Undiscounted and Uninflated $ 1,385.7 $ 1,433.9
Provision for claims
handling costs of AICF 29.4 32.2
Cross claims and other 18.8 18.2
Net
(assets)/liabilities of AICF (71.9) 45.5
Effect of tax (488.6) (528.3)
Net post-tax unfunded liability in A$ millions $ 873.4 $ 1,001.5
Exchange rate US$ per A$1.00 0.7644 0.7657
Net post-tax unfunded liability in US$ millions $ 667.6 $ 766.8
JH James Hardie PAGE 35
ASBESTOS CASH MOVEMENTS FOR FULL YEAR ENDED 31 MARCH
A$ millions
AICF cash and investments - 31 March 2016 $ 22.2
Contributions to AFFA by James Hardie 120.7
Insurance recoveries 122.3
Loan drawdowns 101.6
Loan repayments (99.4)
Interest expense, net (1.4)
Claims paid (120.5)
Operating costs (3.7)
Other 0.6
AICF cash and investments - 31 March 2017 $ 142.4
JH James Hardie PAGE 36
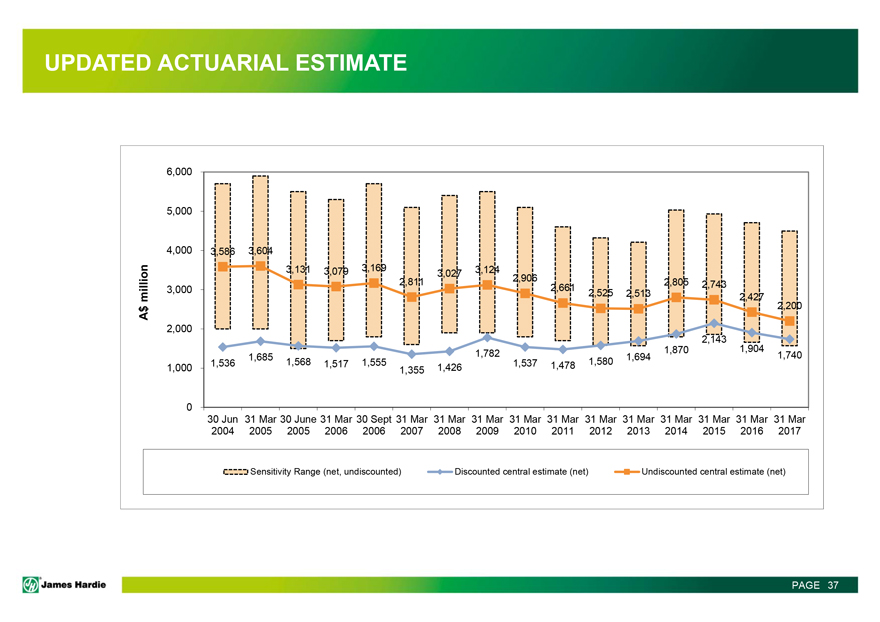
UPDATED ACTUARIAL ESTIMATE
A$ million
6,000
5,000
4,000
3,000
2,000
1,000
0
3,586 3,604
3,131 3,079 3,169 3,027 3,124 2,906
2,811 2,661 2,805 2,743
2,525 2,513 2,427
2,200
2,143
1,782 1,870 1,904
1,685 1,694 1,740
1,536 1,568 1,517 1,555 1,355 1,426 1,537 1,478 1,580
30 Jun 31 Mar 30 June 31 Mar 30
Sept 31 Mar 31 Mar 31 Mar 31 Mar 31 Mar 31 Mar 31 Mar 31 Mar 31 Mar 31 Mar 31 Mar
2004 2005 2005 2006 2006 2007 2008 2009 2010 2011 2012 2013 2014 2015 2016 2017
Sensitivity Range (net, undiscounted) Discounted central estimate (net) Undiscounted central estimate (net)
JH James Hardie PAGE 37
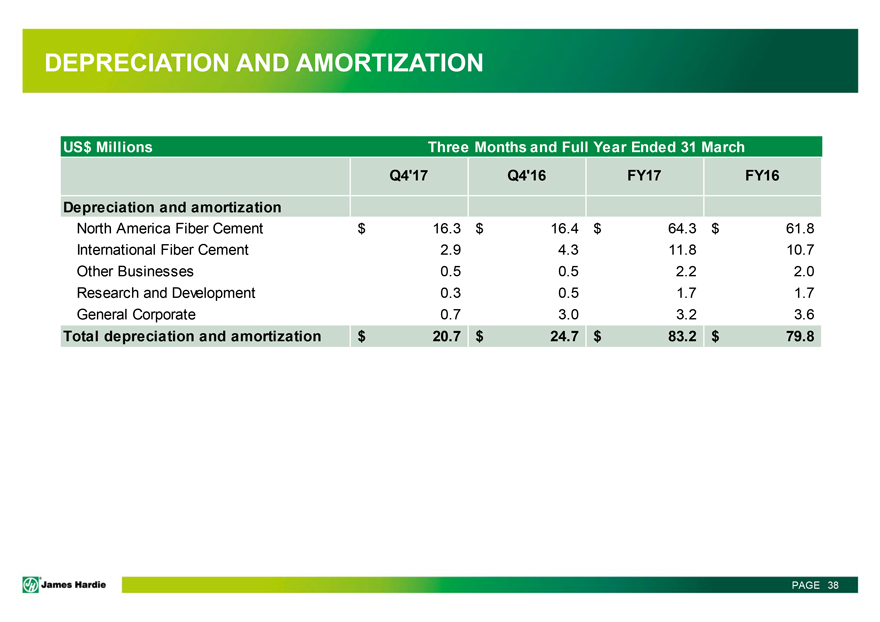
DEPRECIATION AND AMORTIZATION
US$ Millions Three Months and Full Year Ended 31 March
Q4’17 Q4’16 FY17 FY16
Depreciation and amortization
North America Fiber Cement $16.3 $16.4 $64.3
$61.8
International Fiber Cement 2.9 4.3 11.8 10.7
Other Businesses 0.5 0.5
2.2 2.0
Research and Development 0.3 0.5 1.7 1.7
General Corporate 0.7 3.0
3.2 3.6
Total depreciation and amortization $20.7 $24.7 $83.2 $79.8
JH James
Hardie PAGE 38
DEFINITIONS AND OTHER TERMS
This Management Presentation forms part of a package of information about the company’s results. It should be read in conjunction with the other parts of this
package, including the Management’s Analysis of Results, Media Release and Consolidated Financial Statements
Definitions
Non-financial Terms
AFFA – Amended and Restated
Final Funding Agreement
AICF – Asbestos Injuries Compensation Fund Ltd
Legacy New Zealand weathertightness claims (“New Zealand weathertightness claims”) – Expenses arising from defending and resolving claims in New
Zealand that allege poor building design, inadequate certification review and compliance certification and deficient work by sub-contractors
JH James Hardie PAGE 39
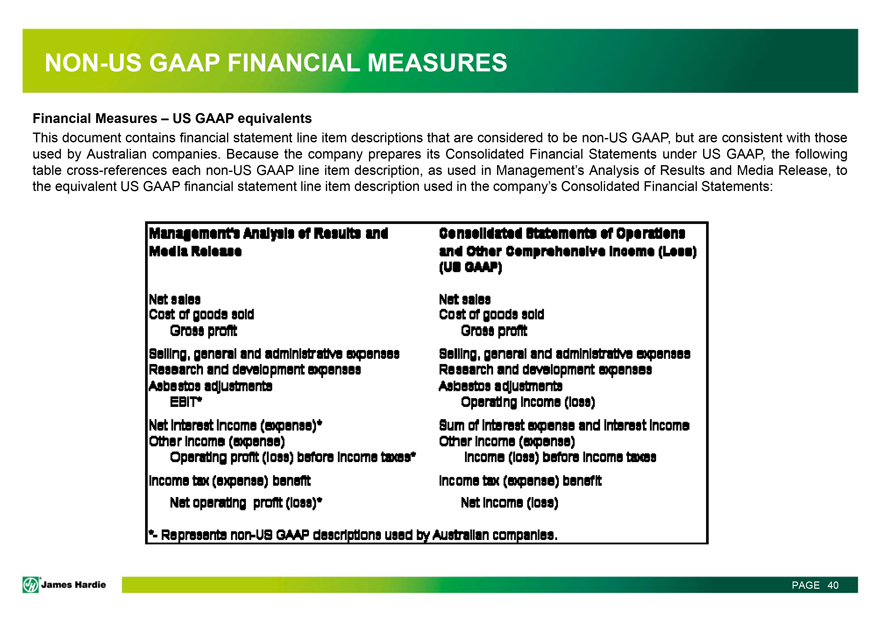
NON-US GAAP FINANCIAL MEASURES
Financial Measures – US GAAP equivalents
This document contains financial statement
line item descriptions that are considered to be non-US GAAP, but are consistent with those used by Australian companies. Because the company prepares its Consolidated Financial Statements under US GAAP,
the following table cross-references each non-US GAAP line item description, as used in Management’s Analysis of Results and Media Release, to the equivalent US GAAP financial statement line item
description used in the company’s Consolidated Financial Statements:
Management’s Analysis of Results and Media Release
Net sales
Cost of goods sold
Gross profit
Selling, general and administrative expenses
Research and development expenses
Asbestos adjustments
EBIT*
Net Interest Income (expense)*
Other Income (expense)
Operating profit (loss) before income taxes*
Income tax (expense) benefit
Net operating profit (loss)*
* Represents non-US GAAP descriptions used by Australian companies.
Consolidated Statements of Operations and Other Comprehensive Income (Loss) (US GAAP)
Net
sales
Cost of goods sold
Gross profit
Selling, general and administrative expenses
Research and development expenses
Abestos Adjustments
Operating income (loss)
Sum of interest expense and interest income
Other income (expense)
Income (loss) before income taxes
Income tax (expense) benefit
Net Income (loss)
JH James Hardie PAGE 40
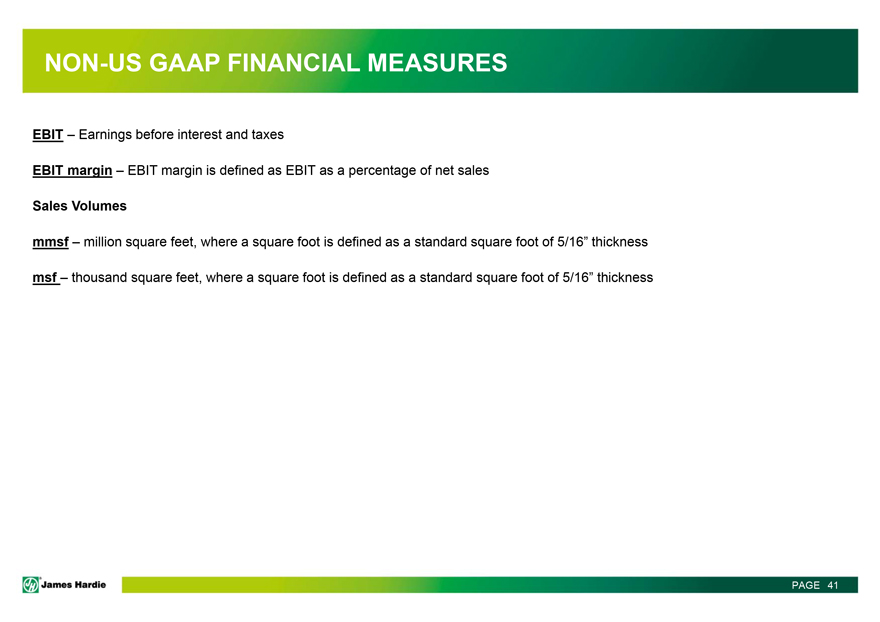
NON-US GAAP FINANCIAL MEASURES
EBIT – Earnings before interest and taxes
EBIT margin – EBIT margin is defined as
EBIT as a percentage of net sales
Sales Volumes
mmsf – million square
feet, where a square foot is defined as a standard square foot of 5/16” thickness
msf – thousand square feet, where a square foot is defined as a
standard square foot of 5/16” thickness
JH James Hardie PAGE 41
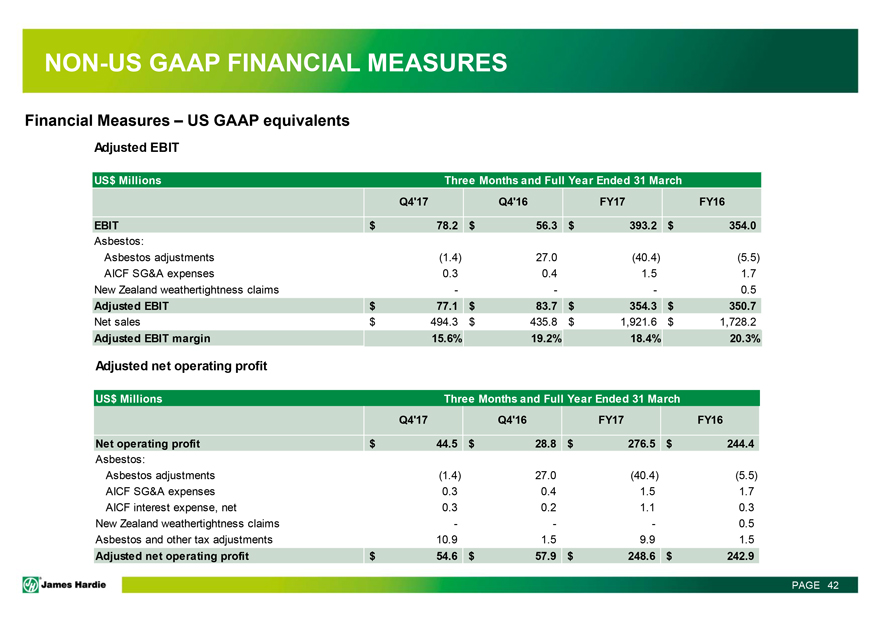
NON-US GAAP FINANCIAL MEASURES
Financial Measures – US GAAP equivalents
Adjusted EBIT
US$ Millions Three Months and Full Year Ended 31 March
Q4’17 Q4’16 FY17 FY16
EBIT $78.2 $56.3 $393.2 $354.0
Asbestos:
Asbestos adjustments (1.4) 27.0 (40.4) (5.5)
AICF SG&A expenses 0.3 0.4 1.5 1.7
New Zealand weathertightness claims - - - 0.5
Adjusted EBIT $77.1 $83.7
$354.3 $350.7
Net sales $494.3 $435.8 $1,921.6 $1,728.2
Adjusted EBIT margin
15.6% 19.2% 18.4% 20.3%
Adjusted net operating profit
US$ Millions Three
Months and Full Year Ended 31 March
Q4’17 Q4’16 FY17 FY16
Net
operating profit $44.5 $28.8 $276.5 $ 244.4
Asbestos:
Asbestos adjustments
(1.4) 27.0 (40.4) (5.5)
AICF SG&A expenses 0.3 0.4 1.5 1.7
AICF interest
expense, net 0.3 0.2 1.1 0.3
New Zealand weathertightness claims - - - 0.5
Asbestos and other tax adjustments 10.9 1.5 9.9 1.5
Adjusted net operating
profit $54.6 $57.9 $248.6 $ 242.9
JH James Hardie PAGE 42
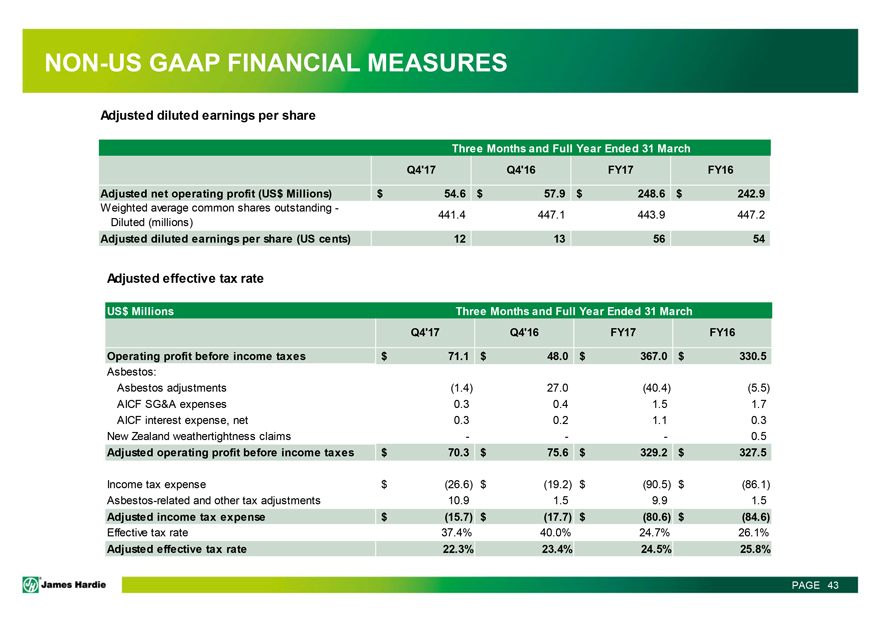
NON-US GAAP FINANCIAL MEASURES
Adjusted diluted earnings per share
Three Months and Full Year Ended 31 March
Q4’17 Q4’16 FY17 FY16
Adjusted net operating profit (US$ Millions) $ 54.6 $57.9
$248.6 $242.9
Weighted average common shares outstanding - Diluted (millions) 441.4 447.1 443.9 447.2
Adjusted diluted earnings per share (US cents) 12 13 56 54
Adjusted effective tax rate
US$ Millions Three Months and Full Year Ended 31 March
Q4’17
Q4’16 FY17 FY16
Operating profit before income taxes $71.1 $48.0 $367.0 $330.5
Asbestos:
Asbestos adjustments (1.4) 27.0 (40.4) (5.5)
AICF SG&A expenses 0.3 0.4 1.5 1.7
AICF interest expense, net 0.3 0.2 1.1 0.3
New Zealand weathertightness claims - - - 0.5
Adjusted operating profit before income taxes
$70.3 $75.6 $329.2 $327.5
Income tax expense $(26.6) $(19.2) $(90.5) $(86.1)
Asbestos-related and other tax adjustments 10.9 1.5 9.9 1.5
Adjusted income
tax expense $(15.7) $(17.7) $(80.6) $(84.6)
Effective tax rate 37.4% 40.0% 24.7% 26.1%
Adjusted effective tax rate 22.3% 23.4% 24.5% 25.8%
JH James Hardie PAGE 43
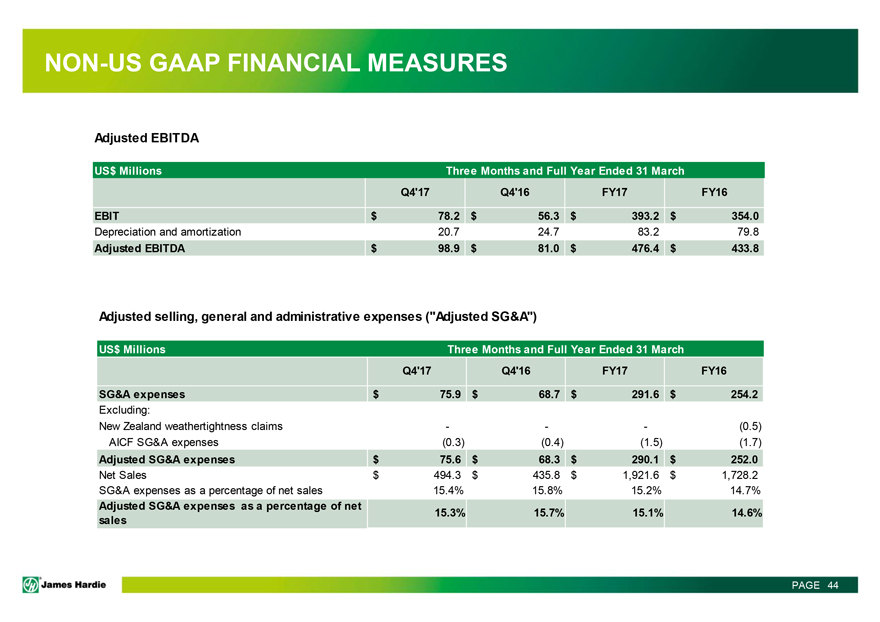
NON-US GAAP FINANCIAL MEASURES
Adjusted EBITDA
US$ Millions Three Months and Full Year Ended 31 March
Q4’17 Q4’16 FY17 FY16
EBIT $78.2 $56.3 $393.2 $354.0
Depreciation and amortization 20.7 24.7 83.2 79.8
Adjusted EBITDA $98.9 $81.0 $476.4 $433.8
Adjusted selling, general and administrative expenses (“Adjusted SG&A”)
US$ Millions Three Months and Full Year Ended 31 March
Q4’17 Q4’16 FY17 FY16
SG&A expenses $75.9 $68.7 $291.6 $254.2
Excluding:
New Zealand weathertightness claims - - - (0.5)
AICF SG&A expenses (0.3) (0.4) (1.5) (1.7)
Adjusted SG&A expenses $75.6 $68.3 $290.1 $252.0
Net Sales $494.3 $435.8
$1,921.6 $1,728.2
SG&A expenses as a percentage of net sales 15.4% 15.8% 15.2% 14.7%
Adjusted SG&A expenses as a percentage of net 15.3% 15.7% 15.1% 14.6%
sales
JH James Hardie PAGE 44

JH James Hardie
Q4 FY17
MANAGEMENT PRESENTATION
18 May 2017