Exhibit 99.6
KPMG
Valuation of Asbestos-Related Disease
Liabilities of former James Hardie entities (“the Liable Entites”) to be met by the AICF Trust
Prepared for Asbestos Injuries Compensation Fund Limited
(“AICF”)
As at 31 March 2017
18 May 2017
KPMG
KPMG Actuarial Pty Ltd
ABN: 91 144 686 046
Australian Financial Services Licence No. 392050
Telephone: +61 2 9335 7000
International Towers 3 Sydney
Facsimile: +61 2 9335 7001
300 Barangaroo Ave
DX: 1056 Sydney
Sydney NSW 2000
www.kpmg.com.au
PO Box H67
Australia Square NSW 1215
Australia
18 May 2017
Narreda Grimley
General Manager
Asbestos Injuries Compensation Fund Limited
Suite 1, Level 6, 56 Clarence Street
Sydney NSW 2000
Cc Matthew Marsh, Chief Financial Officer, James Hardie Industries plc
Karen Smith, Executive
Director, Legal, Department of Premier and Cabinet, The State of
New South Wales
The Board of Directors, Asbestos Injuries Compensation Fund Limited
Dear Narreda
Valuation of Asbestos-Related Disease Liabilities of former James Hardie entities (“The Liable Entities”) to be met by the AICF Trust
We are pleased to provide you with our Annual Actuarial Report relating to the asbestos-related disease liabilities of the Liable Entities which are to be met by the AICF Trust.
The report is effective as at 31 March 2017 and has taken into account claims data and information provided to us by AICFL as at 31 March 2017.
If you have any questions with respect to the contents of this report, please do not hesitate to contact us.
Yours sincerely
Neil Donlevy MA FIA FIAA Jefferson Gibbs BSc FIA FIAA Executive, KPMG
Actuarial Pty Ltd Executive, KPMG Actuarial Pty Ltd
Fellow of the Institute of Actuaries (London) Fellow of the Institute of Actuaries (London) Fellow of the
Institute of Actuaries of Fellow of the Institute of Actuaries of Australia Australia
© 2017 KPMG Actuarial Pty Ltd is affiliate of KPMG. KPMG is an
Australian partnership and a member firm of the KPMG network of independent member firms affiliated with KPMG International Cooperative (“KPMG International”), a Swiss entity. All rights reserved. The KPMG name, logo and “cutting
through complexity’ are registered trademarks of KPMG International. Liability limited by a scheme approved under Professional Standards Legislation
Executive Summary
Important Note: Basis of Report
This valuation report (“the Report”) has been prepared by KPMG Actuarial Pty Ltd (ABN 91 144 686 046) (“KPMG Actuarial”) in accordance with an
“Amended and Restated Final Funding Agreement in respect of the provision of long-term funding for compensation arrangements for certain victims of Asbestos-related diseases in Australia” (hereafter referred to as the “the Amended
Final Funding Agreement”) between James Hardie Industries NV (now known as James Hardie Industries plc) (hereafter referred to as “James Hardie”), James Hardie 117 Pty Limited, the State of New South Wales and Asbestos Injuries
Compensation Fund Limited (“AICFL”) which was signed on 21 November 2006.
This Report is intended to meet the requirements of the Amended Final
Funding Agreement and values the asbestos-related disease liabilities of the Liable Entities to be met by the AICF Trust.
This Report is not intended to be used
for any other purpose and may not be suitable, and should not be used, for any other purpose. Opinions and estimates contained in the Report constitute our judgment as of the date of the Report.
The information contained in this Report is of a general nature and is not intended to address the objectives, financial situation or needs of any particular individual or entity.
It is provided for information purposes only and does not constitute, nor should it be regarded in any manner whatsoever as, advice and is not intended to influence a person in making a decision in relation to any financial product or an interest in
a financial product. No one should act on the information contained in this Report without obtaining appropriate professional advice after a thorough examination of the accuracy and appropriateness of the information contained in this Report having
regard to their objectives, financial situation and needs.
In preparing the Report, KPMG Actuarial has relied on information supplied to it from various sources
and has assumed that the information is accurate and complete in all material respects. KPMG Actuarial has not independently verified the accuracy or completeness of the data and information used for this Report.
Except insofar as liability under statute cannot be excluded, KPMG Actuarial, its executives, directors, employees and agents will not be held liable for any loss or damage of any
kind arising as a consequence of any use of the Report or purported reliance on the Report including any errors in, or omissions from, the valuation models.
The
Report must be read in its entirety. Individual sections of the Report, including the Executive Summary, could be misleading if considered in isolation. In particular, the opinions expressed in the Report are based on a number of assumptions and
qualifications which are set out in the full Report.
KPMG | iii
© 2017
KPMG, an Australian partnership and a member firm of the KPMG network of independent member firms affiliated with KPMG International Cooperative (“KPMG International”), a Swiss entity. All rights reserved. The KPMG name and logo are
registered trademarks or trademarks of KPMG International.
Liability limited by a scheme approved under Professional Standards Legislation.
Introduction
The Amended Final Funding Agreement
requires the completion of an Annual Actuarial Report evaluating the potential asbestos-related disease liabilities of the Liable Entities to be met by the AICF Trust. KPMG Actuarial has been retained by AICFL to provide this Annual Actuarial Report
as required under the Amended Final Funding Agreement and this is detailed in our Engagement Letter dated 24 November 2016.
The Liable Entities are defined as
being the following entities:
Amaca Pty Ltd (formerly James Hardie & Coy);
Amaba Pty Ltd (formerly Jsekarb, James Hardie Brakes and Better Brakes); and
ABN60 Pty Ltd
(formerly James Hardie Industries Ltd).
In addition, the liability for Baryulgil claims is deemed to be a liability of Amaca by virtue of the James Hardie (Civil
Liability) Act 2005 (NSW). Under Part 4 of that Act, Amaca is liable for the “Marlew Asbestos Claims” or “Marlew Contribution Claims” as defined in that Act.
Our valuation is on a central estimate basis and is intended to be effective as at 31 March 2017. It has been based on claims data and information as at 31 March 2017
provided to us by AICFL.
Overview of Recent Claims Experience and comparison with previous valuation projections
In this section we compare the actual experience in 2016/17 (referred to in the following tables as “FY17 Actual”) with the projections for 2016/17 that were contained
within our previous valuation report at 31 March 2016. We will refer to these projections for 2016/17 as “FY17 Expected” in the tables that follow.
Claim numbers
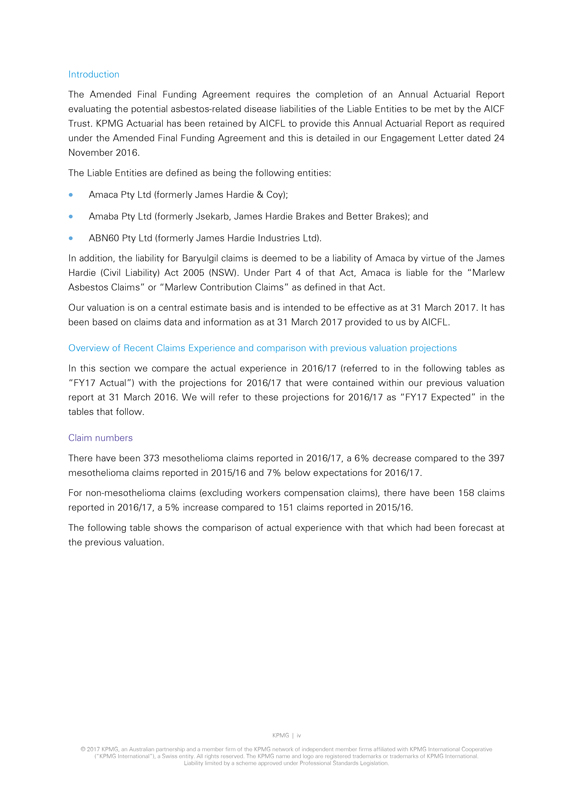
There have been 373 mesothelioma claims reported in 2016/17, a
6% decrease compared to the 397 mesothelioma claims reported in 2015/16 and 7% below expectations for 2016/17.
For
non-mesothelioma claims (excluding workers compensation claims), there have been 158 claims reported in 2016/17, a 5% increase compared to 151 claims reported in 2015/16.
The following table shows the comparison of actual experience with that which had been forecast at the previous valuation.
KPMG | iv
© 2017 KPMG, an Australian partnership and a member firm of the KPMG network of
independent member firms affiliated with KPMG International Cooperative (“KPMG International”), a Swiss entity. All rights reserved. The KPMG name and logo are registered trademarks or trademarks of KPMG International.
Liability limited by a scheme approved under Professional Standards Legislation.
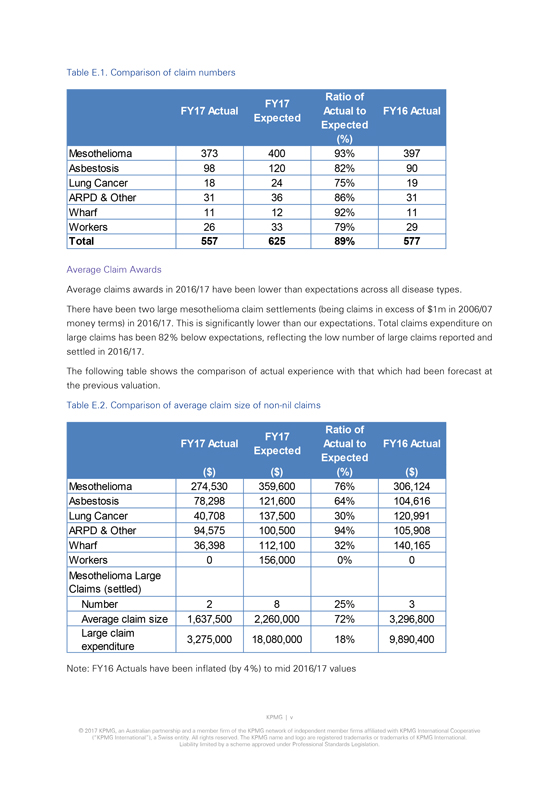
Table E.1. Comparison of claim numbers FY17 Actual FY17 Expected Ratio of Actual to Expected (%) FY16 Actual Mesothelioma 373 400 93% 397 Asbestosis 98 120 82% 90 Lung Cancer 18 24 75% 19 ARPD & Other 31 36 86% 31 Wharf 11 12 92% 11 Workers 26 33 79% 29 Total 557 625 89% 577 Average Claim Awards Average claims awards in 2016/17 have been lower than expectations across all disease types. There have been two large mesothelioma claim settlements (being claims in excess of $1m in 2006/07 money terms) in 2016/17. This is significantly lower than our expectations. Total claims expenditure on large claims has been 82% below expectations, reflecting the low number of large claims reported and settled in 2016/17. The following table shows the comparison of actual experience with that which had been forecast at the previous valuation. Table E.2. Comparison of average claim size of non-nil claims FY17 Actual ($) FY17 Expected ($) Ratio of Actual to Expected (%) FY16 Actual ($) Mesothelioma 274,530 359,600 76% 306,124 Asbestosis 78,298 121,600 64% 104,616 Lung Cancer 40,708 137,500 30% 120,991 ARPD & Other 94,575 100,500 94% 105,908 Wharf 36,398 112,100 32% 140,165 Workers 0 156,000 0% 0 Mesothelioma Large Claims (settled) Number 2 8 25% 3 Average claim size 1,637,500 2,260,000 72% 3,296,800 Large claim expenditure 3,275,000 18,080,000 18% 9,890,400 Note: FY16 Actuals have been inflated (by 4%) to mid 2016/17 values KPMG | v © 2017 KPMG, an Australian partnership and a member firm of the KPMG network of independent member firms affiliated with KPMG International Cooperative (“KPMG International”), a Swiss entity. All rights reserved. The KPMG name and logo are registered trademarks or trademarks of KPMG International. Liability limited by a scheme approved under Professional Standards Legislation.
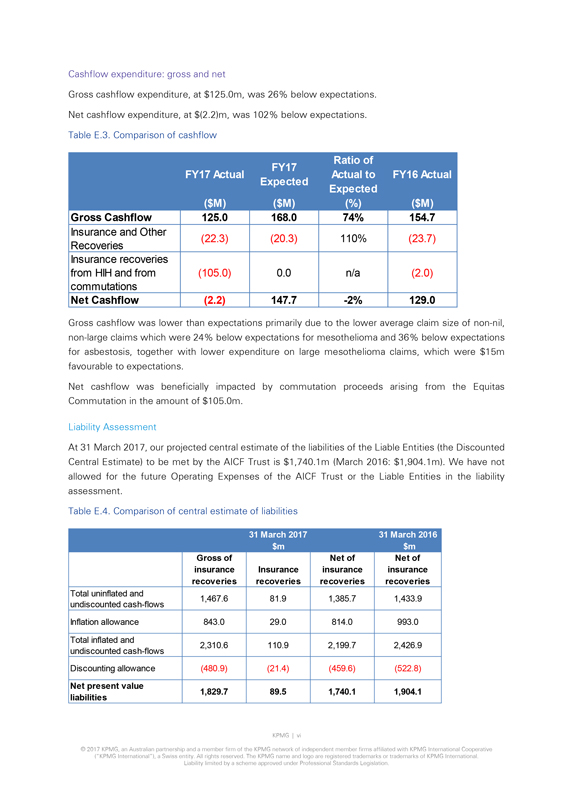
Cashflow expenditure: gross and net
Gross cashflow
expenditure, at $125.0m, was 26% below expectations. Net cashflow expenditure, at $(2.2)m, was 102% below expectations. Table E.3. Comparison of cashflow
FY17
Actual ($M)
FY17 Expected ($M)
Ratio of Actual to Expected (%)
FY16 Actual ($M)
Gross Cashflow 125.0 168.0 74% 154.7
Insurance and Other Recoveries (22.3) (20.3) 110% (23.7)
Insurance recoveries from HIH and
from commutations (105.0) 0.0 n/a (2.0)
Net Cashflow (2.2) 147.7 -2% 129.0
Gross cashflow was lower than expectations primarily due to the lower average claim size of non-nil, non-large claims which were 24% below expectations for mesothelioma and 36% below expectations for asbestosis, together with lower expenditure on large mesothelioma claims, which were $15m favourable to
expectations.
Net cashflow was beneficially impacted by commutation proceeds arising from the Equitas Commutation in the amount of $105.0m.
Liability Assessment
At 31 March 2017, our projected central estimate of the liabilities
of the Liable Entities (the Discounted Central Estimate) to be met by the AICF Trust is $1,740.1m (March 2016: $1,904.1m). We have not allowed for the future Operating Expenses of the AICF Trust or the Liable Entities in the liability assessment.
Table E.4. Comparison of central estimate of liabilities
31 March 2017 $m
31 March 2016 $m
Gross of insurance recoveries
Insurance recoveries
Net of insurance recoveries
Net of insurance recoveries
Total uninflated and undiscounted cash-flows 1,467.6 81.9 1,385.7 1,433.9
Inflation allowance
843.0 29.0 814.0 993.0
Total inflated and undiscounted cash-flows 2,310.6 110.9 2,199.7 2,426.9
Discounting allowance (480.9) (21.4) (459.6) (522.8)
Net present value liabilities 1,829.7
89.5 1,740.1 1,904.1
KPMG | vi
© 2017 KPMG, an Australian partnership
and a member firm of the KPMG network of independent member firms affiliated with KPMG International Cooperative (“KPMG International”), a Swiss entity. All rights reserved. The KPMG name and logo are registered trademarks or trademarks of
KPMG International.
Liability limited by a scheme approved under Professional Standards Legislation.
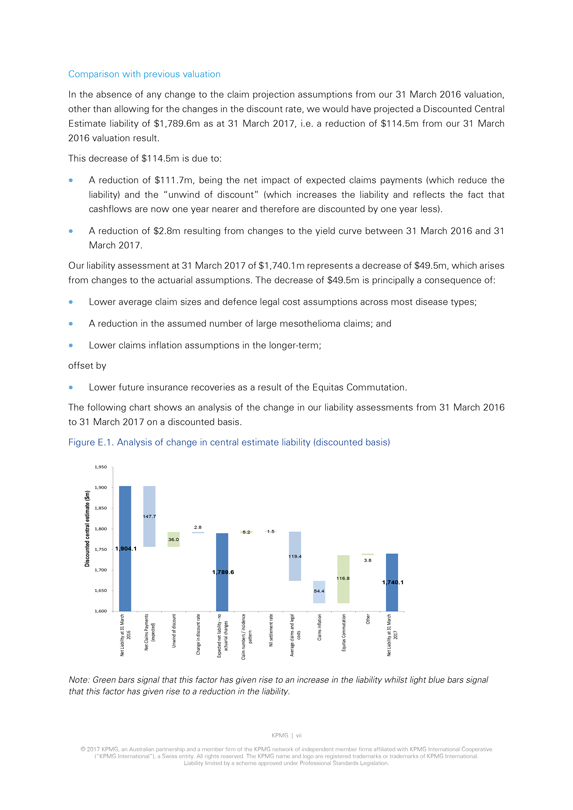
Comparison with previous valuation
In the absence
of any change to the claim projection assumptions from our 31 March 2016 valuation, other than allowing for the changes in the discount rate, we would have projected a Discounted Central Estimate liability of $1,789.6m as at 31 March 2017,
i.e. a reduction of $114.5m from our 31 March 2016 valuation result.
This decrease of $114.5m is due to:
A reduction of $111.7m, being the net impact of expected claims payments (which reduce the liability) and the “unwind of discount” (which increases the liability and
reflects the fact that cashflows are now one year nearer and therefore are discounted by one year less).
A reduction of $2.8m resulting from changes to the yield
curve between 31 March 2016 and 31 March 2017.
Our liability assessment at 31 March 2017 of $1,740.1m represents a decrease of $49.5m, which arises
from changes to the actuarial assumptions. The decrease of $49.5m is principally a consequence of:
Lower average claim sizes and defence legal cost assumptions
across most disease types;
A reduction in the assumed number of large mesothelioma claims; and
Lower claims inflation assumptions in the longer-term; offset by
• Lower future insurance
recoveries as a result of the Equitas Commutation.
The following chart shows an analysis of the change in our liability assessments from 31 March 2016 to
31 March 2017 on a discounted basis.
Figure E.1. Analysis of change in central estimate liability (discounted basis)
Discounted central estimate ($m)
1,600 1,650 1,700 1,750 1,800 1,850 1,900 1,950
Net Liability at 31 March 2016 1,904.1
Net Claims Payments (expected) 147.7
Unwind of discount 36.0
Change in discount rate 2.8
Expected net liability - no actuarial changes 1,789.6
Claim numbers / incidence pattern 5.2
Nil settlement rate 1.5
Average claims and legal costs 119.4
Claims inflation 54.4
Equitas Commutation 116.8
Other 3.8
Net Liability at 31 March 2017 1,740.1
Note: Green bars signal that this factor has given rise to an increase in the liability whilst light blue bars signal that this factor has given rise to a reduction in the
liability.
KPMG | vii
© 2017 KPMG, an Australian partnership and a
member firm of the KPMG network of independent member firms affiliated with KPMG International Cooperative (“KPMG International”), a Swiss entity. All rights reserved. The KPMG name and logo are registered trademarks or trademarks of KPMG
International.
Liability limited by a scheme approved under Professional Standards Legislation.
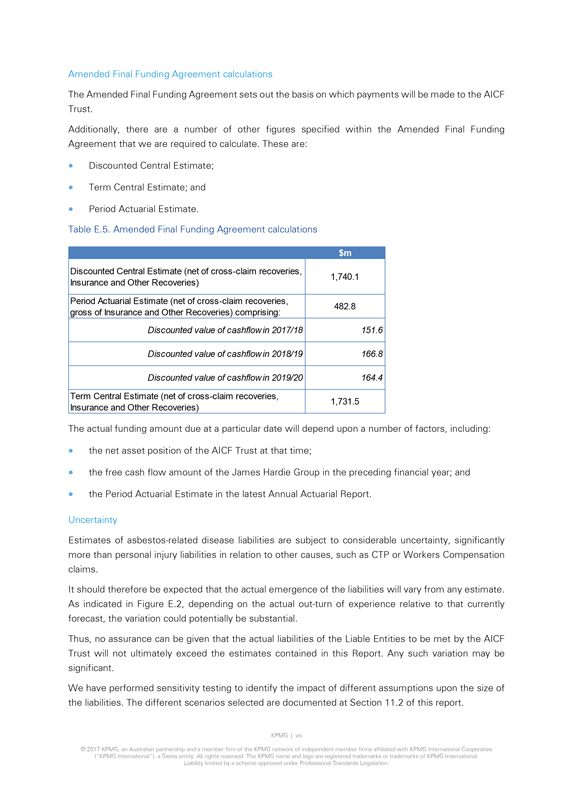
Amended Final Funding Agreement calculations
The
Amended Final Funding Agreement sets out the basis on which payments will be made to the AICF Trust.
Additionally, there are a number of other figures specified
within the Amended Final Funding Agreement that we are required to calculate. These are:
Discounted Central Estimate;
Term Central Estimate; and
Period Actuarial Estimate.
Table E.5. Amended Final Funding Agreement calculations $m
Discounted Central Estimate (net of
cross-claim recoveries, Insurance and Other Recoveries) 1,740.1
Period Actuarial Estimate (net of cross-claim recoveries, gross of Insurance and Other Recoveries)
comprising: 482.8
Discounted value of cashflow in 2017/18 151.6
Discounted
value of cashflow in 2018/19 166.8
Discounted value of cashflow in 2019/20 164.4
Term Central Estimate (net of cross-claim recoveries, Insurance and Other Recoveries) 1,731.5
The actual funding amount due at a particular date will depend upon a number of factors, including:
the net asset position of the AICF Trust at that time;
the free cash flow amount of the James
Hardie Group in the preceding financial year; and
the Period Actuarial Estimate in the latest Annual Actuarial Report.
Uncertainty
Estimates of asbestos-related disease liabilities are subject to considerable
uncertainty, significantly more than personal injury liabilities in relation to other causes, such as CTP or Workers Compensation claims.
It should therefore be
expected that the actual emergence of the liabilities will vary from any estimate. As indicated in Figure E.2, depending on the actual out-turn of experience relative to that currently forecast, the variation
could potentially be substantial.
Thus, no assurance can be given that the actual liabilities of the Liable Entities to be met by the AICF Trust will not
ultimately exceed the estimates contained in this Report. Any such variation may be significant.
We have performed sensitivity testing to identify the impact of
different assumptions upon the size of the liabilities. The different scenarios selected are documented at Section 11.2 of this report.
KPMG | viii
© 2017 KPMG, an Australian partnership and a member firm of the KPMG network of independent member firms affiliated with KPMG International Cooperative
(“KPMG International”), a Swiss entity. All rights reserved. The KPMG name and logo are registered trademarks or trademarks of KPMG International.
Liability limited by a scheme approved under Professional Standards Legislation.
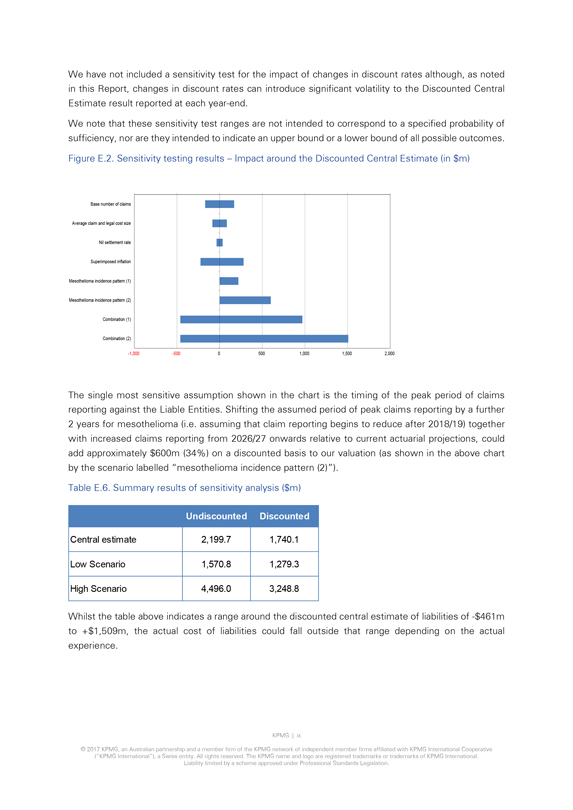
We have not included a sensitivity test for the impact of changes in discount rates although, as noted in this Report, changes in
discount rates can introduce significant volatility to the Discounted Central Estimate result reported at each year-end.
We
note that these sensitivity test ranges are not intended to correspond to a specified probability of sufficiency, nor are they intended to indicate an upper bound or a lower bound of all possible outcomes. Figure E.2. Sensitivity testing results
– Impact around the Discounted Central Estimate (in $m)
Base number of claims
Average claim and legal cost size
Nil settlement rate
Superimposed inflation
Mesothelioma incidence pattern (1)
Mesothelioma incidence pattern (2)
Combination (1)
Combination (2)
-1,000
-500
0
500
1,000
1,500
2,000
The single most sensitive assumption shown in the chart is the timing of the peak period of claims reporting against the Liable Entities. Shifting the assumed period of peak claims
reporting by a further 2 years for mesothelioma (i.e. assuming that claim reporting begins to reduce after 2018/19) together with increased claims reporting from 2026/27 onwards relative to current actuarial projections, could add approximately
$600m (34%) on a discounted basis to our valuation (as shown in the above chart by the scenario labelled “mesothelioma incidence pattern (2)”).
Table
E.6. Summary results of sensitivity analysis ($m)
Undiscounted
Discounted
Central estimate 2,199.7 1,740.1
Low Scenario 1,570.8 1,279.3
High Scenario 4,496.0 3,248.8
Whilst the table above indicates a range around the discounted
central estimate of liabilities of -$461m to +$1,509m, the actual cost of liabilities could fall outside that range depending on the actual experience.
KPMG | ix
© 2017 KPMG, an Australian partnership and a member firm of the KPMG network of independent member firms affiliated with KPMG International Cooperative
(“KPMG International”), a Swiss entity. All rights reserved. The KPMG name and logo are registered trademarks or trademarks of KPMG International.
Liability limited by a scheme approved under Professional Standards Legislation.
Data, Reliances and Limitations
We have been
provided with the following data by AICFL:
Claims dataset at 31 March 2017 with individual claims listings;
Accounting transactions dataset at 31 March 2017 (which includes individual claims payment details); and
Detailed insurance bordereaux information (being a listing of claims filed with the insurers of the Liable Entities) produced by Randall & Quilter Investment Holdings as
at 31 March 2017.
While we have tested the consistency of the various data sets provided, we have not otherwise verified the data nor have we undertaken any
auditing of the data at source. We have relied on the data provided as being complete and accurate in all material respects. Consequently, should there be material errors or incompleteness in the data, our assessment could be affected materially.
Executive Summary Not Report
Please note that this executive summary is
intended as a brief overview of our Report. To properly understand our analysis and the basis of our liability assessment requires examination of our Report in full.
KPMG | x
© 2017 KPMG, an Australian partnership and a member firm of the
KPMG network of independent member firms affiliated with KPMG International Cooperative (“KPMG International”), a Swiss entity. All rights reserved. The KPMG name and logo are registered trademarks or trademarks of KPMG International.
Liability limited by a scheme approved under Professional Standards Legislation.
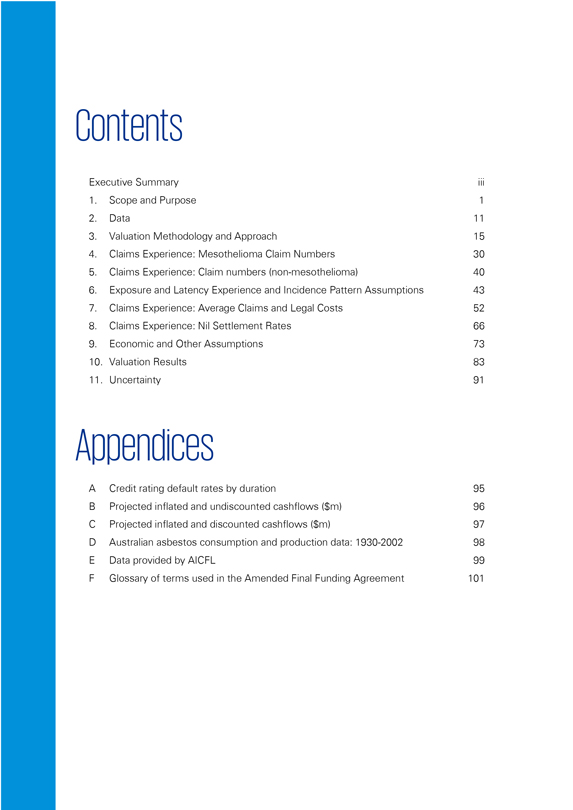
Contents
Executive Summary iii
1. Scope and Purpose 1
2. Data 11
3. Valuation Methodology and Approach 15
4. Claims Experience: Mesothelioma Claim Numbers 30
5. Claims Experience: Claim numbers (non-mesothelioma) 40
6. Exposure and Latency Experience and Incidence Pattern Assumptions 43
7. Claims Experience:
Average Claims and Legal Costs 52
8. Claims Experience: Nil Settlement Rates 66
9. Economic and Other Assumptions 73
10. Valuation Results 83
11. Uncertainty 91
Appendices
A Credit rating default rates by duration 95
B Projected inflated and undiscounted cashflows
($m) 96
C Projected inflated and discounted cashflows ($m) 97
D Australian
asbestos consumption and production data: 1930-2002 98
E Data provided by AICFL 99
F Glossary of terms used in the Amended Final Funding Agreement 101
1. Scope and Purpose
1.1 Introduction
The Amended Final Funding Agreement requires the completion of an Annual Actuarial Report evaluating the potential asbestos-related disease liabilities of the Liable Entities to be
met by the AICF Trust.
1.1.1 Liable Entities
The Liable Entities are defined
as being the following entities:
Amaca Pty Ltd (formerly James Hardie & Coy);
Amaba Pty Ltd (formerly Jsekarb, James Hardie Brakes and Better Brakes); and
ABN60 Pty Ltd
(formerly James Hardie Industries Ltd).
In addition, the liability for Baryulgil claims is deemed to be a liability of Amaca by virtue of the James Hardie (Civil
Liability) Act 2005 (NSW). Under Part 4 of that Act, Amaca is liable for “Marlew Asbestos Claims” or “Marlew Contribution Claims” as defined in that Act.
1.1.2 Personal asbestos claims
Under the Amended Final Funding Agreement, the liabilities to
be met by the AICF Trust relate to personal asbestos-related disease liabilities of the Liable Entities.
Such claims must relate to exposure which took place in
Australia and which have been brought in a Court in Australia.
The precise scope of the liabilities is documented in Section 1.2 and in Appendix F of this
Report.
1.1.3 Purpose of report
KPMG Actuarial has been retained by AICFL to
provide an Annual Actuarial Report as required under the Amended Final Funding Agreement and this is detailed in our Engagement Letter dated 24 November 2016.
The prior written consent of KPMG Actuarial is required for any other use of this Report or the information contained in it.
Our valuation is effective as at 31 March 2017 and has been based on claims data and information as at 31 March 2017 provided to us by AICFL.
KPMG | 1
© 2017 KPMG, an Australian partnership and a member firm of the KPMG network of
independent member firms affiliated with KPMG International Cooperative (“KPMG
International”), a Swiss entity. All rights reserved. The KPMG name and
logo are registered trademarks or trademarks of KPMG International. Liability limited by a scheme approved under Professional Standards Legislation.
1.2 Scope of report
We have been requested to
provide an actuarial assessment as at 31 March 2017 of the asbestos-related disease liabilities of the Liable Entities to be met by the AICF Trust, consistent with the terms of the Amended Final Funding Agreement.
The assessment is on a central estimate basis and is based on the claims experience as at 31 March 2017.
A “central estimate” liability assessment is an estimate of the expected value of the range of potential future liability outcomes. In other words, if all the possible
values of the liabilities are expressed as a statistical distribution, the central estimate is an estimate of the mean of that distribution.
It is of note that our
liability assessment:
Relates to the Liable Entities and Marlew (in relation to Marlew Claims arising from asbestos mining activities at Baryulgil).
Is intended to cover:
The amount of settlements, judgments or awards for all Personal Asbestos
Claims.
Claims Legal Costs incurred by the AICF Trust in connection with the settlement of Personal Asbestos Claims.
Is not intended to cover:
Personal injury or death claims arising from exposure to asbestos
which took place outside Australia.
Personal injury or death claims, arising from exposure to Asbestos, which are brought in Courts outside Australia.
Claims for economic loss, other than any economic loss forming part of an award for damages for personal injury and/or death.
Claims for loss of property, including those relating to land remediation.
The costs of
asbestos or asbestos product removal relating to asbestos or asbestos products manufactured or used by or on behalf of the Liable Entities.
Includes an allowance
for:
Compensation to the NSW Dust Diseases Board or a Workers Compensation Scheme by way of a claim by such parties for contribution or reimbursement from the
Liable Entities, but only to the extent that the cost of such claims is within the limits of funding for such claims as outlined within the Amended Final Funding Agreement.
Workers Compensation claims, being claims from former employees of the Liable Entities, but only to the extent that such liabilities are not met by a Workers Compensation Scheme or
Policy (see section 1.2.1).
Assumes that the product and public liability insurance policies of the Liable Entities will continue to respond to claims as and when
they fall due. We have not made any
KPMG | 2
© 2017 KPMG, an Australian
partnership and a member firm of the KPMG network of independent member firms affiliated with KPMG International Cooperative (“KPMG
International”), a
Swiss entity. All rights reserved. The KPMG name and logo are registered trademarks or trademarks of KPMG International. Liability limited by a scheme approved under Professional Standards Legislation.
allowance for the impact of any disputation concerning Insurance Recoveries, nor for any legal costs that may be incurred in resolving
such disputes.
Makes no allowance for:
potential Insurance Recoveries that
could be made on product and public liability insurance policies placed from 1986 onwards which were placed on a “claims made” basis.
the future
Operating Expenses of the Liable Entities or the AICF Trust. Separate allowance for future Operating Expenses should be considered by the management of AICFL.
the
inherent uncertainty of the liability assessment. That is, no additional provision (or risk margin) has been included in excess of a central estimate.
Readers of
this Report may refer to our previous reports which are available at www.ir.jameshardie.com.au and www.aicf.org.au.
1.2.1 Workers Compensation
Workers Compensation claims are claims made by former employees of the Liable Entities.
Such
past, current and future reported claims were insured with, amongst others, Allianz Australia Limited, QBE and the various State-based Workers Compensation Schemes.
Under the Amended Final Funding Agreement, the part of a future Workers Compensation claim that is met by a Workers Compensation Scheme or Policy of the Liable
Entities is outside of the AICF Trust. The AICF Trust is, however, to provide for any part of a claim not covered by a Workers Compensation Scheme or Policy (e.g. as a result of the existence of limits of indemnity and policy deductibles on those
policies of insurance).
On this basis our liability assessment in relation to Workers Compensation claims and which relates to the AICF Trust, includes only the
amount borne by the Liable Entities in excess of the anticipated recoveries due from a Workers Compensation Scheme or Policy.
In making our assessment we have
assumed that the Workers Compensation insurance programme will continue to respond to claims by former employees of the Liable Entities as and when they fall due. To the extent that they were not to respond owing to (say) insurer insolvency, Insurer
Guarantee Funds may be available to meet such obligations.
1.2.2 Dust Disease Board and Other Reimbursements
There exists a right under Section 8E (Reimbursement Provisions) of the Dust Diseases Act 1942 for the NSW Dust Diseases Board (“DDB”) to recover certain costs from
common law defendants, excluding the employer of the claimant.
This component of cost is implicitly included within our liability assessment as the claims awards
made in recent periods and in recent settlements contain allowance for DDB reimbursement where applicable. Furthermore, currently reported open claims have an allowance within their case estimates for the costs of DDB reimbursement where relevant
and applicable.
The Amended Final Funding Agreement indicates that the AICF Trust is intended to meet Personal Asbestos Claims and that claims by the DDB or a
Workers Compensation Scheme
KPMG | 3
© 2017 KPMG, an Australian
partnership and a member firm of the KPMG network of independent member firms affiliated with KPMG International Cooperative (“KPMG
International”), a
Swiss entity. All rights reserved. The KPMG name and logo are registered trademarks or trademarks of KPMG International. Liability limited by a scheme approved under Professional Standards Legislation.
for reimbursement will only be met up to a certain specified limit (aggregated across the DDB and Workers Compensation Schemes), being:
In the first financial year (2006/07) a limit of $750,000 applied;
In respect
of each financial year thereafter, that limit is indexed annually in line with the Consumer Price Index. At 31 March 2017, the annual limit is $971,170;
There is
an overall unindexed aggregate cap of $30m;
At 31 March 2017, AICF has paid out $8,523,992 to the DDB. Additionally, there are approximately $2.5m of unpaid
claims at 31 March 2017; the pace of payment of which would be subject to the impact of the annual limit.
The cashflow and liability figures contained within
this Report have already removed that component of any reimbursements that will not be met by the AICF Trust owing to the application of these limits and caps.
1.2.3 Baryulgil (“Marlew Claims”)
“Marlew Asbestos
Claims” and “Marlew Contribution Claims” are deemed to be liabilities of Amaca. These claims specifically include:
Claims made against Amaca Pty Ltd
or ABN60 resulting from their past ownership of the mine; and, in the case of Amaca, includes claims made in relation to the joint venture (Asbestos Mines Pty Ltd) established with Wunderlich in 1944 to begin mining at Baryulgil.
Claims made against the subsequent owner of the mine (following its sale by James Hardie Industries to Woodsreef in 1976), being Marlew Mining Pty Ltd (“Marlew”) which is
in liquidation, are to be met by the AICF Trust except where such claims are Excluded Marlew Claims, which are recoverable by the Claimant from other sources.
These claims are discussed further in Section 5.7.
1.2.4 Risk Margins
Australian-licensed insurance companies are required to hold, and many
non-insurance companies elect to hold, insurance and self-insurance claims provisions at a level above the central estimate basis to reflect the uncertainty attaching to the liability assessment and to include
an allowance in respect of that uncertainty.
A risk margin is an additional amount held, above the central estimate, so as to increase the likelihood of adequacy
of the provisions to meet the ultimate cost of settlement of those liabilities.
We note that the Amended Final Funding Agreement envisages the ongoing financing of
the AICF Trust is to be based on a “central estimate” approach and that the Annual Actuarial Report should provide a Discounted Central Estimate valuation.
Accordingly, we have made no allowance for any risk margins within this Report.
KPMG | 4
© 2017 KPMG, an Australian partnership and a member firm of the
KPMG network of independent member firms affiliated with KPMG International Cooperative (“KPMG
International”), a Swiss entity. All rights reserved. The
KPMG name and logo are registered trademarks or trademarks of KPMG International. Liability limited by a scheme approved under Professional Standards Legislation.
1.2.5 Discounting
We have determined a Discounted
Central Estimate in this Report by discounting (to 31 March 2017) the projected future cashflows using yields on Commonwealth Government Bonds.
Conceptually, the
Discounted Central Estimate at 31 March 2017 would normally represent an amount of money which, if fully provided in advance (i.e. as of 31 March 2017) and invested in risk-free assets (such as Commonwealth Government Bonds) of term and
currency appropriate to the liabilities, would generate the necessary investment income such that (together with the capital value of those assets) it would be expected to be sufficient to pay for the liabilities as they fall due.
To the extent that the actual investments are:
of different terms; and/or
in different currencies; and/or
provide different expected rates of return investment profits
or losses would emerge.
One of the uncertainties in our valuation is the fact that fixed interest Commonwealth Government Bonds do not exist at most of the
durations of our cashflow projection.
This means we need to take a long-term view on bond yields that is not measured by market-observable rates of return.
We note that the actual funding mechanism under the Amended Final Funding Agreement only provides for up to three years’ worth of projected Claims and Claims
Legal Costs expenditure and one year’s worth of Operating Expenses at any one time.
1.3 Areas of potential exposure
As identified in Section 1.2, there are other potential sources of claims exposure beyond those directly considered within this Report. However, in a number of cases they are
unquantifiable even if they have the potential to generate claims. This is especially the case for those sources of future claim where there has been no evidence of claims to date.
1.3.1 General areas of potential exposure
Areas of potential changes in claims exposure we
have not explicitly allowed for in our valuation include, but are not limited to:
Future significant individual landmark and precedent-setting judicial decisions;
Significant medical advancements;
Unimpaired claims, i.e. claims for fear,
stress, pure nervous shock or psychological illness. In this regard, we note the 2010/11 decisions by the Supreme Court (in relation to two cases: Tamaresis v Amaca and Galea v Amaca) which indicated that the AICF
Trust was not required to meet the cost of nervous shock claims brought by individuals who have not been exposed to asbestos;
KPMG | 5
© 2017 KPMG, an Australian partnership and a member firm of the KPMG network of
independent member firms affiliated with KPMG International Cooperative (“KPMG
International”), a Swiss entity. All rights reserved. The KPMG name and
logo are registered trademarks or trademarks of KPMG International. Liability limited by a scheme approved under Professional Standards Legislation.
A change in the basis of compensation for asymptomatic pleural plaques for which no associated physical impairment is exhibited;
A proliferation (compared to past and current levels of activity) of “third-wave” claims, i.e. claims arising as a result of indirect exposure such as
home renovation, washing clothes of family members that worked with asbestos, or from workers involved in the removal of asbestos or the demolition of buildings containing asbestos;
Changes in legislation, especially those relating to tort reform for asbestos sufferers. Examples include the amendments under the Wrongs Act in Victoria (as noted in
Section 1.3.3 of this Report) and the current consultation by the Law Reform Commission in Western Australia in relation to damages for gratuitous services and provisional damages;
Introduction of new, or elimination of existing, heads of damage;
Exemplary and aggravated or
punitive damages (being damages awarded for personal injuries caused as a result of negligence or reckless conduct);
Changes in the basis of apportionment of
awards for asbestos-related diseases for claimants who have smoked (we note the decisions in Amaca v Ellis [2010] HCA 5 and Evans v Queanbeyan City Council [2010] NSWDDT 7 which we understand are consistent with the previous decision in Judd v Amaca
[2002] NSWDDT 25);
Changes to taxation; and
Future bankruptcies of other
asbestos claim defendants (i.e. other liable manufacturers or distributors).
Nonetheless, implicit allowance is made in respect of some of these items in the
allowance for superimposed inflation included in our liability assessment. Furthermore, to the extent that some of these have emerged in past claims experience, they are reflected in our projections.
1.3.2 New Zealand and other overseas exposures
We have made no allowance for the risk of
further development in relation to New Zealand exposures and the rights of claims from New Zealand claimants in Australian courts (as per Frost v Amaca (2005), NSWDDT 36 although this decision was successfully appealed by Amaca in August 2006) nor
for the risk of additional exposures from overseas. This is because, as noted in Section 1.2, the AICF Trust is not required to meet the cost of these claims as they are Excluded Claims.
In relation to claimants where exposures have involved more than one country (e.g. UK and Australia), we have assumed that the AICF Trust will only meet that part of the cost which
is attributable to the Australian-related exposure.
1.3.3 Victorian amendments to the Wrongs Act
In 2015, the State of Victoria implemented amendments to the Wrongs Act (the Wrongs Amendment Act 2015) to incorporate the payment of Sullivan vs Gordon awards. These amendments
came into force on 19 November 2015.
KPMG | 6
© 2017 KPMG, an
Australian partnership and a member firm of the KPMG network of independent member firms affiliated with KPMG International Cooperative (“KPMG International”), a Swiss entity. All rights reserved. The KPMG name and logo are registered
trademarks or trademarks of KPMG International. Liability limited by a scheme approved under Professional Standards Legislation.
The Department of Justice and Regulation of Victoria made amendments to the Regulations that apply to Dust Diseases, namely the Wrongs
(Part VB) (Dust and Tobacco-Related Claims) Regulations 2006.
We have been advised that the effect of the various amendments is that from 10 May 2016, the
AICF Trust has been required to pay for Sullivan vs Gordon awards (to the extent applicable) in relation to claims brought against the Liable Entities in Victoria.
Such awards constitute Payable Liabilities under the Amended Final Funding Agreement.
We have therefore made allowance for these awards in our valuation. We have allowed for such amounts over all future years over which claims are projected to emerge and settle.
Our allowance, being $20,000 per mesothelioma claim in 2016/17 money terms, has added the following values to the overall liabilities that are included in this
Report:
• $57m on an uninflated & undiscounted basis.
•
$94m on an inflated & undiscounted basis.
• $73m on an inflated & discounted basis.
1.3.4 Third-wave claims
We have made allowance for
so-called “third-wave” claims. These are defined as claims for personal injury and / or death arising from asbestos exposure during home renovations by individuals or to builders involved in such
renovations. Such claims are allowed for within the projections to the extent to which they have arisen to date and to the extent our exposure model factors in these exposures in its projection.
We have not allowed for a significant additional surge in third-wave claims (over and above current levels of activity) in the future arising from renovations, but conversely we
have not allowed for a tempering of those third-wave claims already included within our projection as a result of improved education of individuals as to the risks of such home renovations, or of any local Councils or State Governments passing laws
in this regard.
It should be noted that claims for the cost of asbestos or asbestos product removal from homes and properties or any claims for economic loss
arising from asbestos or asbestos products being within such homes and properties is not required to be met by the AICF Trust.
1.4 Data reliances and limitations
KPMG Actuarial has relied upon the accuracy and completeness of the data with which it has been provided. KPMG Actuarial has not verified the accuracy or
completeness of the data, although we have undertaken steps to test its consistency with data previously received. However, KPMG Actuarial has placed reliance on the data previously received, and currently provided, as being accurate and complete in
all material respects.
1.5 Uncertainty
It must be understood that estimates
of asbestos-related disease liabilities are subject to considerable uncertainty.
KPMG | 7
© 2017 KPMG, an Australian partnership and a member firm of the KPMG network of independent member firms affiliated with KPMG International Cooperative (“KPMG
International”), a Swiss entity. All rights reserved. The KPMG name and logo are registered trademarks or trademarks of KPMG International. Liability limited by a scheme approved under Professional Standards Legislation.
This is due to the fact that the ultimate disposition of future claims will be subject to the outcome of events that have not yet
occurred. Examples of these events, as noted in Section 1.3, include jury decisions, court interpretations, legislative changes, epidemiological developments, medical advancements, public attitudes, potential additional third-wave exposures and
social and economic conditions such as inflation.
Therefore, it should be expected that the actual emergence of the liabilities will vary, perhaps materially, from
any estimate. Thus, no assurance can be given that the actual liabilities of the Liable Entities to be met by the AICF Trust will not ultimately exceed the estimates contained herein. Any such variation may be significant.
1.6 Distribution and use
The purpose of this Report is as stated in Section 1.1.
This Report should not be used for any purpose other than those specified.
This Report will be provided to the Board and management of AICFL. This Report will also be provided to the Board and management of James Hardie, the NSW
Government and to Ernst & Young in their capacity as auditors to both James Hardie and AICFL.
We understand that this Report will be filed with the ASX and
placed on James Hardie’s website in its entirety.
We understand that this Report will also be placed on AICFL’s website in its entirety. KPMG Actuarial
consents to this Report being made available to the above-mentioned parties and for the Report to be distributed in the manner described above.
To the extent
permitted by law, neither KPMG Actuarial nor its Executives, directors or employees will be responsible to any third parties for the consequences of any actions they take based upon the opinions expressed with this Report, including any use of or
purported reliance upon this Report not contemplated in Section 1.2. Any reliance placed is that party’s sole responsibility.
Where distribution of this
Report is permitted by KPMG Actuarial, the Report may only be distributed in its entirety and judgements about the conclusions and comments drawn from this Report should only be made after considering the Report in its entirety and with necessary
consultation with KPMG Actuarial.
Readers are also advised to refer to the “Important Note: Basis of Report” section at the front of the Executive
Summary of this Report.
1.7 Date labelling convention used in this Report
In
our analyses throughout this Report (unless otherwise stated), the “year” we refer to aligns with the financial year of AICFL and James Hardie and runs from 1 April to 31 March. A “2008” notified claim would be a claim
notified in the period 1 April 2008 to 31 March 2009. This might also be referred to as “2008/09” or “FY09”.
Similarly, a
“2016” claim settlement would be a claim settled in the period 1 April 2016 to 31 March 2017. This might also be referred to as “2016/17” or “FY17”.
KPMG | 8
© 2017 KPMG, an Australian partnership and a member firm of the KPMG network of
independent member firms affiliated with KPMG International Cooperative (“KPMG International”), a Swiss entity. All rights reserved. The KPMG name and logo are registered trademarks or trademarks of KPMG International. Liability limited by
a scheme approved under Professional Standards Legislation.
1.8 Author of the report
This Report is authored
by Neil Donlevy, an Executive of KPMG Actuarial Pty Ltd, a Fellow of the Institute of Actuaries (London) and a Fellow of the Institute of Actuaries of Australia.
This Report is co-authored by Jefferson Gibbs, an Executive of KPMG Actuarial Pty Ltd, a Fellow of the Institute of
Actuaries (London) and a Fellow of the Institute of Actuaries of Australia.
In relation to this Report, the primary regulator for both Neil Donlevy and Jefferson
Gibbs is the Institute of Actuaries of Australia.
1.9 Professional standards and compliance
This Report details a valuation of the outstanding claims liabilities of entities which hold liabilities with features similar to general insurance liabilities as self-insured
entities, and which have purchased related insurance protection.
In preparing this Report, we have complied with the Professional Standard 300 of the Institute of
Actuaries of Australia (“PS300”), “Valuation of General Insurance Claims”.
However, as we note in Section 1.2, this Report does not
include an allowance for the future Operating Expenses of the AICF Trust (which are estimated by AICFL) and nor does it include any allowance for a risk margin to reflect the inherent uncertainty in the liability assessment.
1.10 Control processes and review
This valuation report and the underlying analyses have been
subject to technical review and internal peer review.
The technical review focuses on ensuring that the valuation models and supporting claims experience analyses
that are carried out are performed correctly and that the calculations are being correctly applied. The technical review also focuses on ensuring that the data that is being used has been reconciled insofar as possible.
Internal peer review involves a review of the approach, the methods, the assumptions selected and the professional judgments applied.
Both the technical review and internal peer review processes are applied to the Report as well as the valuation models.
1.11 Funding position of the AICF Trust
This Report does not analyse nor provide any opinion
on the current, or prospective, funding position of the AICF Trust, nor of its likely funding needs and its potential use of the loan facility provided by the NSW Government.
This is because to do so within this Report would require consideration, estimation and documentation of the future financial performance of James Hardie.
This Report only provides analysis and opinion on the estimates of the future expenditure to be met by the AICF Trust.
KPMG | 9
© 2017 KPMG, an Australian partnership and a member firm of the KPMG network of
independent member firms affiliated with KPMG International Cooperative (“KPMG International”), a Swiss entity. All rights reserved. The KPMG name and logo are registered trademarks or trademarks of KPMG International. Liability limited by
a scheme approved under Professional Standards Legislation.
The cashflow estimates contained in this Report assume that all claims against the Liable Entities will continue to be paid in full as
and when they fall due.
1.12 Basis of preparation of Report
We have been
advised by the management of AICFL to prepare the Report on a “going concern” basis (i.e. we should assume that AICFL will be able to meet any shortfall in the cost of the liabilities of the Liable Entities as they fall due).
KPMG | 10
© 2017 KPMG, an Australian partnership and a member firm of the KPMG network of
independent member firms affiliated with KPMG International Cooperative (“KPMG International”), a Swiss entity. All rights reserved. The KPMG name and logo are registered trademarks or trademarks of KPMG International. Liability limited by
a scheme approved under Professional Standards Legislation.
2. Data
2.1 Data provided to KPMG Actuarial
We have been provided with the following data by AICFL:
Claims dataset at
31 March 2017 with individual claims listings;
Accounting transactions dataset at 31 March 2017 (which includes individual claims payment details); and
Detailed insurance bordereaux information (being a listing of claims filed with the insurers of the Liable Entities) produced by Randall & Quilter
Investment Holdings as at 31 March 2017.
We have allowed for the benefits of the product and public liability insurance policies of the Liable Entities based
on information provided to us by AICFL relating to the insurance programme’s structure, coverage and layers.
We have also considered the claims data listings
which formed the basis of our previous valuation assessments.
The data structures for the claims and accounting databases provided to us by AICFL as of
31 March 2017 are detailed in Appendix E.
2.2 Data limitations
We have
tested the consistency of the various data sets provided to us at different valuation dates. Section 2.3 outlines the nature of the testing undertaken.
However, we have not otherwise verified the data and have instead relied on the data provided as being complete and accurate in all material respects.
We have relied upon the robustness of AICFL’s internal administration and systems as to the completeness of the data provided.
Consequently, should there be material errors or incompleteness in the data, our assessment could also be affected materially.
2.3 Data reconciliation and testing
We have performed a reconciliation of the data provided at
31 March 2017 with the data provided at 31 March 2016.
We have undertaken a number of tests and reconciliations to test the accuracy of the data to the
extent possible, noting the limitations outlined above.
KPMG | 11
© 2017
KPMG, an Australian partnership and a member firm of the KPMG network of independent member firms affiliated with KPMG International Cooperative (“KPMG International”), a Swiss entity. All rights reserved. The KPMG name and logo are
registered trademarks or trademarks of KPMG International. Liability limited by a scheme approved under Professional Standards Legislation.
2.3.1 Reconciliation with previous valuation’s data
We have performed a reconciliation of the claims database as at 31 March 2017 with that provided at 31 March 2016.
Our findings are:
Claims notifications: There were no new claims reported that had a report
date prior to 31 March 2016. No claims changed notification date between the two databases.
Portfolio category: Four claims changed category. All of these
related to claims reported in 2015/16.
Settlement date: There have been two claims with a settlement date prior to 31 March 2016 that changed settlement
dates.
Changing and developing data is not unexpected or to be considered as adverse. Indeed, changing data is common to all claims administration systems. We do
not consider the number or extent of the changes noted above to be unreasonable, nor do we consider the changes to be material to the valuation.
2.3.2
Reconciliation of claims settlement amounts between claims and accounting databases The accounting database extract contains the following fields:
Damages - which
are gross of cross-claim recoveries;
Costs;
DDB reimbursements;
Other costs;
Payments to Medicare; and
Defence legal costs.
The claims database extract contains the following fields:
Damages - which in some cases are net of cross-claim recoveries, and which in others are gross of cross-claim recoveries. We are able to identify which records are gross of
cross-claims recoveries and which records are net of cross-claim recoveries. We have then restated all damages data to be gross of cross-claim recoveries;
Costs;
DDB reimbursements;
Other costs (Consulting costs and payments to Medicare);
and
Defence legal costs.
We have mapped the financial data between the two
databases into standardised groupings as follows:
KPMG | 12
© 2017 KPMG,
an Australian partnership and a member firm of the KPMG network of independent member firms affiliated with KPMG International Cooperative (“KPMG International”), a Swiss entity. All rights reserved. The KPMG name and logo are registered
trademarks or trademarks of KPMG International. Liability limited by a scheme approved under Professional Standards Legislation.
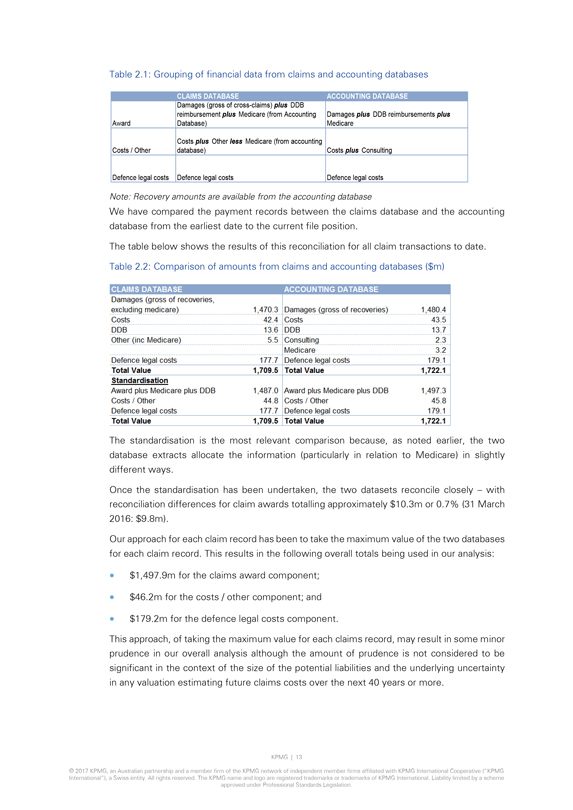
Table 2.1: Grouping of financial data from claims and accounting databases
CLAIMS DATABASE
ACCOUNTING DATABASE
Damages (gross of cross-claims) plus DDB
reimbursement plus Medicare (from Accounting Damages
plus DDB reimbursements plus Award Database) Medicare
Costs plus Other less Medicare (from accounting Costs / Other database)
Costs plus Consulting
Defence legal costs
Defence legal costs
Defence legal costs
Note: Recovery amounts are available from the accounting database
We have compared the payment
records between the claims database and the accounting database from the earliest date to the current file position.
The table below shows the results of this
reconciliation for all claim transactions to date. Table 2.2: Comparison of amounts from claims and accounting databases ($m)
CLAIMS DATABASE
Damages (gross of recoveries, excluding medicare) Costs DDB Other (inc Medicare) Defence legal costs Total Value Standardisation Award plus Medicare plus DDB Costs / Other Defence
legal costs Total Value 1,4703 42.4 13.6 5.5 177.7 1,709.5 1,487.0 44.8 177.7 1,709.5
ACCOUTING DATABASE
Damages (gross of recoveries) Costs DDB Consulting Medicare Defence legal costs Total Value Award ppplus Medicare plus DDB Costs/ Other Defence legal costs Total Value 1,480.4 43.5
13.7 2.3 3.2 179.1 1,722.1 1,497.3 458. 179.1 1,722.1
The standardisation is the most relevant comparison because, as noted earlier, the two database extracts
allocate the information (particularly in relation to Medicare) in slightly different ways.
Once the standardisation has been undertaken, the two datasets
reconcile closely – with reconciliation differences for claim awards totalling approximately $10.3m or 0.7% (31 March 2016: $9.8m).
Our approach for each
claim record has been to take the maximum value of the two databases for each claim record. This results in the following overall totals being used in our analysis:
$1,497.9m for the claims award component;
$46.2m for the costs / other
component; and
$179.2m for the defence legal costs component.
This approach,
of taking the maximum value for each claims record, may result in some minor prudence in our overall analysis although the amount of prudence is not considered to be significant in the context of the size of the potential liabilities and the
underlying uncertainty in any valuation estimating future claims costs over the next 40 years or more.
KPMG | 13
© 2017 KPMG, an Australian partnership and a member firm of the KPMG network of independent member firms affiliated with KPMG International Cooperative (“KPMG
International”), a Swiss entity. All rights reserved. The KPMG name and logo are registered trademarks or trademarks of KPMG International. Liability limited by a scheme
approved under Professional Standards Legislation.
2.4 Data conclusion
We have not verified the
underlying data nor have we undertaken “auditing at source”. No material data issues have been identified and notified to us by the Approved Auditor of AICFL (Ernst & Young) during their testing.
We have tested the data for internal consistency with the data provided at the previous valuation (31 March 2016).
Based on that testing and reconciliation, and subject to the limitations described in Section
1.4, we have formed the view that:
Generally, the data is consistent between
valuations, with any differences in the data being readily explainable;
The financial data appears to reconcile reasonably between the two data sources (the claims
dataset and the accounting dataset);
Any data issues that have emerged are not significant in relation to the size of the liabilities; and
Therefore, the data is appropriate for use for the purposes of this Report.
KPMG | 14
© 2017 KPMG, an Australian partnership and a member firm of the KPMG network of independent member firms affiliated with KPMG International Cooperative
(“KPMG International”), a Swiss entity. All rights reserved. The KPMG name and logo are registered trademarks or trademarks of KPMG International. Liability limited by a scheme approved under Professional Standards Legislation.
3. Valuation Methodology and Approach
3.1 Previous
valuation work and methodology changes
We have, in broad terms, maintained the core valuation methodology adopted at our previous valuation at 31 March 2016.
3.2 Overview of current methodology
The methodology involves assessing the
liabilities in two separate components, being:
Allowance for the cost of settling claims which have already been reported but have not yet been settled
(“pending claims”); and
Allowance for the cost of settling claims which have not yet been reported (“Incurred But Not Reported” or
“IBNR” claims).
For pending claims, we have used the case estimates (where available) with some adjustments to reflect the extent to which the case
estimates (on average) tend to overstate the ultimate cost. For IBNR claims we have used what can best be described as an “average cost per claim method”.
In brief, the overall methodology may be summarised as follows:
Project the
future number of claims expected to be reported in each future year by disease type (for product and public liability) and for Workers Compensation and wharf claims taking into account the expected future incidence of mesothelioma and other diseases
and also the past rate of co-joining of the Liable Entities;
Analyse past average attritional claim costs of non-nil claims in mid 2016/17 money terms. We have defined attritional claims to be claims which are less than $1m in 2006/07 money terms. We estimate a baseline attritional
non-nil average claim cost in mid 2016/17 money terms. This represents the Liable Entities’ share of a claim rather than the total claim settlement. For Workers Compensation claims, the average cost
represents only that part of a claim which is borne by the Liable Entities (i.e. it is net of any insurance proceeds from a Workers Compensation Scheme or Policy);
Analyse past historical average plaintiff/other and defendant legal costs for non-nil claim settlements;
Analyse past historical average defendant legal costs for nil claim settlements;
KPMG | 15
© 2017 KPMG, an Australian partnership and a member firm of the KPMG network of independent member firms affiliated with KPMG International Cooperative
(“KPMG International”), a Swiss entity. All rights reserved. The KPMG name and logo are registered trademarks or trademarks of KPMG International. Liability limited by a scheme approved under Professional Standards Legislation.
Estimate a “large claims loading” for mesothelioma claims by estimating the frequency, or incidence rate, and average claim
size and legal cost sizes of such claims (being claims which are in excess of $1m in 2006/07 money terms);
Project the pattern and incidence of future claims
settlements from the claims reporting profile projected. This is done by using a settlement pattern derived from consideration of past experience of the pattern of delay between claim reporting and claim settlement for each disease type;
Estimate the proportion of claims which will be settled with no liability against the Liable Entities by reference to past proportions of claims settled for nil claim cost (we
refer to this as the “nil settlement rate”);
Inflate average claim, plaintiff/other and defence legal costs and large claim costs to the date of
settlement of claims allowing for base inflation and (where applicable) superimposed inflation;
Multiply the claims numbers which are expected to be settled for non-nil amounts in a period by the inflated average non-nil claim costs (including the “large claims loading”) and plaintiff/other and defence legal costs for that
period;
Make allowance in defence legal costs for that proportion of settled claims which are expected to be settled for no liability but for which defence costs
will be incurred;
Inflate average defence legal costs of nil claims to the date of settlement of claims allowing for base inflation;
Multiply the claims numbers which are expected to be settled for nil amounts in a period by the inflated average defence legal costs for nil claims for that period;
Add the expected claims and legal payments relating to pending claims (after allowance for the potential savings on case estimates) after making allowance for the assumed
settlement pattern of pending claims;
This gives the projected future gross cashflow for each future financial year;
Adjust the projected gross cashflow for the impact of the annual and aggregate caps on DDB reimbursements;
Estimate the recoveries resulting from cross-claims made by the Liable Entities against other parties (“cross-claim recoveries”);
Project Insurance Recoveries to establish the net cashflows;
Discount the cashflows using a
yield curve derived from yields on Commonwealth Government Fixed Interest Bonds at the valuation date to arrive at our present value liability assessment.
It
should be noted that this description is an outline and is not intended to be exhaustive in consideration of all the stages we consider or all investigations we undertake. Those other stages are outlined in more detail elsewhere in this Report and
readers are advised to refer to those sections for a more detailed understanding of the process undertaken.
As discussed elsewhere, the liabilities are established
on a central estimate basis.
KPMG | 16
© 2017 KPMG, an Australian
partnership and a member firm of the KPMG network of independent member firms affiliated with KPMG International Cooperative (“KPMG International”), a Swiss entity. All rights reserved. The KPMG name and logo are registered trademarks or
trademarks of KPMG International. Liability limited by a scheme approved under Professional Standards Legislation.
3.3 Disease type and class subdivision
3.3.1
Claims records excluded from our analysis
We have excluded cross-claims brought by the Liable Entities against other defendants.
Where the cross-claim is brought as part of the main proceedings the claim is automatically counted in our analysis of the number of claims. However, where the cross-claim by the
Liable Entities is severed from the main proceedings, the existence of a separate record in the claims dataset does not indicate an additional claim (or liability against the Liable Entities). In these circumstances such claims records are not
counted in our analysis.
We have also excluded “insurance recovery” claims records. This is because the insurance recovery record is a separate record
that exists for claims records where an insurance recovery is due. In other words, the claim against the Liable Entity has already been included in our analysis and the insurance recovery record exists for operational purposes only. We have,
however, made separate, explicit allowance in the valuation for future insurance recoveries.
3.3.2 Categories of claim
We have sub-divided the remaining claims into the following groups:
Product and Public Liability;
Workers Compensation, being claims by former employees of the
Liable Entities; and
Wharf claims, being claims by individuals whose occupations involved working on the docks or wharves, or where part of their exposure related
to wharves.
We have separated the Workers Compensation claims from product and public liability claims because claim payments from Workers Compensation claims do
not generate recoveries under the product and public liability insurance cover, so that in order to value those insurance policies we need to separately identify the cashflows from product and public liability claims and the cashflows from Workers
Compensation claims.
We have separated out wharfside workers claims because such claims may have a different
exposure and incidence profile compared with product and public liability claims.
3.3.3
Categories of disease
For product and public liability claims, we have separately analysed the individual disease types.
We have split the data by disease type because there is sufficient volume of claims to do so, because different disease types display substantially different average claim sizes,
and because the incidence pattern of future notifications is expected to vary between the different disease types.
We have not divided the Workers Compensation or
wharf claims data by disease type, given their low financial significance and the reduced credibility of the data if sub-divided by disease type (given the low number of claims).
KPMG | 17
© 2017 KPMG, an Australian partnership and a member firm of the KPMG network of
independent member firms affiliated with KPMG International Cooperative (“KPMG International”), a Swiss entity. All rights reserved. The KPMG name and logo are registered trademarks or trademarks of KPMG International. Liability limited by
a scheme approved under Professional Standards Legislation.
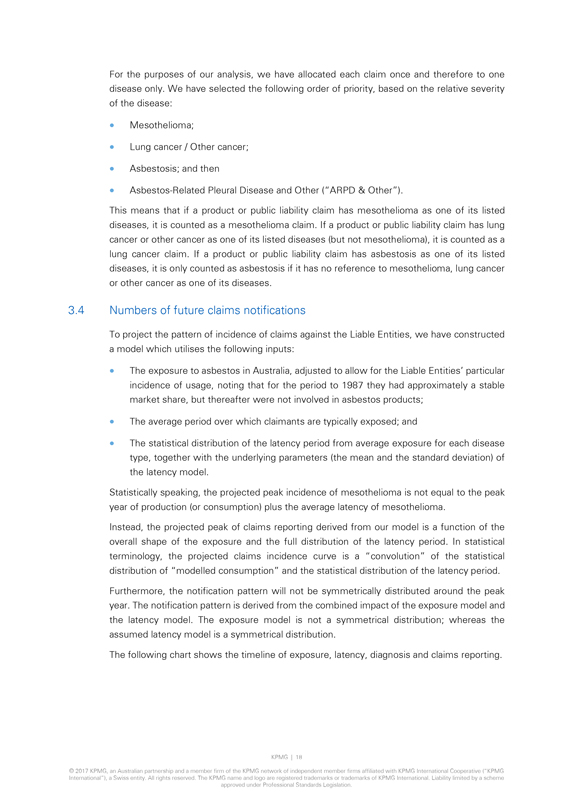
For the purposes of our analysis, we have allocated each claim once and therefore to one disease only. We have selected the following
order of priority, based on the relative severity of the disease:
Mesothelioma;
Lung cancer / Other cancer;
Asbestosis; and then
Asbestos-Related Pleural Disease and Other (“ARPD & Other”).
This means
that if a product or public liability claim has mesothelioma as one of its listed diseases, it is counted as a mesothelioma claim. If a product or public liability claim has lung cancer or other cancer as one of its listed diseases (but not
mesothelioma), it is counted as a lung cancer claim. If a product or public liability claim has asbestosis as one of its listed diseases, it is only counted as asbestosis if it has no reference to mesothelioma, lung cancer or other cancer as one of
its diseases.
3.4 Numbers of future claims notifications
To project the
pattern of incidence of claims against the Liable Entities, we have constructed a model which utilises the following inputs:
The exposure to asbestos in Australia,
adjusted to allow for the Liable Entities’ particular incidence of usage, noting that for the period to 1987 they had approximately a stable market share, but thereafter were not involved in asbestos products;
The average period over which claimants are typically exposed; and
The statistical
distribution of the latency period from average exposure for each disease type, together with the underlying parameters (the mean and the standard deviation) of the latency model.
Statistically speaking, the projected peak incidence of mesothelioma is not equal to the peak year of production (or consumption) plus the average latency of mesothelioma.
Instead, the projected peak of claims reporting derived from our model is a function of the overall shape of the exposure and the full distribution of the latency
period. In statistical terminology, the projected claims incidence curve is a “convolution” of the statistical distribution of “modelled consumption” and the statistical distribution of the latency period. Furthermore, the
notification pattern will not be symmetrically distributed around the peak year. The notification pattern is derived from the combined impact of the exposure model and the latency model. The exposure model is not a symmetrical distribution; whereas
the assumed latency model is a symmetrical distribution.
The following chart shows the timeline of exposure, latency, diagnosis and claims reporting.
KPMG | 18
© 2017 KPMG, an Australian partnership and a member firm of the KPMG network of
independent member firms affiliated with KPMG International Cooperative (“KPMG International”), a Swiss entity. All rights reserved. The KPMG name and logo are registered trademarks or trademarks of KPMG International. Liability limited by
a scheme approved under Professional Standards Legislation.
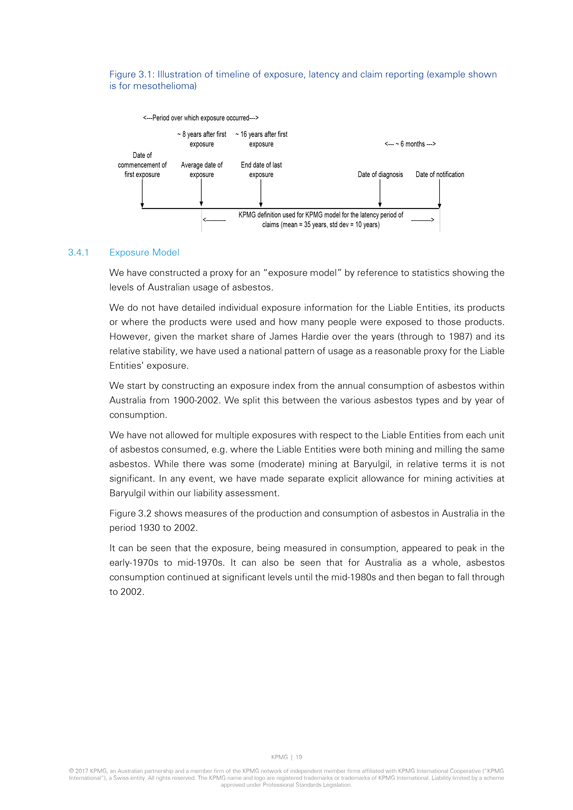
Figure 3.1: Illustration of timeline of exposure, latency and claim reporting (example shown is for mesothelioma)
<—-Period over which exposure occurred—->
~ 8 years after first
~ 16 years after first
exposure
exposure
<—- ~ 6 months —->
Date of commencement of
Average date of
End date of last
first exposure
exposure
exposure
Date of diagnosis Date of notification
KPMG definition used for KPMG model for the latency
period of
<————— —————>
claims (mean = 35 years, std dev = 10 years)
3.4.1 Exposure Model
We have constructed a proxy for an “exposure model” by reference to statistics showing the levels of Australian usage of asbestos.
We do not have detailed individual exposure information for the Liable Entities, its products or where the products were used and how many people were exposed to those products.
However, given the market share of James Hardie over the years (through to 1987) and its relative stability, we have used a national pattern of usage as a
reasonable proxy for the Liable Entities’ exposure.
We start by constructing an exposure index from the annual consumption of asbestos within Australia from
1900-2002. We split this between the various asbestos types and by year of consumption.
We have not allowed for multiple exposures with respect to the Liable
Entities from each unit of asbestos consumed, e.g. where the Liable Entities were both mining and milling the same asbestos. While there was some (moderate) mining at Baryulgil, in relative terms it is not significant. In any event, we have made
separate explicit allowance for mining activities at Baryulgil within our liability assessment.
Figure 3.2 shows measures of the production and consumption of
asbestos in Australia in the period 1930 to 2002.
It can be seen that the exposure, being measured in consumption, appeared to peak in the early-1970s to mid-1970s. It can also be seen that for Australia as a whole, asbestos consumption continued at significant levels until the mid-1980s and then began to fall through to 2002.
KPMG | 19
© 2017 KPMG, an Australian partnership and a member firm of
the KPMG network of independent member firms affiliated with KPMG International Cooperative (“KPMG International”), a Swiss entity. All rights reserved. The KPMG name and logo are registered trademarks or trademarks of KPMG International.
Liability limited by a scheme approved under Professional Standards Legislation.
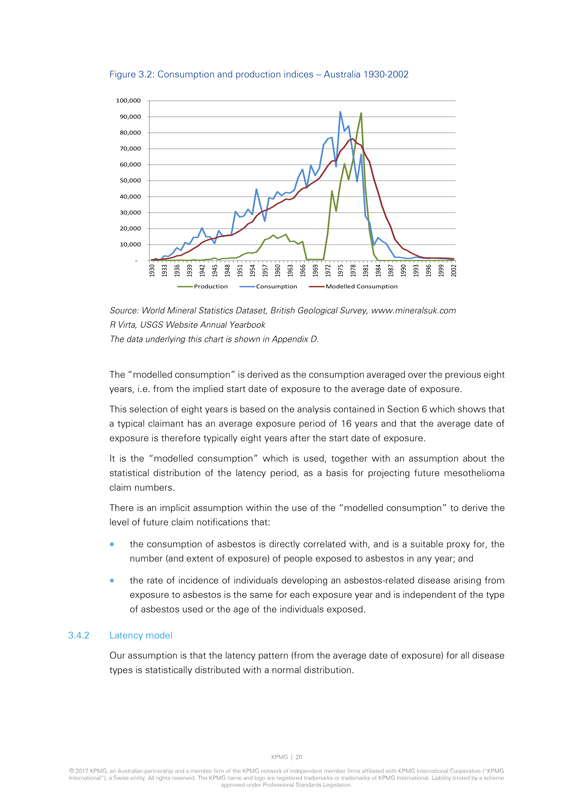
Figure 3.2: Consumption and production indices – Australia 1930-2002
100,000
90,000
80,000
70,000
60,000
50,000
40,000
30,000
20,000
10,000
-
1930
1933
1936
1939
1942 1945 1948
1951
1954
1957 1960 1963 1966
1969
1972 1975 1978 1981 1984 1987 1990
1993
1996
1999
2002
Production
Consumption
Modelled Consumption
Source: World Mineral Statistics Dataset, British Geological Survey, www.mineralsuk.com R Virta, USGS Website Annual Yearbook The data underlying this chart is shown in Appendix D.
The “modelled consumption” is derived as the consumption averaged over the previous eight years, i.e. from the implied start date of exposure to the
average date of exposure.
This selection of eight years is based on the analysis contained in Section 6 which shows that a typical claimant has an average
exposure period of 16 years and that the average date of exposure is therefore typically eight years after the start date of exposure.
It is the “modelled
consumption” which is used, together with an assumption about the statistical distribution of the latency period, as a basis for projecting future mesothelioma claim numbers.
There is an implicit assumption within the use of the “modelled consumption” to derive the level of future claim notifications that:
the consumption of asbestos is directly correlated with, and is a suitable proxy for, the number (and extent of exposure) of people exposed to asbestos in any year; and
the rate of incidence of individuals developing an asbestos-related disease arising from exposure to asbestos is the same for each exposure year and is independent of the type of
asbestos used or the age of the individuals exposed.
3.4.2 Latency model
Our
assumption is that the latency pattern (from the average date of exposure) for all disease types is statistically distributed with a normal distribution.
KPMG | 20
© 2017 KPMG, an Australian partnership and a member firm of the KPMG network of independent member firms affiliated with KPMG International Cooperative
(“KPMG International”), a Swiss entity. All rights reserved. The KPMG name and logo are registered trademarks or trademarks of KPMG International. Liability limited by a scheme approved under Professional Standards Legislation.
The parameters (i.e. the mean and standard deviation) of the distribution have been set by reference to previous work undertaken by
Professor Berry et al1, by Jim Leigh et al2 and by
Yeung et al3
The
parameters for the mean and, in particular, for the standard deviation have also been set taking into account the claims experience of the Liable Entities to date.
The parameters vary by disease type.
The analysis supporting the selection of
these parameters is summarised in Section 6.2.
3.4.3 Projecting the claims notification curve using the exposure and latency model
Our methodology is to take each year of exposure, using “modelled consumption” of asbestos in tonnage for that year, and project an index of the number of claims we
project to emerge in each future reporting year resulting from that exposure year.
The latency period is assumed to be normally distributed with a mean and a
standard deviation which vary by disease type.
This means that for any given exposure year, the peak incidence of reporting claims would be (in the case of
mesothelioma) 35 years after the average exposure date from that exposure year.
We then aggregate the claims notification index curves projected for each exposure
year to produce an overall curve which shows the index of claim notifications arising from all exposure periods.
The curve is described as an index because
consumption is used as a proxy measure for the number of individuals exposed and because we don’t know what proportion of those people who were exposed will develop asbestos-related diseases.
Therefore the methodology produces a shape of the number of claims, rather than an absolute level of the number of claims to be reported.
This methodology provides not only the shape of claims reporting as an index but it also projects the implied peak year(s) of incidence for each disease type and the rate of decay
in claims reporting levels after the peak year of incidence.
We allow for each of the diseases having different average latency periods. This results in different
projected peak years and incidence patterns for the different diseases.
These are summarised in Sections 6.2 and 6.3.
3.4.4 Calibrating the curve index to current reporting experience
We take the claim curve
index and then calibrate the number of notifications in each future year by reference to the recent levels of claims reporting and the number of claims we have assumed for the 2017/18 financial year.
1 Malignant pleural and peritoneal mesothelioma in former miners and millers of crocidolite at Wittenoom, Western Australia; G Berry, N H de Klerk et al (2004)
2 Malignant Mesothelioma in Australia: 1945-2000; J Leigh et al (2002)
3 Distribution of
Mesothelioma Cases in Different Occupational Groups and Industries, 1979-1995: P Yeung, A Rogers, A Johnson (1999) KPMG | 21
© 2017 KPMG, an Australian
partnership and a member firm of the KPMG network of independent member firms affiliated with KPMG International Cooperative (“KPMG International”), a Swiss entity. All rights reserved. The KPMG name and logo are registered trademarks or
trademarks of KPMG International. Liability limited by a scheme approved under Professional Standards Legislation.
This approach implicitly assumes that:
The future
rate of incidence of asbestos-related diseases manifesting as a result of a past exposure to asbestos will remain stable;
The pattern of diagnosis and the delay
between diagnosis and reporting remain stable;
The “propensity to claim” by individuals will remain stable; and
The rate of co-joining the Liable Entities in common law claims will remain stable.
Changes to any of these factors over time will result in changes to the actual pattern of incidence of claims reporting compared with that derived in Section 3.4.3.
Our assumptions for the base number of claims projected to be reported in 2017/18 are summarised in Sections 4.4 and 5.6.
3.4.5 Model adjustments made at 31 March 2014 for mesothelioma claims
As a consequence of
heightened mesothelioma claims reporting observed in 2013/14 (and which has continued thereafter), we made some modifications to the future incidence pattern for mesothelioma in our 31 March 2014 valuation.
The changes were most pronounced for the period of claims reporting through to, and including, 2016/17 and the changes are documented more extensively in our Annual Actuarial
Report effective at 31 March 2014.
We have maintained those modifications to the incidence pattern.
3.5 Incidence of claim settlements from future claim notifications
We derive a settlement
pattern by analysing triangulations of the numbers of settlements and claims payments by delay from the year of notification.
From these settlement pattern
analyses, we have estimated the pace at which claims notified in the future will settle, and used this to project the future number, and monetary amount, of settlements in each financial year for each disease type.
Our analysis and assumptions selected are summarised in Section 9.6.
3.6 Average claim
costs of IBNR claims
3.6.1 Attritional claims
We define a large claim as one
for which the award is greater than or equal to $1m in 2006/07 money terms (which equates to approximately $1.48m in mid 2016/17 money terms).
We define an
attritional claim as a non-nil, non-large claim. We define a nil claim as one for which the award payable by the relevant Liable Entity is zero.
We have estimated the following five components to the average cost assessment:
Average award
(sometimes including plaintiff legal costs) of a non-nil “attritional” claim.
Average plaintiff legal / other
costs of a non-nil “attritional” claim.
Average defence legal costs of a
non-nil “attritional” claim.
KPMG | 22
© 2017 KPMG, an Australian partnership and a member firm of the KPMG network of independent member firms affiliated with KPMG International Cooperative (“KPMG
International”), a Swiss entity. All rights reserved. The KPMG name and logo are registered trademarks or trademarks of KPMG International. Liability limited by a scheme approved under Professional Standards Legislation.
• Average defence legal costs of a nil claim.
• Large claim awards and legal cost allowances.
All of our analyses have
been constructed using past average awards, which have been inflated to mid 2016/17 money terms using a historical base inflation index (of 4% per annum). This allows for basic inflation effects when identifying trends in historical average
settlements. We then determine a prospective average cost in mid 2016/17 money terms.
We perform the same analysis for the defence legal costs for nil and non-nil claims and for plaintiff legal / other costs in respect of non-nil claims (together “Claims Legal Costs”). Our analysis and assumptions are summarised in
Section 7.
3.6.2 Large claims loading
We analyse the historical
incidence rate of large claims (being measured as the ratio of the number of large claims to the total number of non-nil claims), and the average claim size and legal costs of these claims.
We have determined a prospective incidence rate and an average cost in mid 2016/17 money terms to arrive at a “per claim” loading (being the average large claim cost
multiplied by the large claim incidence rate per claim) being the additional amount we need to add to our attritional average claim size to allow for large claims.
Our analysis and assumptions are summarised in Section 7.8.
3.6.3 Future
inflation of average claim sizes
Allowance for future claim cost inflation is made. This is modelled as a combination of base inflation plus superimposed
inflation. This enables us to project future average settlement costs in each future year, which can then be applied to the IBNR claims numbers as they settle in each future year.
Our analysis and assumptions in relation to claims inflation are summarised in Sections 9.2 and 9.3.
3.7 Proportion of claims settled for nil amounts
We apply a “nil settlement rate” to
the overall number of settlements to estimate the number of claims which will be settled for nil claim cost (i.e. other than in relation to defence legal costs) and those which will be settled for a non-nil
claim cost.
The prospective nil settlement rate is estimated by reference to the analysis of past trends in the rate of nil settlements.
Our analysis and assumptions selected are summarised in Section 8.
KPMG | 23
© 2017 KPMG, an Australian partnership and a member firm of the KPMG network of independent member firms affiliated with KPMG International Cooperative (“KPMG
International”), a Swiss entity. All rights reserved. The KPMG name and logo are registered trademarks or trademarks of KPMG International. Liability limited by a scheme approved under Professional Standards Legislation.
3.8 Pending claims
3.8.1 Definition of pending
claims
At 31 March 2017, there were 393 claims (31 March 2016: 464) for which claim awards have not yet been fully settled by the Liable Entities.
Additionally, there are a number of other claims for which defence legal costs have not yet been settled, even though the awards have been settled.
We have adopted three definitions of settlement status:
Where there is a closure date, there
are not expected to be any further award or legal costs incurred.
Where there is no closure date but the claim has a settlement date, there is the possibility of
further emerging defendant legal costs, even though the claim award has been settled.
Where there is no settlement date, there is the possibility of award,
plaintiff legal costs and defendant legal costs being incurred.
3.8.2 Evaluating the liability for pending claims
The excess amount of the liability for pending claims, over the case estimates held, is what the insurance industry terms Incurred But Not Enough Reported (“IBNER”).
Depending on the case estimation procedure of a company and the nature of the liabilities, IBNER can be either positive or negative, with a negative IBNER implying
that the ultimate cost of settling claims will be less than case estimates, i.e. that there is some degree of redundancy in case estimates.
3.8.3 Findings
Our analysis has indicated that there is a degree of redundancy in case estimates, i.e. a negative IBNER.
The comparison of current case estimates with actuarially-projected future settlement costs for claims reported to date suggests that potential savings from case estimates in
relation to the award component could be of the order of 25%.
AICFL’s own analysis also suggests that historically there have also been savings which have
typically varied between 20% and 30%.
Furthermore, we have assessed whether the cost of claims reported up to and including 31 March 2017 has deteriorated (or
improved) compared to our prior estimate (as at 31 March 2016).
The table below shows that there has been no deterioration compared to the estimates we
previously adopted and are currently adopting (both of which have already made allowance for a 25% saving on case estimates). This analysis lends further support to the view that the allowance we have made for the extent of redundancy in case
estimates of 25% is reasonable and is borne out by the actual experience.
We have maintained our assumption for the level of redundancy in case estimates on
currently reported claims at 25% at this valuation (March 2016: 25%). This assumption is only applied
KPMG | 24
© 2017 KPMG, an Australian partnership and a member firm of the KPMG network of independent member firms affiliated with KPMG International Cooperative (“KPMG
International”), a Swiss entity. All rights reserved. The KPMG name and logo are registered trademarks or trademarks of KPMG International. Liability limited by a scheme
approved under Professional Standards Legislation.
to the case estimates for the claim award, i.e. it is not applied to plaintiff/other costs or defence costs.
Table 3.1: Change in cost of claims during 2016/17 financial year ($m) – claim award component only
Figures in $ millions Current year reported claims Prior year reported claims Total
Estimates
for pending claims at 31 March 2016 (undiscounted) 0.0 79.9 79.9
Paid amounts in year to 31 March 2017 58.6 47.2 105.8
Estimates for pending claims at 31 March 2017 (undiscounted) 57.0 15.3 72.3
Incurred Cost
in the financial year 115.6 (17.4) 98.2
The table above shows that there has been a $17.4m saving in the case estimates for claims that were reported prior to
31 March 2016. This saving supports the 25% assumption we have adopted for savings on case estimates.
It should be noted that making allowance for savings
from case estimates is expected to have a more significant impact on the near term cash flows and a lesser impact on the longer-term cashflows, with more than 95% of the cost of pending claims expected to be settled within the next six years.
3.9 Insurance Recoveries
Insurance Recoveries are defined as proceeds which
are estimated to be recoverable under the product and public liability insurance policies of the Liable Entities, and therefore exclude any such proceeds from a Workers Compensation Scheme or Policy in which the Liable Entities participate or which
the Liable Entities hold.
In applying the insurance programme we consider only the projected gross cashflows relating to product and public liability claims.
We split out product liability cashflows from public liability cashflows as they are covered by different sections of the insurance policy under different bases:
Product liability claims are covered by an aggregate policy which provides cover for all product liability claims costs attached to any one year up to an overall
aggregate limit for that year; and
Public liability claims are covered by an “each and every loss” policy which provides cover for each public liability
claim up to an individual claim limit for that year.
Historical analysis of the claims data suggests that approximately 97.5% of all liability claims by cost have
been product liability claims.
We make no allowance for the Workers Compensation cashflows in estimating the Insurance Recoveries, as the insurance programme only
provides insurance cover to product and public liability exposures.
3.9.1 Programme overview
Until 31 March 1985, the Liable Entities had in place General and Products liability insurance policies with a $1m primary policy layer.
KPMG | 25
© 2017 KPMG, an Australian partnership and a member firm of the KPMG network of
independent member firms affiliated with KPMG International Cooperative (“KPMG
International”), a Swiss entity. All rights reserved. The KPMG name and
logo are registered trademarks or trademarks of KPMG International. Liability limited by a scheme approved under Professional Standards Legislation.
In addition, until 31 May 1986, the Liable Entities maintained further excess “umbrella” insurance policies, with varying
retentions and policy limits. That is, the insurance policies paid all costs arising from claims with exposure in a specified year from the retention up to the relevant policy limit. All claim costs in relation to a given exposure year in excess of
the limit would be retained by the Liable Entities.
Product liability claims were insured under these insurance policies on an “in the aggregate” basis
whilst public liability claims were insured on an “each and every loss” basis.
These insurance policies were placed amongst a number of insurance
providers on a claims occurring basis.
From 31 May 1986, the insurance policies were placed on a claims made basis in relation to asbestos-related product and
public liability cover.
In summary, the insurance policies were placed as follows:
For the period up to June 1976, the insurance policies were written on a claims occurring basis. The insurance was provided by QBE but the cover provided by these policies was
commuted in June 2000 for a consideration of $3.1m per annum for the following 15 years (through to 30 June 2014).
For the period from June 1976 to
31 May 1986, the insurance policies were written on a claims occurring basis. CE Heath acted as the underwriting agent and insured the risk in Australia and also into Lloyd’s of London and the London Market. However, during this period CE
Heath Underwriting & Insurance (Australia) Pty Ltd (CEH U&I) also insured some of the risk, reinsuring their placement on a facultative basis.
For the
period 31 May 1986 to 31 March 1989, the insurance policies were written on a claims-made basis. CE Heath acted as the underwriting agent and insured the risk into Lloyd’s of London and the London Market.
For the period 31 March 1989 to 31 March 1997, the insurance policies were written on a claims-made basis. However, CE Heath Casualty & General Insurance Ltd
(later HIH Casualty & General) acted as the insurer of the programme and reinsured it on a facultative basis into Lloyd’s of London and the London Market. CE Heath Casualty & General Insurance Ltd retained some share on some
of the layers.
3.9.2 Modelling insurance recoveries on the claims occurring programme
Our methodology for projecting the future insurance recoveries to be collected by AICFL involves the following steps:
Identify the current contract positions for each insurance policy year. This assumes that all monies due have been collected, and does not allow for the impact of commutations that
have taken place.
Allocate the projected future gross cashflows to individual insurance policy years using an allocation basis that has been determined by
reference to the exposure methodology used to project future claim numbers and also using a “period of exposure” and “time on risk” allocation.
This gives a projection of how the insurance programme is utilised over time.
KPMG | 26
© 2017 KPMG, an Australian partnership and a member firm of
the KPMG network of independent member firms affiliated with KPMG International Cooperative (“KPMG
International”), a Swiss entity. All rights reserved.
The KPMG name and logo are registered trademarks or trademarks of KPMG International. Liability limited by a scheme approved under Professional Standards Legislation.
This method allows us to:
evaluate the total
insurance recoveries due by payment year;
determine how the insurance recoveries due will be assigned to each layer and therefore to each insurer; and
identify and allow for when the individual layers are projected to be fully exhausted.
We then
make an additional adjustment to the projected recoveries to exclude those projected future insurance recoveries that are assigned to the participations of insurers who have already commuted their coverage with AICFL and the Liable Entities or
insurers who have settled their coverage by way of a Scheme of Arrangement.
3.9.3 Equitas Commutation
In March 2017, AICFL finalised a commutation agreement with Resolute Management Services Limited on behalf of Equitas and certain Lloyd’s Syndicates who had provided insurance
coverage to the Liable Entities in the period from 1 April 1980 to 31 May 1986.
AICFL commuted its insurance coverage with Equitas for a payment of
$105.0m effective as at 28 February 2017, and this amount was paid to AICFL on 31 March 2017.
As a consequence of the Equitas Commutation:
Net payments made by AICFL in 2017 were negative, reflecting that insurance proceeds (including the Equitas Commutation payment) exceeded gross expenditure in the year.
AICFL’s net cash position has been significantly improved.
Future insurance recoveries
are now projected at a much lower level than previously assumed.
All other things being equal, the net liability has increased significantly compared with the
previous year to reflect the lower future insurance recoveries expected to be received.
3.9.4 Other Commutations
Other commutations have been entered into by AICFL in previous years and these commutations have typically (other than QBE) involved the payment of a lump sum amount.
In these circumstances, we have assumed that the insurance liabilities of that company to the Liable Entities have been fully discharged and no further recoveries will fall due.
We have made no allowance or adjustment to the timing of receipt of insurance recoveries for any potential future commutations.
3.9.5 HIH
We have assumed that all monies have been paid in relation to insurance recoveries
for the claims occurring period from HIH. Any future insurance proceeds from HIH are not expected to be material.
KPMG | 27
© 2017 KPMG, an Australian partnership and a member firm of the KPMG network of independent member firms affiliated with KPMG International Cooperative (“KPMG
International”), a Swiss entity. All rights reserved. The KPMG name and logo are registered trademarks or trademarks of KPMG International. Liability limited by a scheme
approved under Professional Standards Legislation.
3.9.6 Schemes of Arrangement
For the claims
occurring period, where a claim filed against a company under a Scheme of Arrangement has been accepted and payment made, we have assumed that the insurance liabilities of that company to the Liable Entities have been fully discharged and no further
recoveries fall due.
3.9.7 Unpaid insurance recoveries
We have not included
within our liability estimate any allowance for insurance recoveries under the claims occurring period that are due but have not yet been collected (“unpaid balances”). We are advised that such monies amount to approximately $1.5m at
31 March 2017.
These amounts are more appropriately dealt with as being debtors of AICFL.
3.9.8 Claims made insurance protection from 31 May 1986 onwards
Insurance protection
purchased from 31 May 1986 to 31 March 1997 was placed on a “claims made” basis and as such may not provide protection or recoveries against the cost of future claim notifications made by claimants against the Liable Entities.
For the purpose of this Report, we have made no allowance for the value of these insurance policies in our liability assessment.
3.9.9 Bad and doubtful debt allowance on Insurance Recoveries
We have made allowance for bad
and doubtful debts on future Insurance Recoveries within our valuation by use of the default rates specified in Appendix A. These have been sourced from Standard & Poors’ 2015 Annual Global Corporate Default Study and Rating
Transitions, dated 2 May 2016 and they are based on bond default rates.
We have considered the credit rating of the insurers of the Liable Entities as at
March 2017 and applied the relevant credit rating default rates to the expected future cashflows by year, treaty and insurer.
Where additional information
regarding the expected payout rates of solvent and insolvent Schemes of Arrangement is available, we have instead taken the expected payout rates to assess the credit risk allowance to be made in our liability assessment.
3.10 Cross-claim recoveries
A cross-claim can be brought by, or against, one or more Liable
Entities. Cross-claims brought against a Liable Entity (“Contribution Claims”) are included in our analysis of the claims experience.
Cross-claims
brought by a Liable Entity relate to circumstances where the Liable Entity seeks to join (as a cross-defendant) another party to the claim in which the Liable Entity is already joined.
To the extent that the Liable Entities are successful in joining such other parties to a claim, the contribution to the settlement by the Liable Entities will reduce accordingly.
KPMG | 28
© 2017 KPMG, an Australian partnership and a member firm of
the KPMG network of independent member firms affiliated with KPMG International Cooperative (“KPMG
International”), a Swiss entity. All rights reserved.
The KPMG name and logo are registered trademarks or trademarks of KPMG International. Liability limited by a scheme approved under Professional Standards Legislation.
Our approach in the valuation has been to separately value the rate of recovery (“cross-claims recovery rate”) as a percentage
of the gross award based on historical experience of such recoveries.
Our analysis and assumptions selected are summarised in Section 9.5.
3.11 Discounting cashflows
Cashflows are discounted on the basis of yields available at the
valuation date on Commonwealth of Australia fixed interest Government Bonds (“Commonwealth Government Bonds”) of varying coupon rates and durations to maturity (matched to the liability cashflows), with a long-term discount rate of 5.50%
per annum assumed (March 2016: 6.00% per annum).
It should be recognised that the yield curves and therefore the discount rates applied can vary considerably
between valuations and can, and do, contribute significant volatility to the present value of the liability at different valuation dates.
There have been minor
variations in observed yields on Commonwealth Government Bonds in the last twelve months.
Our approach to the determination of the discount rates is unchanged from
the approach adopted at 31 March 2016, other than in relation to the selected long-term discount rate assumed, and is:
For years 1 to 16, zero coupon spot
rates were determined by reference to the prices, coupons and durations of Commonwealth Government Bonds;
For years 19 and onwards, we have selected a uniform
long-term discount rate of 5.50% per annum; and
For years 17 and 18, we have selected spot rates that “linearly interpolate” between the year-16 rate and the year-19 rate (of 5.50%).
Our selected assumptions are summarised in
Section 9.4.
We observe that the long-term discount rate assumption (5.50% per annum) does not materially affect the overall Discounted Central Estimate. This
is because the vast majority of the future cashflows (approximately 90%) are projected to be paid over the next 18 years. By way of illustration, if we selected a long-term discount rate of 5.00% per annum, the Discounted Central Estimate would
increase by approximately $3m (0.2%).
KPMG | 29
© 2017 KPMG, an
Australian partnership and a member firm of the KPMG network of independent member firms affiliated with KPMG International Cooperative (“KPMG
International”), a Swiss entity. All rights reserved. The KPMG name and logo are registered trademarks or trademarks of KPMG International. Liability limited
by a scheme approved under Professional Standards Legislation.
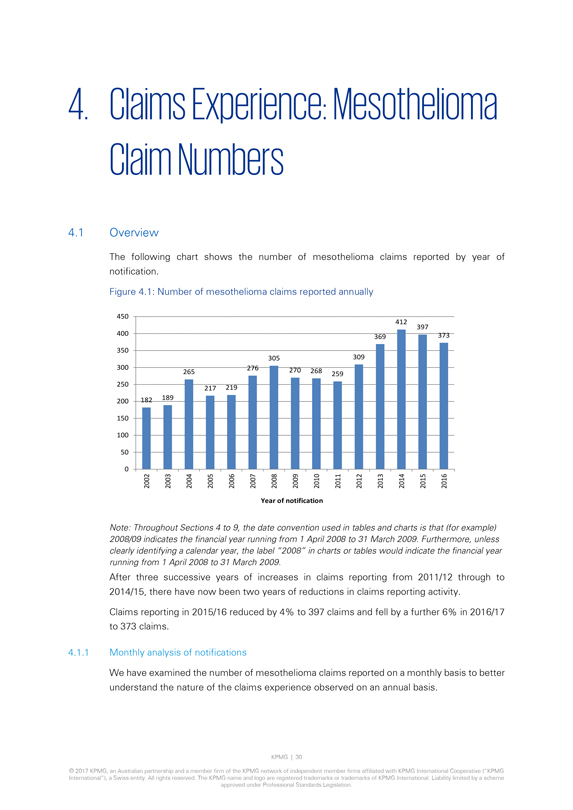
4. Claims Experience: Mesothelioma Claim Numbers
4.1 Overview
The following chart shows the number of mesothelioma claims
reported by year of notification.
Figure 4.1: Number of mesothelioma claims reported annually
450 400 350 300 250 200 150 100 50 0
182 189 265 217 219 276 305 270 268 259 309 369 412 397
373
2002 2003 2004 2005 2006 2007 2008 2009 2010 2011 2012 2013 2014 2015 2016
Year of notification
Note: Throughout Sections 4 to 9, the date convention
used in tables and charts is that (for example) 2008/09 indicates the financial year running from 1 April 2008 to 31 March 2009. Furthermore, unless clearly identifying a calendar year, the label “2008” in charts or tables would indicate
the financial year running from 1 April 2008 to 31 March 2009.
After three successive years of increases in claims reporting from 2011/12 through to 2014/15, there
have now been two years of reductions in claims reporting activity.
Claims reporting in 2015/16 reduced by 4% to 397 claims and fell by a further 6% in 2016/17 to
373 claims.
4.1.1 Monthly analysis of notifications
We have examined the
number of mesothelioma claims reported on a monthly basis to better understand the nature of the claims experience observed on an annual basis.
KPMG | 30
© 2017 KPMG, an Australian partnership and a member firm of the KPMG network of independent member firms affiliated with KPMG International Cooperative
(“KPMG
International”), a Swiss entity. All rights reserved. The KPMG name and logo are registered trademarks or trademarks of KPMG International.
Liability limited by a scheme approved under Professional Standards Legislation.
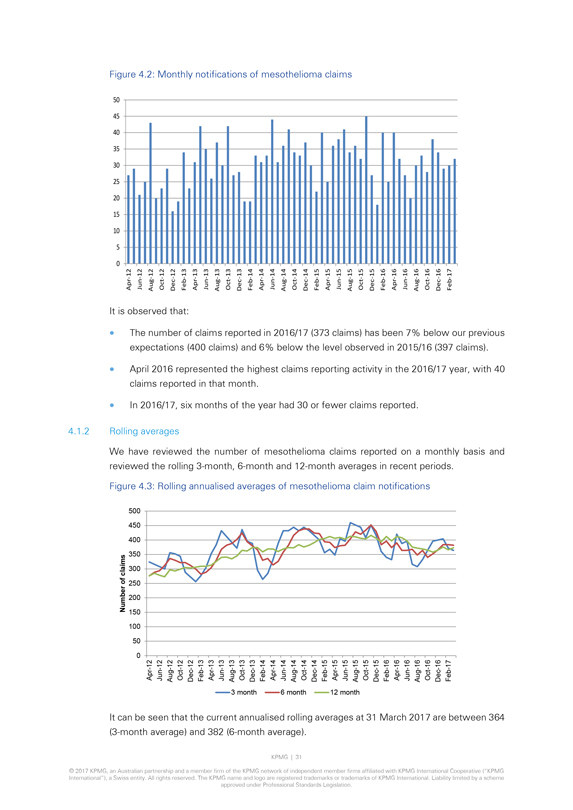
Figure 4.2: Monthly notifications of mesothelioma claims
0 5 10 15 20 25 30 35 40 45 50
Apr-12 Jun-12 Aug-12 Oct-12 Dec-12 Feb-13 Apr-13 Jun-13 Aug-13 Oct-13 Dec-13 Feb-14 Apr-14 Jun-14 Aug-14 Oct-14 Dec-14 Feb-15 Apr-15 Jun-15 Aug-15 Oct-15 Dec-15 Feb-16 Apr-16 Jun-16 Aug-16 Oct-16 Dec-16 Feb-17
It is observed that:
The number of claims reported in 2016/17 (373 claims) has been 7% below
our previous expectations (400 claims) and 6% below the level observed in 2015/16 (397 claims).
April 2016 represented the highest claims reporting activity in the
2016/17 year, with 40 claims reported in that month.
In 2016/17, six months of the year had 30 or fewer claims reported.
4.1.2 Rolling averages
We have reviewed the number of mesothelioma claims reported on a
monthly basis and reviewed the rolling 3-month, 6-month and 12-month averages in recent periods.
Figure 4.3: Rolling annualised averages of mesothelioma claim notifications
Number of claims 0
50 100 150 200 250 300 350 400 450 500
Apr-12 Jun-12
Aug-12 Oct-12 Dec-12 Feb-13 Apr-13 Jun-13 Aug-13 Oct-13 Dec-13 Feb-14 Apr-14 Jun-14 Aug-14 Oct-14 Dec-14 Feb-15 Apr-15 Jun-15 Aug-15 Oct-15 Dec-15 Feb-16 Apr-16 Jun-16 Aug-16 Oct-16 Dec-16 Feb-17
3 month 6 month 12 month
It can be seen that the current annualised rolling averages at 31 March 2017 are between 364 (3-month average) and 382 (6-month average).
KPMG | 31
© 2017
KPMG, an Australian partnership and a member firm of the KPMG network of independent member firms affiliated with KPMG International Cooperative (“KPMG
International”), a Swiss entity. All rights reserved. The KPMG name and logo are registered trademarks or trademarks of KPMG International. Liability limited
by a scheme approved under Professional Standards Legislation.
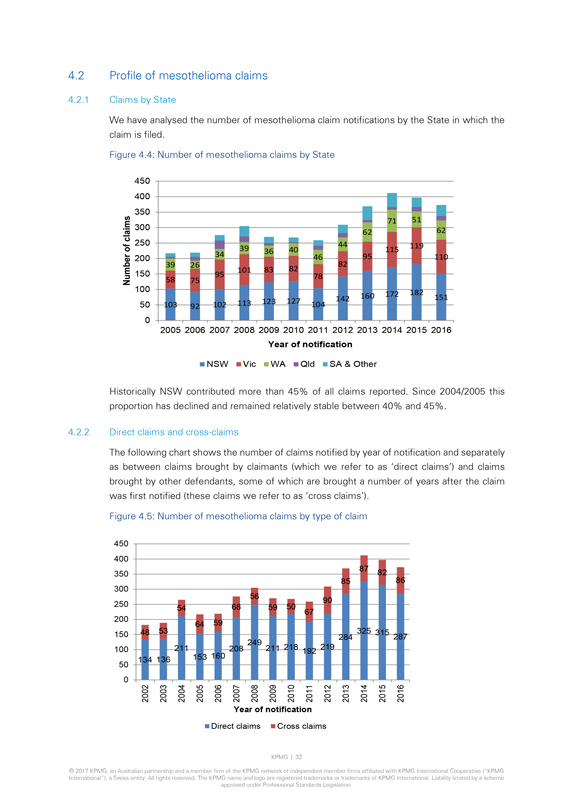
4.2 Profile of mesothelioma claims
4.2.1 Claims by
State
We have analysed the number of mesothelioma claim notifications by the State in which the claim is filed.
Figure 4.4: Number of mesothelioma claims by State
Number of claims 0 50 100 150 200 250 300
350 400 450
39 58 103 26 75 92 34 95 102 39 101 113 36 83 123 40 82 127 46 78 104 44 82 142 62 95 160 71 115 172 51 119 182 62 110 151
2005 2006 2007 2008 2009 2010 2011 2012 2013 2014 2015 2016
Year of notification
NSW Vic WA Qld SA & Other
Historically NSW contributed more than 45% of all claims
reported. Since 2004/2005 this proportion has declined and remained relatively stable between 40% and 45%.
4.2.2 Direct claims and cross-claims
The following chart shows the number of claims notified by year of notification and separately as between claims brought by claimants (which we refer to as ‘direct
claims’) and claims brought by other defendants, some of which are brought a number of years after the claim was first notified (these claims we refer to as ‘cross claims’).
Figure 4.5: Number of mesothelioma claims by type of claim
0 50 100 150 200 250 300 350 400
450
48 134 53 136 54 211 64 153 59 160 68 208 56 249 59 211 50 218 67 192 90 219 85 284 87 325 82 315 86 287
2002 2003 2004 2005 2006 2007 2008 2009 2010 2011 2012 2013 2014 2015 2016
Year of
notification Direct claims Cross claims
KPMG | 32
© 2017 KPMG, an
Australian partnership and a member firm of the KPMG network of independent member firms affiliated with KPMG International Cooperative (“KPMG
International”), a Swiss entity. All rights reserved. The KPMG name and logo are registered trademarks or trademarks of KPMG International. Liability limited
by a scheme approved under Professional Standards Legislation.
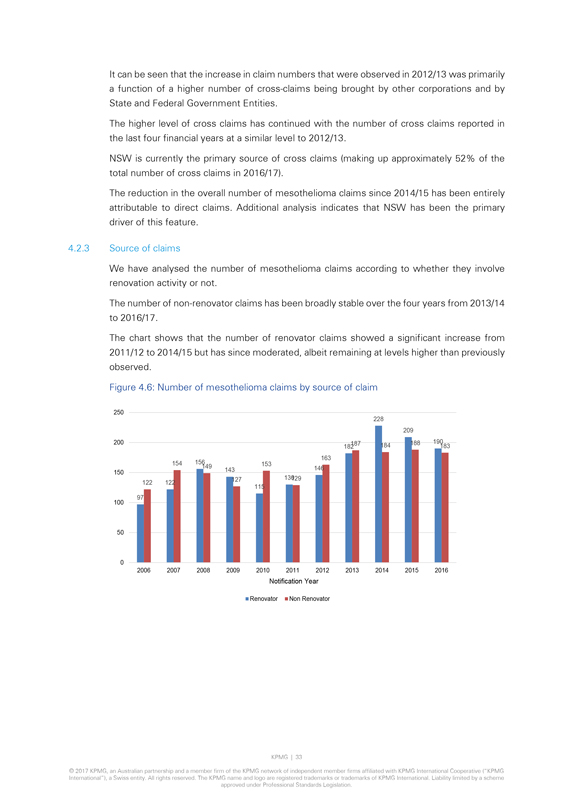
It can be seen that the increase in claim numbers that were observed in 2012/13 was primarily a function of a higher number of
cross-claims being brought by other corporations and by State and Federal Government Entities.
The higher level of cross claims has continued with the number of
cross claims reported in the last four financial years at a similar level to 2012/13.
NSW is currently the primary source of cross claims (making up approximately
52% of the total number of cross claims in 2016/17).
The reduction in the overall number of mesothelioma claims since 2014/15 has been entirely attributable to
direct claims. Additional analysis indicates that NSW has been the primary driver of this feature.
4.2.3 Source of claims
We have analysed the number of mesothelioma claims according to whether they involve renovation activity or not.
The number of non-renovator claims has been broadly stable over the four years from 2013/14 to 2016/17.
The chart shows that the number of renovator claims showed a significant increase from 2011/12 to 2014/15 but has since moderated, albeit remaining at levels higher than previously
observed.
Figure 4.6: Number of mesothelioma claims by source of claim
0 50
100 150 200 250
97 122 122 154 156 149 143 127 115 153 130 129 146 163 182 187 228 184 209 188 190 183
2006 2007 2008 2009 2010 2011 2012 2013 2014 2015 2016
Notification Year
Renovator Non Renovator
KPMG | 33
© 2017 KPMG, an Australian partnership and a member firm of the KPMG network of independent member firms affiliated with KPMG International Cooperative (“KPMG
International”), a Swiss entity. All rights reserved. The KPMG name and logo are registered trademarks or trademarks of KPMG International. Liability limited by a scheme
approved under Professional Standards Legislation.
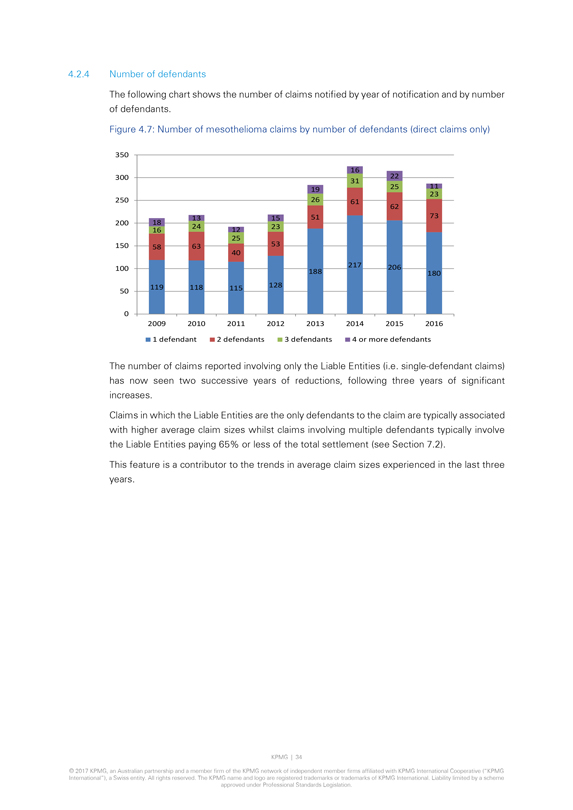
4.2.4 Number of defendants
The following chart
shows the number of claims notified by year of notification and by number of defendants.
Figure 4.7: Number of mesothelioma claims by number of defendants (direct
claims only)
0 50 100 150 200 250 300 350
18 16 58 119 13 24 63 118 12 25 40
115 15 23 53 128 19 26 51 188 16 31 61 217 22 25 62 206 11 23 73 180
2009 2010 2011 2012 2013 2014 2015 2016
1 defendant
2 defendants
3 defendants
4 or more defendants
The number of claims reported involving only the Liable Entities (i.e. single-defendant claims) has now seen two successive years of reductions, following three years of
significant increases.
Claims in which the Liable Entities are the only defendants to the claim are typically associated with higher average claim sizes whilst
claims involving multiple defendants typically involve the Liable Entities paying 65% or less of the total settlement (see Section 7.2).
This feature is a
contributor to the trends in average claim sizes experienced in the last three years.
KPMG | 34
© 2017 KPMG, an Australian partnership and a member firm of the KPMG network of independent member firms affiliated with KPMG International Cooperative (“KPMG
International”), a Swiss entity. All rights reserved. The KPMG name and logo are registered trademarks or trademarks of KPMG International. Liability limited by a scheme
approved under Professional Standards Legislation.
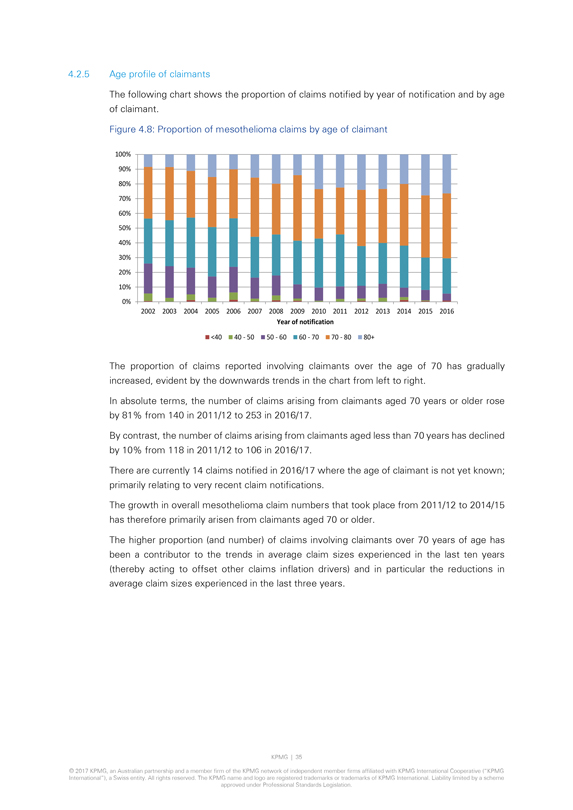
4.2.5 Age profile of claimants
The following chart
shows the proportion of claims notified by year of notification and by age of claimant.
Figure 4.8: Proportion of mesothelioma claims by age of claimant
0% 10% 20% 30% 40% 50% 60% 70% 80% 90% 100%
2002 2003 2004 2005 2006 2007
2008 2009 2010 2011 2012 2013 2014 2015 2016
Year of notification
<40 40 -
50 50 - 60 60 - 70 70 - 80 80+
The proportion of claims reported involving claimants over the age of 70 has gradually increased, evident by the downwards trends in
the chart from left to right.
In absolute terms, the number of claims arising from claimants aged 70 years or older rose by 81% from 140 in 2011/12 to 253 in
2016/17.
By contrast, the number of claims arising from claimants aged less than 70 years has declined by 10% from 118 in 2011/12 to 106 in 2016/17.
There are currently 14 claims notified in 2016/17 where the age of claimant is not yet known; primarily relating to very recent claim notifications.
The growth in overall mesothelioma claim numbers that took place from 2011/12 to 2014/15 has therefore primarily arisen from claimants aged 70 or older.
The higher proportion (and number) of claims involving claimants over 70 years of age has been a contributor to the trends in average claim sizes experienced in the last ten years
(thereby acting to offset other claims inflation drivers) and in particular the reductions in average claim sizes experienced in the last three years.
KPMG | 35
© 2017 KPMG, an Australian partnership and a member firm of the KPMG network of independent member firms affiliated with KPMG International Cooperative
(“KPMG
International”), a Swiss entity. All rights reserved. The KPMG name and logo are registered trademarks or trademarks of KPMG International.
Liability limited by a scheme approved under Professional Standards Legislation.
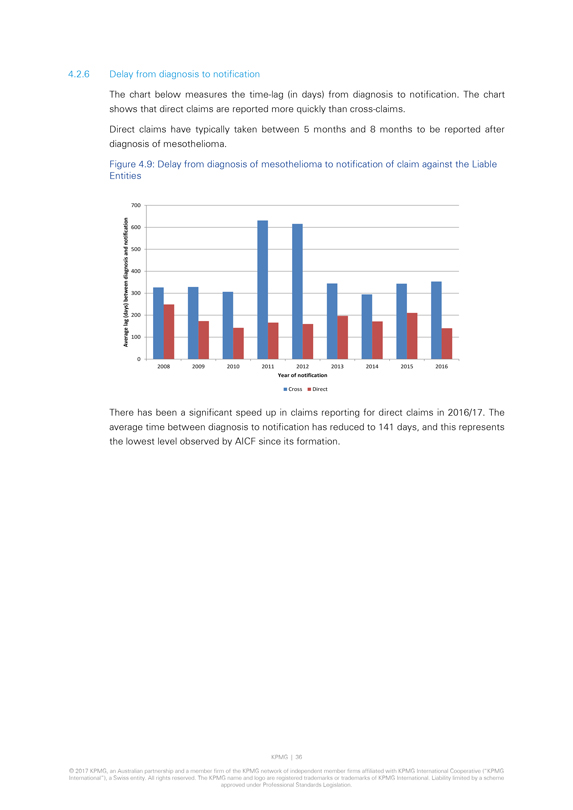
4.2.6 Delay from diagnosis to notification The chart below measures the time-lag (in days) from
diagnosis to notification. The chart shows that direct claims are reported more quickly than cross-claims.
Direct claims have typically taken between 5 months and
8 months to be reported after diagnosis of mesothelioma.
Figure 4.9: Delay from diagnosis of mesothelioma to notification of claim against the Liable Entities 700
Average lag (days) between diagnosis and notification 600 500 400 300 200 100 0 2008 2009 2010 2011 2012 2013 2014 2015 2016
Year of notification
Cross Direct
There has been a significant speed up in claims reporting for direct claims in
2016/17. The average time between diagnosis to notification has reduced to 141 days, and this represents the lowest level observed by AICF since its formation.
KPMG | 36
© 2017 KPMG, an Australian partnership and a member firm of
the KPMG network of independent member firms affiliated with KPMG International Cooperative (“KPMG
International”), a Swiss entity. All rights reserved.
The KPMG name and logo are registered trademarks or trademarks of KPMG International. Liability limited by a scheme approved under Professional Standards Legislation.
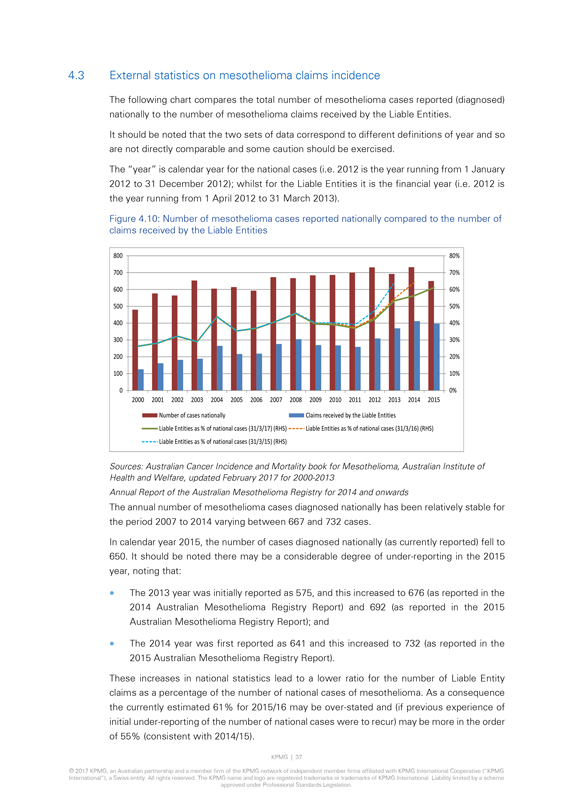
4.3 External statistics on mesothelioma claims incidence
The following chart compares the total number of mesothelioma cases reported (diagnosed) nationally to the number of mesothelioma claims received by the Liable Entities.
It should be noted that the two sets of data correspond to different definitions of year and so are not directly comparable and some caution should be exercised.
The “year” is calendar year for the national cases (i.e. 2012 is the year running from 1 January 2012 to 31 December 2012); whilst for the Liable Entities it is the financial year (i.e. 2012 is the year running from 1 April 2012 to 31
March 2013).
Figure 4.10: Number of mesothelioma cases reported nationally compared to the number of claims received by the Liable Entities
800 80% 700 70% 600 60% 500 50% 400 40% 300 30% 200 20% 100 10% 0
0% 2000 2001 2002 2003 2004
2005 2006 2007 2008 2009 2010 2011 2012 2013 2014 2015 Number of cases nationally Claims received by the Liable Entities Liable Entities as % of national cases (31/3/17) (RHS) Liable Entities as % of national cases (31/3/16) (RHS) Liable Entities as
% of national cases (31/3/15) (RHS) Sources: Australian Cancer Incidence and Mortality book for Mesothelioma, Australian Institute of Health and Welfare, updated February 2017 for 2000-2013 Annual Report of the Australian Mesothelioma Registry for
2014 and onwards
The annual number of mesothelioma cases diagnosed nationally has been relatively stable for the period 2007 to 2014 varying between 667 and 732
cases. In calendar year 2015, the number of cases diagnosed nationally (as currently reported) fell to 650. It should be noted there may be a considerable degree of under-reporting in the 2015 year, noting that:
The 2013 year was initially reported as 575, and this increased to 676 (as reported in the 2014 Australian Mesothelioma Registry Report) and 692 (as reported in the 2015 Australian
Mesothelioma Registry Report); and
The 2014 year was first reported as 641 and this increased to 732 (as reported in the 2015 Australian Mesothelioma Registry
Report).
These increases in national statistics lead to a lower ratio for the number of Liable Entity claims as a percentage of the number of national cases of
mesothelioma. As a consequence the currently estimated 61% for 2015/16 may be over-stated and (if previous experience of initial under-reporting of the number of national cases were to recur) may be more in the order of 55% (consistent with
2014/15). KPMG | 37 © 2017 KPMG, an Australian partnership and a member firm of the KPMG network of independent member firms affiliated with KPMG International Cooperative (“KPMG International”), a Swiss entity. All rights reserved.
The KPMG name and logo are registered trademarks or trademarks of KPMG International. Liability limited by a scheme approved under Professional Standards Legislation.
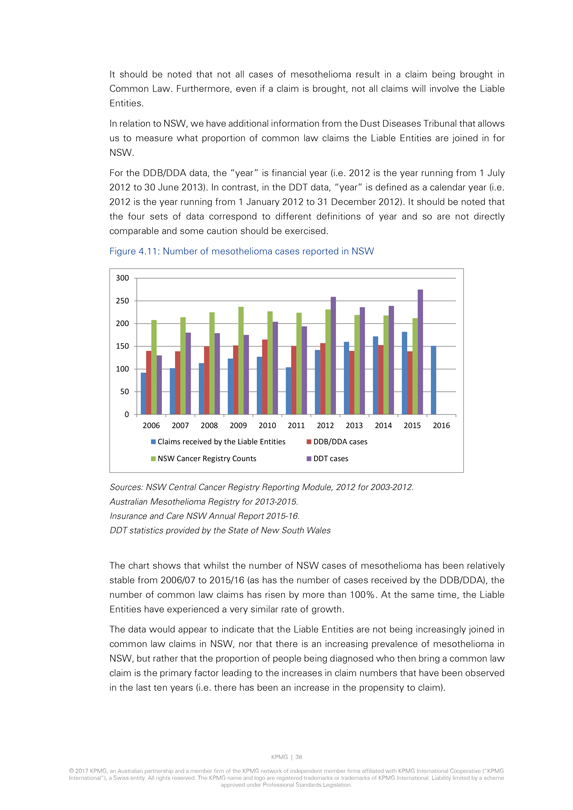
It should be noted that not all cases of mesothelioma result in a claim being brought in Common Law. Furthermore, even if a claim is brought, not all claims will involve the Liable Entities. In relation to NSW, we have additional information from the Dust Diseases Tribunal that allows us to measure what proportion of common law claims the Liable Entities are joined in for NSW. For the DDB/DDA data, the “year” is financial year (i.e. 2012 is the year running from 1 July 2012 to 30 June 2013). In contrast, in the DDT data, “year” is defined as a calendar year (i.e. 2012 is the year running from 1 January 2012 to 31 December 2012). It should be noted that the four sets of data correspond to different definitions of year and so are not directly comparable and some caution should be exercised. Figure 4.11: Number of mesothelioma cases reported in NSW 300 250 200 150 100 50 0 2006 2007 2008 2009 2010 2011 2012 2013 2014 2015 2016 Claims received by the Liable Entities DDB/DDA cases NSW Cancer Registry Counts DDT cases Sources: NSW Central Cancer Registry Reporting Module, 2012 for 2003-2012. Australian Mesothelioma Registry for 2013-2015. Insurance and Care NSW Annual Report 2015-16. DDT statistics provided by the State of New South Wales The chart shows that whilst the number of NSW cases of mesothelioma has been relatively stable from 2006/07 to 2015/16 (as has the number of cases received by the DDB/DDA), the number of common law claims has risen by more than 100%. At the same time, the Liable Entities have experienced a very similar rate of growth. The data would appear to indicate that the Liable Entities are not being increasingly joined in common law claims in NSW, nor that there is an increasing prevalence of mesothelioma in NSW, but rather that the proportion of people being diagnosed who then bring a common law claim is the primary factor leading to the increases in claim numbers that have been observed in the last ten years (i.e. there has been an increase in the propensity to claim). KPMG | 38 © 2017 KPMG, an Australian partnership and a member firm of the KPMG network of independent member firms affiliated with KPMG International Cooperative (“KPMG International”), a Swiss entity. All rights reserved. The KPMG name and logo are registered trademarks or trademarks of KPMG International. Liability limited by a scheme approved under Professional Standards Legislation.
4.4 Base valuation assumption for number of mesothelioma claims The actual claims experience in 2016/17 has been favourable compared to expectations for 2016/17 in relation to overall mesothelioma claim numbers and therefore it has provided no evidence, at this time, for a higher level of claims reporting being assumed in 2017/18. Equally, whilst experience has been favourable, this is the first year of materially favourable experience in the last four years. Therefore, at this time, there is no strong evidence to support a reduction in the levels of future claims reporting to be assumed. Therefore, we have selected our assumption of 372 claims for 2017/18; this being the same level that had previously been assumed (at 31 March 2016) for the level of claims reporting for 2017/18. There remain material uncertainties in relation to the base level of claims reporting and it is possible that claims activity could increase next year, or fall next year. There also remain material uncertainties as to the pace at which future claims reporting will reduce (“the decay rate”) as well as the rate of co-joining of the Liable Entities in common law claims. Depending on the outcome of future experience, further changes to the valuation assumptions and therefore to the valuation results may be necessary in future periods. Such changes could be material. As a consequence of the above noted uncertainties, further volatility in relation to the valuation result should be anticipated for at least the next few years. KPMG | 39 © 2017 KPMG, an Australian partnership and a member firm of the KPMG network of independent member firms affiliated with KPMG International Cooperative (“KPMG International”), a Swiss entity. All rights reserved. The KPMG name and logo are registered trademarks or trademarks of KPMG International. Liability limited by a scheme approved under Professional Standards Legislation.
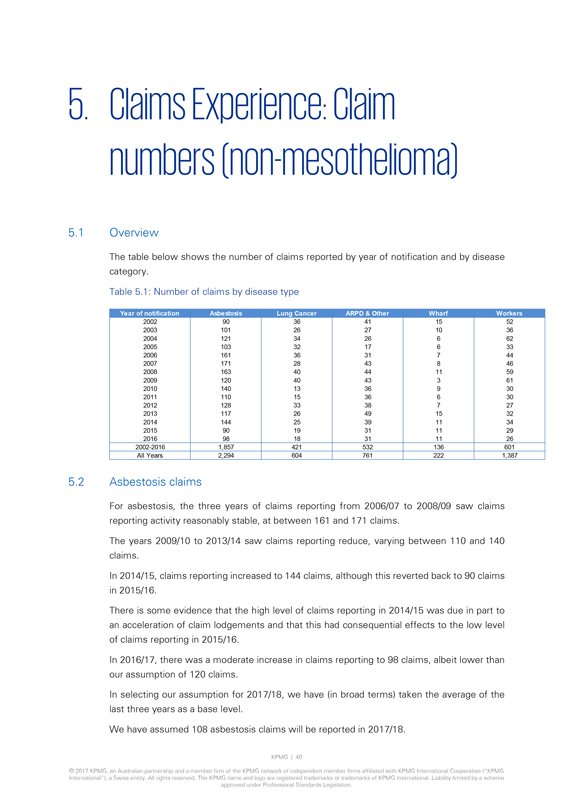
5. Claims Experience: Claim numbers (non-mesothelioma) 5.1 Overview The table below shows the number of claims reported by year of notification and by disease category. Table 5.1: Number of claims by disease type Year of notification Asbestosis Lung Cancer ARPD & Other Wharf Workers 2002 90 36 41 15 52 2003 101 26 27 10 36 2004 121 34 26 6 62 2005 103 32 17 6 33 2006 161 36 31 7 44 2007 171 28 43 8 46 2008 163 40 44 11 59 2009 120 40 43 3 61 2010 140 13 36 9 30 2011 110 15 36 6 30 2012 128 33 38 7 27 2013 117 26 49 15 32 2014 144 25 39 11 34 2015 90 19 31 11 29 2016 98 18 31 11 26 2002-2016 1,857 421 532 136 601 All Years 2,294 604 761 222 1,387 5.2 Asbestosis claims For asbestosis, the three years of claims reporting from 2006/07 to 2008/09 saw claims reporting activity reasonably stable, at between 161 and 171 claims. The years 2009/10 to 2013/14 saw claims reporting reduce, varying between 110 and 140 claims. In 2014/15, claims reporting increased to 144 claims, although this reverted back to 90 claims in 2015/16. There is some evidence that the high level of claims reporting in 2014/15 was due in part to an acceleration of claim lodgements and that this had consequential effects to the low level of claims reporting in 2015/16. In 2016/17, there was a moderate increase in claims reporting to 98 claims, albeit lower than our assumption of 120 claims. In selecting our assumption for 2017/18, we have (in broad terms) taken the average of the last three years as a base level. We have assumed 108 asbestosis claims will be reported in 2017/18. KPMG | 40 © 2017 KPMG, an Australian partnership and a member firm of the KPMG network of independent member firms affiliated with KPMG International Cooperative (“KPMG International”), a Swiss entity. All rights reserved. The KPMG name and logo are registered trademarks or trademarks of KPMG International. Liability limited by a scheme approved under Professional Standards Legislation.
5.3 Lung cancer claims
The number of lung cancer
claims reported has typically been between 25 and 40 claims per annum.
However, reporting in 2010/11 and 2011/12 was substantially lower, at 13 and 15 claims
respectively.
In 2015/16, the number of claims reported fell to 19 and in 2016/17 it reduced to 18 claims. In selecting our assumption for 2017/18, we have (in
broad terms) taken the average of the last three years as a base level.
We have assumed 21 lung cancer claims will be reported in 2017/18.
5.4 ARPD & Other claims
The number of ARPD & Other claims, has typically been between
30 and 45 over the last eleven years, although in 2013/14 the number of claims reported was the highest observed historically, at 49 claims.
In both 2015/16 and
2016/17, the number of claims reported was 31.
In selecting our assumption for 2017/18, we have (in broad terms) taken the average of the last three years as a
base level.
We have assumed 33 ARPD & Other claims will be reported in 2017/18.
5.5 Workers Compensation and Wharf claims
The number of Workers Compensation claims, including
those met in full by the Liable Entities’ Workers Compensation insurers, has historically exhibited some degree of volatility. However claims reporting activity has been relatively stable in the most recent seven years ranging from 26 claims to
34 claims.
In 2015/16 there were 29 claims reported, in 2016/17 there were 26 claims reported. We have assumed 30 Workers Compensation claims will be reported in
2017/18. It should be noted that the financial impact of this source of claim is not substantial to the Liable Entities given the proportion of claims which are settled for nil liability against the Liable Entities (typically above 90%), which
results from the insurance arrangements in place. For Wharf claims, there have been 11 claims reported in each of the last three years. We have assumed 12 claims will be notified in 2017/18. Again, the financial impact of this source of claim is not
currently significant.
KPMG | 41
© 2017 KPMG, an Australian partnership
and a member firm of the KPMG network of independent member firms affiliated with KPMG International Cooperative (“KPMG International”), a Swiss entity. All rights reserved. The KPMG name and logo are registered trademarks or trademarks of
KPMG International. Liability limited by a scheme approved under Professional Standards Legislation.
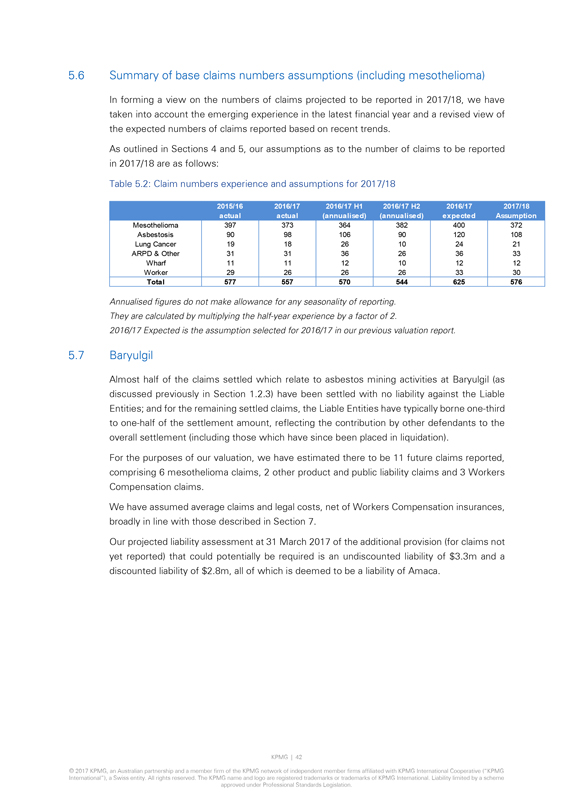
5.6 Summary of base claims numbers assumptions (including mesothelioma)
In forming a view on the numbers of claims projected to be reported in 2017/18, we have taken into account the emerging experience in the latest financial year and a revised view
of the expected numbers of claims reported based on recent trends.
As outlined in Sections 4 and 5, our assumptions as to the number of claims to be reported in
2017/18 are as follows: Table 5.2: Claim numbers experience and assumptions for 2017/18
2015/16 2016/17 2016/17 H1 2016/17 H2 2016/17 2017/18
actual actual (annualised) (annualised) expected Assumption
Mesothelioma 397 373 364 382 400
372
Asbestosis 90 98 106 90 120 108
Lung Cancer 19 18 26 10 24 21
ARPD & Other 31 31 36 26 36 33
Wharf 11 11 12 10 12 12
Worker 29 26 26 26 33 30
Total 577 557 570 544 625 576
Annualised figures do not make allowance for any seasonality of reporting. They are calculated by multiplying the half-year experience by a factor of 2.
2016/17 Expected is the assumption selected for 2016/17 in our previous valuation report.
5.7
Baryulgil
Almost half of the claims settled which relate to asbestos mining activities at Baryulgil (as discussed previously in Section 1.2.3) have been settled
with no liability against the Liable Entities; and for the remaining settled claims, the Liable Entities have typically borne one-third to one-half of the settlement
amount, reflecting the contribution by other defendants to the overall settlement (including those which have since been placed in liquidation).
For the purposes
of our valuation, we have estimated there to be 11 future claims reported, comprising 6 mesothelioma claims, 2 other product and public liability claims and 3 Workers Compensation claims.
We have assumed average claims and legal costs, net of Workers Compensation insurances, broadly in line with those described in Section 7.
Our projected liability assessment at 31 March 2017 of the additional provision (for claims not yet reported) that could potentially be required is an undiscounted liability of
$3.3m and a discounted liability of $2.8m, all of which is deemed to be a liability of Amaca.
KPMG | 42
© 2017 KPMG, an Australian partnership and a member firm of the KPMG network of independent member firms affiliated with KPMG International Cooperative (“KPMG
International”), a Swiss entity. All rights reserved. The KPMG name and logo are registered trademarks or trademarks of KPMG International. Liability limited by a scheme
approved under Professional Standards Legislation.
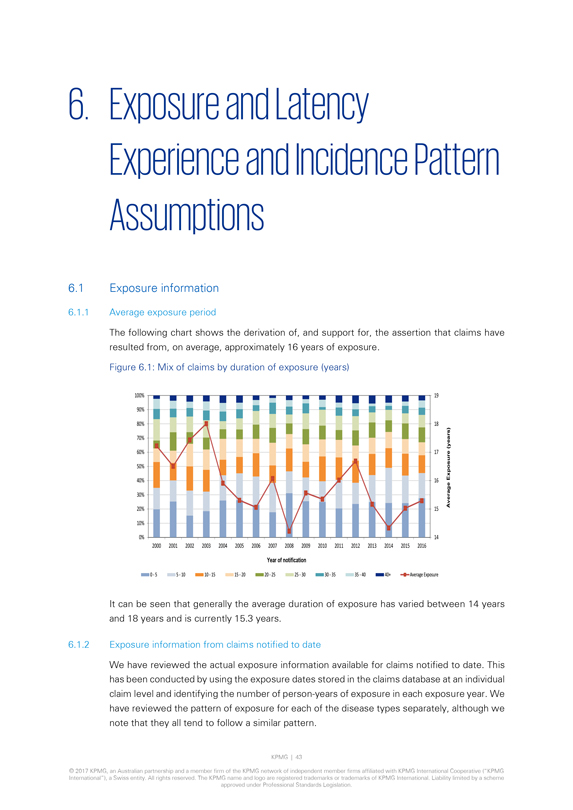
6. Exposure and Latency
Experience and Incidence
Pattern
Assumptions
6.1 Exposure information
6.1.1 Average exposure period
The following chart shows the derivation of, and support for,
the assertion that claims have resulted from, on average, approximately 16 years of exposure.
Figure 6.1: Mix of claims by duration of exposure (years)
100% 19
90%
80% 18
70%
60% 17
50%
40% 16
30%
Average Exposure (years)
20% 15
10%
0% 14
2000
2001 2002
2003 2004
2005
2006
2007 2008 2009
2010 2011
2012 2013
2014
2015
2016
Year of notification
0 - 5
5 - 10
10 - 15
15 - 20
20 - 25
25 - 30
30 - 35
35 - 40
40+ Average Exposure
It can be seen that generally the average duration of exposure has varied
between 14 years and 18 years and is currently 15.3 years.
6.1.2 Exposure information from claims notified to date
We have reviewed the actual exposure information available for claims notified to date. This has been conducted by using the exposure dates stored in the claims database at an
individual claim level and identifying the number of person-years of exposure in each exposure year. We have reviewed the pattern of exposure for each of the disease types separately, although we note that they all tend to follow a similar pattern.
KPMG | 43
© 2017 KPMG, an Australian partnership and a member firm of
the KPMG network of independent member firms affiliated with KPMG International Cooperative (“KPMG
International”), a Swiss entity. All rights reserved.
The KPMG name and logo are registered trademarks or trademarks of KPMG International. Liability limited by a scheme approved under Professional Standards Legislation.
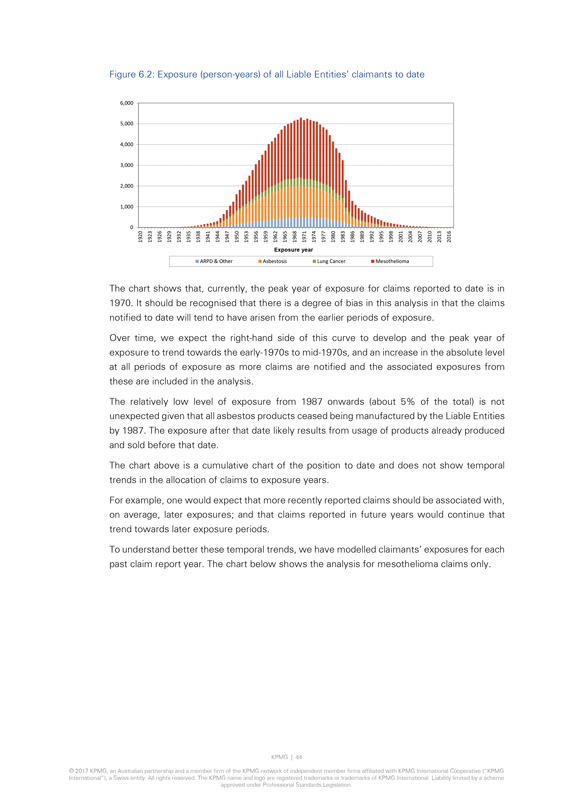
Figure 6.2: Exposure (person-years) of all Liable Entities’ claimants to date
0
1,000
2,000
3,000
4,000
5,000
6,000
1920
1923
1926
1929
1932
1935
1938
ARPD 1941 & 1944 Other
1947
1950
1953
1956
1959
1962
Asbestosis 1965 Exposure
1968 year
1971
1974 Lung
1977 1980 Cancer
1983
1986
1989
1992
1995
1998
Mesothelioma 2001 2004 2007 2010 2013 2016
The chart shows that, currently,
the peak year of exposure for claims reported to date is in 1970. It should be recognised that there is a degree of bias in this analysis in that the claims notified to date will tend to have arisen from the earlier periods of exposure.
Over time, we expect the right-hand side of this curve to develop and the peak year of exposure to trend towards the early-1970s to
mid-1970s, and an increase in the absolute level at all periods of exposure as more claims are notified and the associated exposures from these are included in the analysis.
The relatively low level of exposure from 1987 onwards (about 5% of the total) is not unexpected given that all asbestos products ceased being manufactured by the Liable Entities
by 1987. The exposure after that date likely results from usage of products already produced and sold before that date.
The chart above is a cumulative chart of
the position to date and does not show temporal trends in the allocation of claims to exposure years.
For example, one would expect that more recently reported
claims should be associated with, on average, later exposures; and that claims reported in future years would continue that trend towards later exposure periods.
To understand better these temporal trends, we have modelled claimants’ exposures for each past claim report year. The chart below shows the analysis for
mesothelioma claims only.
KPMG | 44
© 2017 KPMG, an Australian
partnership and a member firm of the KPMG network of independent member firms affiliated with KPMG International Cooperative (“KPMG
International”), a
Swiss entity. All rights reserved. The KPMG name and logo are registered trademarks or trademarks of KPMG International. Liability limited by a scheme approved under Professional Standards Legislation.
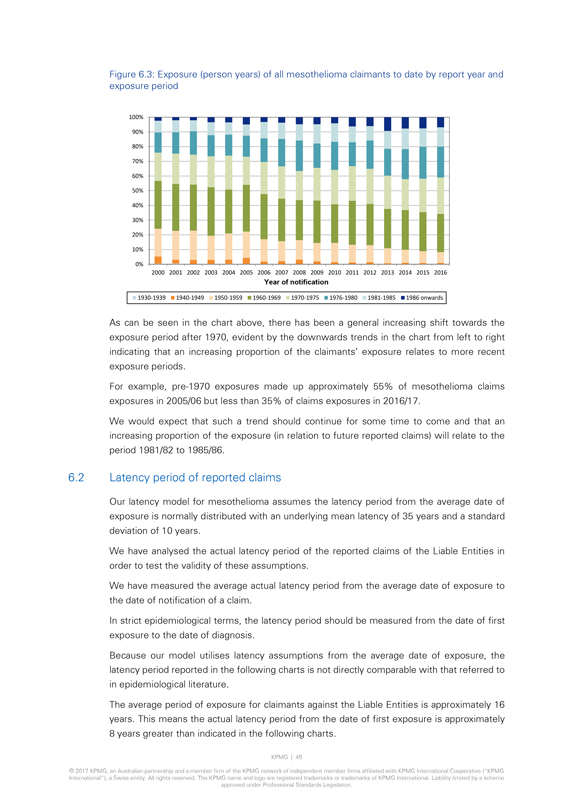
Figure 6.3: Exposure (person years) of all mesothelioma claimants to date by report year and exposure period
100% 90% 80% 70% 60% 50% 40% 30% 20% 10% 0%
2000 2001 2002 2003 2004 2005 2006 2007 2008 2009
2010 2011 2012 2013 2014 2015 2016
Year of notification
1930-1939 1940-1949
1950-1959 1960-1969 1970-1975 1976-1980 1981-1985 1986 onwards
As can be seen in the chart above, there has been a general increasing shift towards the exposure
period after 1970, evident by the downwards trends in the chart from left to right indicating that an increasing proportion of the claimants’ exposure relates to more recent exposure periods.
For example, pre-1970 exposures made up approximately 55% of mesothelioma claims exposures in 2005/06 but less than 35% of claims exposures
in 2016/17.
We would expect that such a trend should continue for some time to come and that an increasing proportion of the exposure (in relation to future
reported claims) will relate to the period 1981/82 to 1985/86.
6.2 Latency period of reported claims
Our latency model for mesothelioma assumes the latency period from the average date of exposure is normally distributed with an underlying mean latency of 35 years and a standard
deviation of 10 years.
We have analysed the actual latency period of the reported claims of the Liable Entities in order to test the validity of these assumptions.
We have measured the average actual latency period from the average date of exposure to the date of notification of a claim.
In strict epidemiological terms, the latency period should be measured from the date of first exposure to the date of diagnosis.
Because our model utilises latency assumptions from the average date of exposure, the latency period reported in the following charts is not directly comparable with that referred
to in epidemiological literature.
The average period of exposure for claimants against the Liable Entities is approximately 16 years. This means the actual latency
period from the date of first exposure is approximately 8 years greater than indicated in the following charts.
KPMG | 45
© 2017 KPMG, an Australian partnership and a member firm of the KPMG network of independent member firms affiliated with KPMG International Cooperative (“KPMG
International”), a Swiss entity. All rights reserved. The KPMG name and logo are registered trademarks or trademarks of KPMG International. Liability limited by a scheme
approved under Professional Standards Legislation.
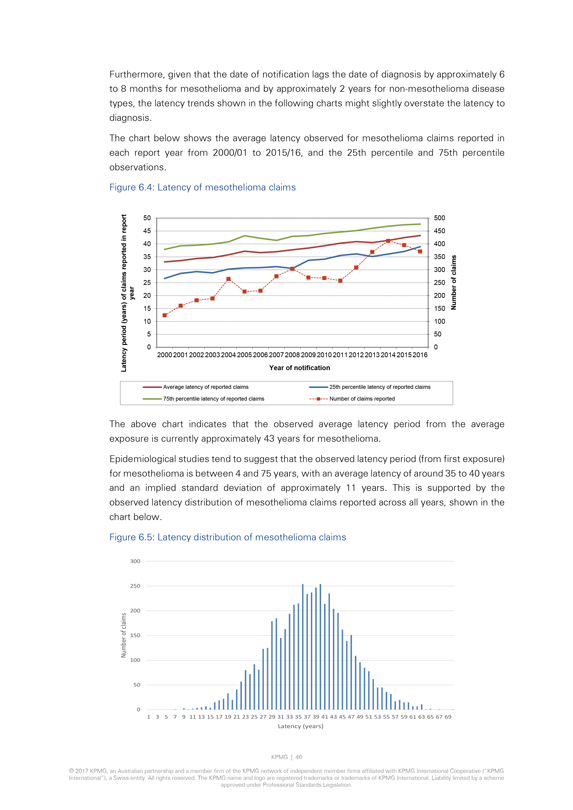
Furthermore, given that the date of notification lags the date of diagnosis by approximately 6 to 8 months for mesothelioma and by
approximately 2 years for non-mesothelioma disease types, the latency trends shown in the following charts might slightly overstate the latency to diagnosis.
The chart below shows the average latency observed for mesothelioma claims reported in each report year from 2000/01 to 2015/16, and the 25th percentile and 75th percentile
observations.
Figure 6.4: Latency of mesothelioma claims
50 500 45 450 40 400
35 350 30 300 25 250 20 200
Number of claims 15 150 10 100 5 50 0 0
2000 2001
2002 2003 2004 2005 2006 2007 2008 2009 2010 2011 2012 2013 2014 2015 2016
Latency period (years) of claims reported in report Year
Year of notification
Average latency of reported claims
25th percentile latency of reported claims
75th percentile latency of reported claims
Number of claims reported
The above chart indicates that the observed average
latency period from the average exposure is currently approximately 43 years for mesothelioma.
Epidemiological studies tend to suggest that the observed latency
period (from first exposure) for mesothelioma is between 4 and 75 years, with an average latency of around 35 to 40 years and an implied standard deviation of approximately 11 years. This is supported by the observed latency distribution of
mesothelioma claims reported across all years, shown in the chart below.
Figure 6.5: Latency distribution of mesothelioma claims
300 250 200 claims of 150 Number 100 50 0 1 3 5 7
9 11 13 15 17 19 21 23 25 27 29 31 33 35 37
39 41 43 45 47 49 51 53 55 57 59 61 63 65 67 69 Latency (years)
© 2017 KPMG, an Australian partnership and a member firm of the KPMG network of independent
member firms affiliated with KPMG International Cooperative (“KPMG
International”), a Swiss entity. All rights reserved. The KPMG name and logo are
registered trademarks or trademarks of KPMG International. Liability limited by a scheme approved under Professional Standards Legislation.
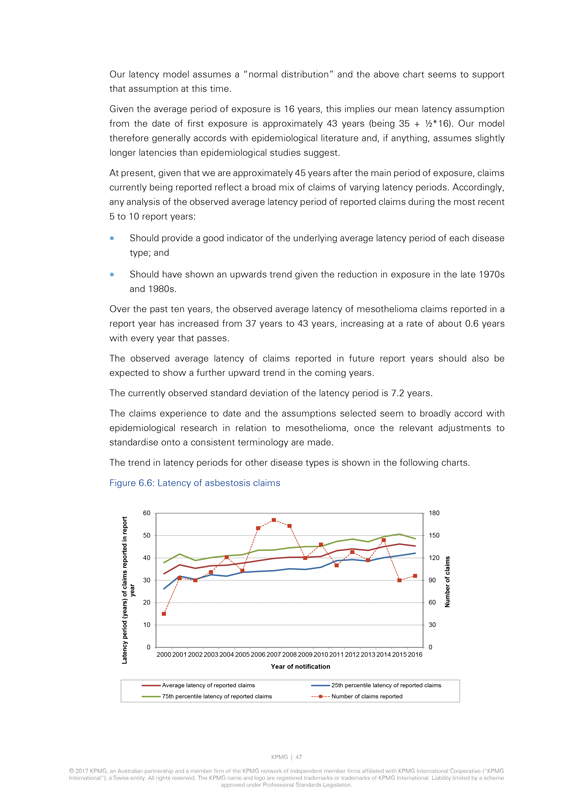
Our latency model assumes a “normal distribution” and the above chart seems to support that assumption at this time.
Given the average period of exposure is 16 years, this implies our mean latency assumption from the date of first exposure is approximately 43 years (being 35 + 1⁄2*16). Our model therefore generally accords with epidemiological literature and, if anything, assumes slightly longer latencies than epidemiological studies
suggest.
At present, given that we are approximately 45 years after the main period of exposure, claims currently being reported reflect a broad mix of claims of
varying latency periods. Accordingly, any analysis of the observed average latency period of reported claims during the most recent 5 to 10 report years:
Should
provide a good indicator of the underlying average latency period of each disease type; and
Should have shown an upwards trend given the reduction in exposure in
the late 1970s and 1980s.
Over the past ten years, the observed average latency of mesothelioma claims reported in a report year has increased from 37 years to 43
years, increasing at a rate of about 0.6 years with every year that passes.
The observed average latency of claims reported in future report years should also be
expected to show a further upward trend in the coming years.
The currently observed standard deviation of the latency period is 7.2 years.
The claims experience to date and the assumptions selected seem to broadly accord with epidemiological research in relation to mesothelioma, once the relevant adjustments to
standardise onto a consistent terminology are made.
The trend in latency periods for other disease types is shown in the following charts.
Figure 6.6: Latency of asbestosis claims
60 180 50 150 40 120 30 90 20 60 Number of claims 10
30 0 0
Latency period (years) of claims reported in Report year
2000 2001
2002 2003 2004 2005 2006 2007 2008 2009 2010 2011 2012 2013 2014 2015 2016
Year of notification Average latency of reported claims
25th percentile latency of reported claims 75th percentile latency of reported claims Number of claims reported
KPMG | 47
© 2017 KPMG, an Australian partnership and a member firm of the KPMG network of
independent member firms affiliated with KPMG International Cooperative (“KPMG
International”), a Swiss entity. All rights reserved. The KPMG name and
logo are registered trademarks or trademarks of KPMG International. Liability limited by a scheme approved under Professional Standards Legislation.
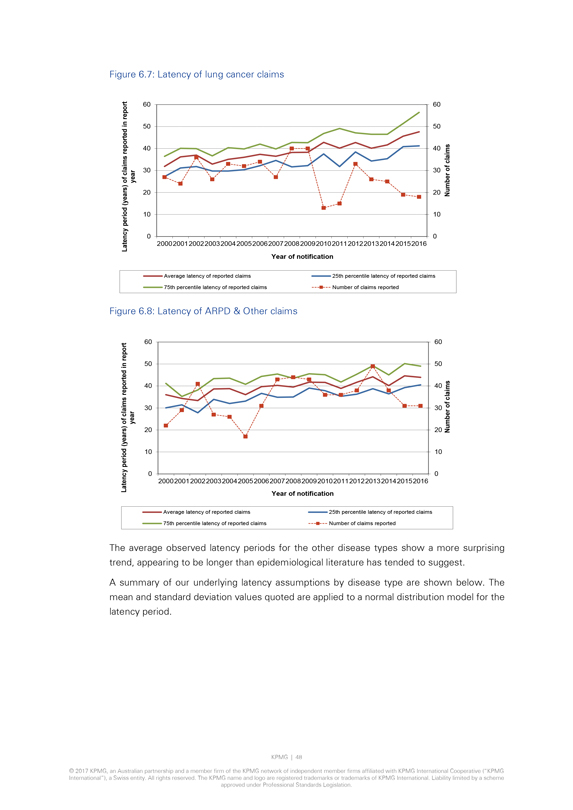
Figure 6.7: Latency of lung cancer claims
Latency
period (years) of claims reported in report year
60 60
50 50
40 40
30 30
20 20
10 10
0 0
Number of claims
2000 2001 2002 2003 2004 2005 2006 2007 2008 2009 2010 2011 2012 2013 2014 2015 2016
Year of
notification
Average latency of reported claims
25th percentile latency of
reported claims
75th percentile latency of reported claims
Number of claims
reported
Figure 6.8: Latency of ARPD & Other claims
Latency period
(years) of claims reported in report year
60 60
50 50
40 40
30 30
20 20
10 10
0 0
2000 2001 2002 2003 2004 2005 2006 2007 2008 2009 2010 2011 2012 2013 2014 2015 2016
Number of claims
Year of notification
Average latency of reported claims
25th percentile latency of reported claims
75th percentile latency of reported claims
Number of claims reported
The average observed latency periods for the other disease types show a more surprising trend, appearing to be longer than epidemiological literature has tended to suggest.
A summary of our underlying latency assumptions by disease type are shown below. The mean and standard deviation values quoted are applied to a normal distribution
model for the latency period.
KPMG | 48
© 2017 KPMG, an Australian
partnership and a member firm of the KPMG network of independent member firms affiliated with KPMG International Cooperative (“KPMG International”), a Swiss entity. All rights reserved. The KPMG name and logo are registered trademarks or
trademarks of KPMG International. Liability limited by a scheme approved under Professional Standards Legislation.
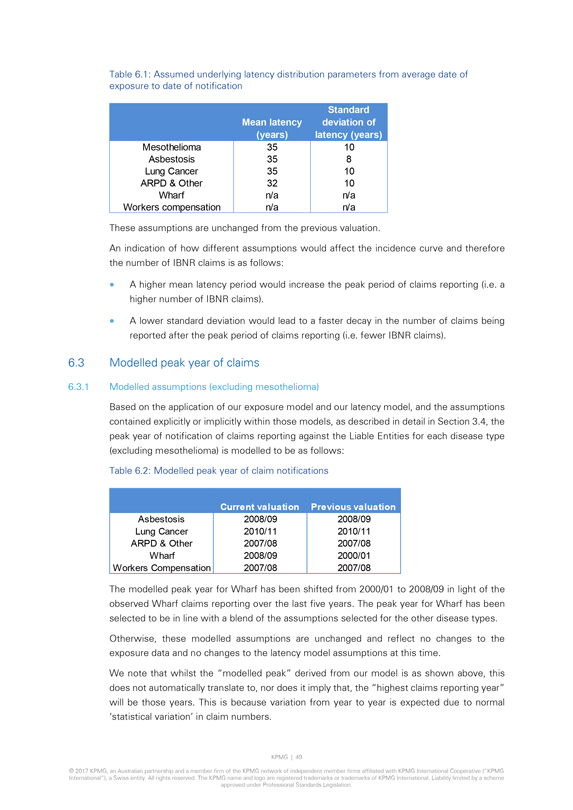
Table 6.1: Assumed underlying latency distribution parameters from average date of exposure to date of notification
Standard deviation of latency (years)
Mean latency
(years)
Mesothelioma 35 10
Asbestosis 35 8
Lung Cancer 35 10
ARPD & Other 32 10
Wharf n/a n/a
Workers compensation n/a n/a
These assumptions are unchanged from the previous valuation.
An indication of how different assumptions would affect the incidence curve and therefore the number of IBNR claims is as follows:
A higher mean latency period would increase the peak period of claims reporting (i.e. a higher number of IBNR claims).
A lower standard deviation would lead to a faster decay in the number of claims being reported after the peak period of claims reporting (i.e. fewer IBNR claims).
6.3 Modelled peak year of claims
6.3.1 Modelled assumptions (excluding mesothelioma)
Based on the application of our exposure model and our latency model, and the assumptions contained explicitly or implicitly within those models, as described in
detail in Section 3.4, the peak year of notification of claims reporting against the Liable Entities for each disease type (excluding mesothelioma) is modelled to be as follows: Table 6.2: Modelled peak year of claim notifications
Current valuation
Previous valuation
Asbestosis 2008/09 2008/09
Lung Cancer 2010/11 2010/11
ARPD & Other 2007/08 2007/08
Wharf 2008/09 2000/01
Workers Compensation 2007/08 2007/08
The modelled peak year for Wharf has been shifted from
2000/01 to 2008/09 in light of the observed Wharf claims reporting over the last five years. The peak year for Wharf has been selected to be in line with a blend of the assumptions selected for the other disease types. Otherwise, these modelled
assumptions are unchanged and reflect no changes to the exposure data and no changes to the latency model assumptions at this time.
We note that whilst the
“modelled peak” derived from our model is as shown above, this does not automatically translate to, nor does it imply that, the “highest claims reporting year” will be those years. This is because variation from year to year is
expected due to normal ‘statistical variation’ in claim numbers.
KPMG | 49
© 2017 KPMG, an Australian partnership and a member firm of the KPMG network of independent member firms affiliated with KPMG International Cooperative (“KPMG
International”), a Swiss entity. All rights reserved. The KPMG name and logo are registered trademarks or trademarks of KPMG International. Liability limited by a scheme
approved under Professional Standards Legislation.
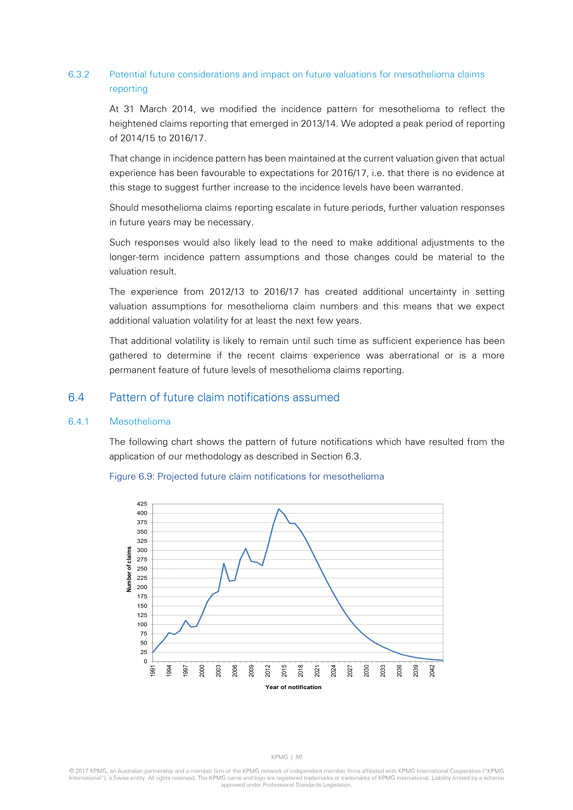
6.3.2 Potential future considerations and impact on future valuations for mesothelioma claims reporting At 31 March 2014, we
modified the incidence pattern for mesothelioma to reflect the heightened claims reporting that emerged in 2013/14. We adopted a peak period of reporting of 2014/15 to 2016/17.
That change in incidence pattern has been maintained at the current valuation given that actual experience has been favourable to expectations for 2016/17, i.e. that there is no
evidence at this stage to suggest further increase to the incidence levels have been warranted.
Should mesothelioma claims reporting escalate in future periods,
further valuation responses in future years may be necessary.
Such responses would also likely lead to the need to make additional adjustments to the longer-term
incidence pattern assumptions and those changes could be material to the valuation result.
The experience from 2012/13 to 2016/17 has created additional
uncertainty in setting valuation assumptions for mesothelioma claim numbers and this means that we expect additional valuation volatility for at least the next few years.
That additional volatility is likely to remain until such time as sufficient experience has been gathered to determine if the recent claims experience was aberrational or is a more
permanent feature of future levels of mesothelioma claims reporting.
6.4 Pattern of future claim notifications assumed
6.4.1 Mesothelioma
The following chart shows the pattern of future notifications which have
resulted from the application of our methodology as described in Section 6.3.
Figure 6.9: Projected future claim notifications for mesothelioma
Number of claims
425
400
375
350
325
300
275
250
225
200
175
150
125
100
75
50
25
0
1991 1994 1997 2000 2003 2006 2009 2012 2015 2018 2021 2024 2027 2030 2033 2036 2039 2042
Year of notification
KPMG | 50
© 2017 KPMG, an Australian partnership and a member firm of the KPMG network of independent member firms affiliated with KPMG International Cooperative (“KPMG
International”), a Swiss entity. All rights reserved. The KPMG name and logo are registered trademarks or trademarks of KPMG International. Liability limited by a scheme
approved under Professional Standards Legislation.
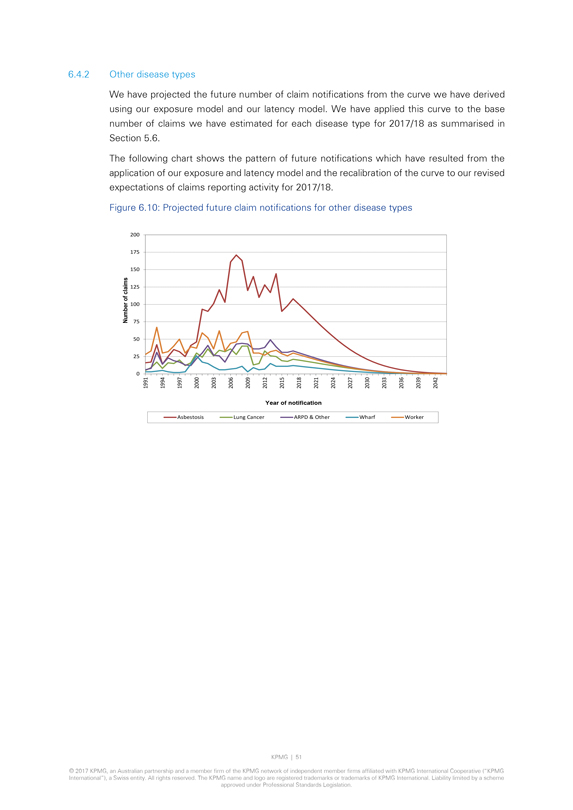
6.4.2 Other disease types
We have projected the
future number of claim notifications from the curve we have derived using our exposure model and our latency model. We have applied this curve to the base number of claims we have estimated for each disease type for 2017/18 as summarised in
Section 5.6.
The following chart shows the pattern of future notifications which have resulted from the application of our exposure and latency model and the
recalibration of the curve to our revised expectations of claims reporting activity for 2017/18.
Figure 6.10: Projected future claim notifications for other
disease types
Number of claims
200
175
150
125
100
75
50
25
0
1991 1994 1997 2000 2003 2006 2009 2012 2015 2018 2021 2024 2027 2030 2033
2036 2039 2042
Year of notification
Asbestosis
Lung Cancer
ARPD & Other
Wharf
Worker
KPMG | 51
© 2017 KPMG, an Australian partnership and a member firm of the KPMG network of
independent member firms affiliated with KPMG International Cooperative (“KPMG
International”), a Swiss entity. All rights reserved. The KPMG name and
logo are registered trademarks or trademarks of KPMG International. Liability limited by a scheme approved under Professional Standards Legislation.
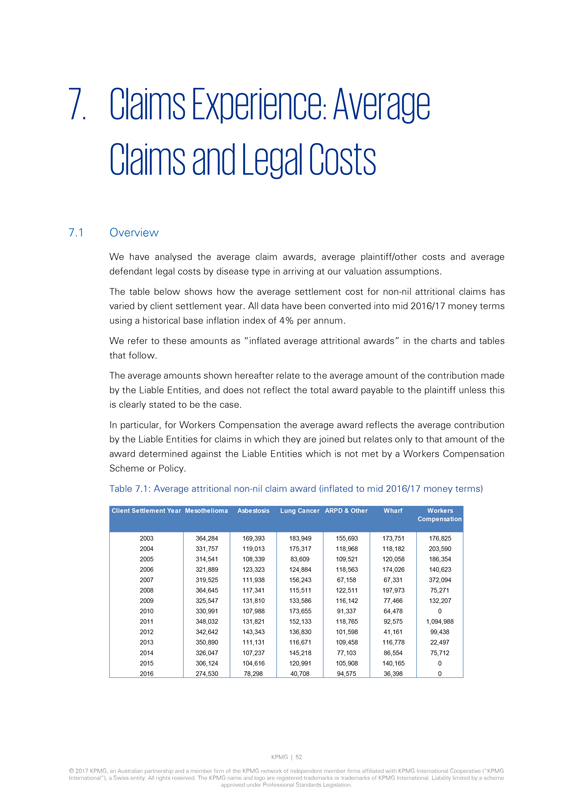
7. Claims Experience: Average Claims and Legal Costs
7.1 Overview
We have analysed the average claim awards, average
plaintiff/other costs and average defendant legal costs by disease type in arriving at our valuation assumptions.
The table below shows how the average settlement
cost for non-nil attritional claims has varied by client settlement year. All data have been converted into mid 2016/17 money terms using a historical base inflation index of 4% per annum.
We refer to these amounts as “inflated average attritional awards” in the charts and tables that follow.
The average amounts shown hereafter relate to the average amount of the contribution made by the Liable Entities, and does not reflect the total award payable to the plaintiff
unless this is clearly stated to be the case.
In particular, for Workers Compensation the average award reflects the average contribution by the Liable Entities
for claims in which they are joined but relates only to that amount of the award determined against the Liable Entities which is not met by a Workers Compensation Scheme or Policy.
Table 7.1: Average attritional non-nil claim award (inflated to mid 2016/17 money terms)
Client Settlement Year Mesothelioma
Asbestosis
Lung Cancer ARPD & Other
Wharf
Workers
Compensation
2003 364,284 169,393 183,949 155,693 173,751 176,825
2004 331,757 119,013 175,317 118,968
118,182 203,590
2005 314,541 108,339 83,609 109,521 120,058 186,354
2006
321,889 123,323 124,884 118,563 174,026 140,623
2007 319,525 111,938 156,243 67,158 67,331 372,094
2008 364,645 117,341 115,511 122,511 197,973 75,271
2009 325,547 131,810 133,586 116,142
77,466 132,207
2010 330,991 107,988 173,655 91,337 64,478 0
2011 348,032
131,821 152,133 118,765 92,575 1,094,988
2012 342,642 143,343 136,830 101,598 41,161 99,438
2013 350,890 111,131 116,671 109,458 116,778 22,497
2014 326,047 107,237 145,218 77,103 86,554
75,712
2015 306,124 104,616 120,991 105,908 140,165 0
2016 274,530 78,298
40,708 94,575 36,398 0
KPMG | 52
© 2017 KPMG, an Australian partnership
and a member firm of the KPMG network of independent member firms affiliated with KPMG International Cooperative (“KPMG
International”), a Swiss entity.
All rights reserved. The KPMG name and logo are registered trademarks or trademarks of KPMG International. Liability limited by a scheme approved under Professional Standards Legislation.
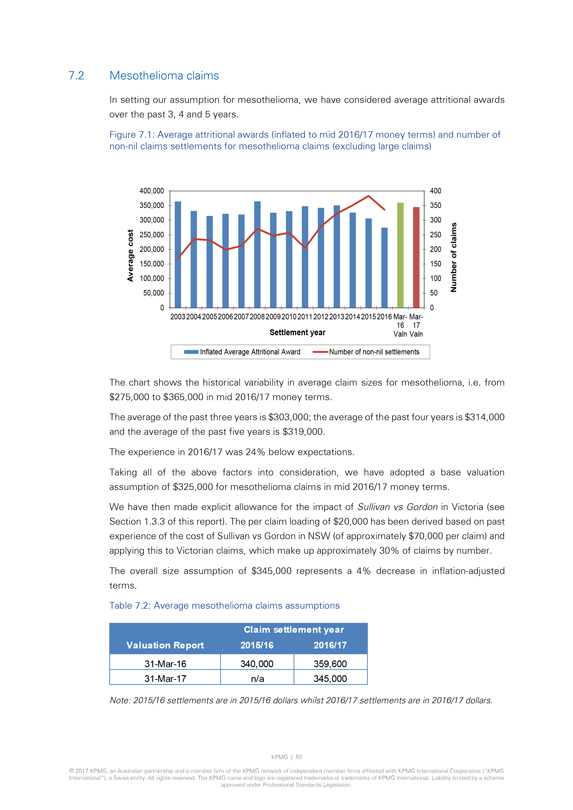
7.2 Mesothelioma claims
In setting our assumption
for mesothelioma, we have considered average attritional awards over the past 3, 4 and 5 years.
Figure 7.1: Average attritional awards (inflated to mid 2016/17
money terms) and number of non-nil claims settlements for mesothelioma claims (excluding large claims)
Average cost
400,000 400
350,000 350
300,000 300
250,000 250
200,000 200
150,000 150
100,000 100
50,000 50
0 0
Number of claims
2003 2004 2005 2006 2007 2008 2009 2010 2011 2012 2013 2014 2015 2016 Mar- Mar-
16 17
Settlement year Valn Valn
Inflated Average Attritional Award
Number of non-nil
settlements
The chart shows the historical variability in average claim sizes for mesothelioma, i.e. from $275,000 to $365,000 in mid 2016/17 money terms.
The average of the past three years is $303,000; the average of the past four years is $314,000 and the average of the past five years is $319,000.
The experience in 2016/17 was 24% below expectations.
Taking all of the above factors into
consideration, we have adopted a base valuation assumption of $325,000 for mesothelioma claims in mid 2016/17 money terms.
We have then made explicit allowance for
the impact of Sullivan vs Gordon in Victoria (see Section 1.3.3 of this report). The per claim loading of $20,000 has been derived based on past experience of the cost of Sullivan vs Gordon in NSW (of approximately $70,000 per claim) and
applying this to Victorian claims, which make up approximately 30% of claims by number. The overall size assumption of $345,000 represents a 4% decrease in inflation-adjusted terms.
Table 7.2: Average mesothelioma claims assumptions
Claim settlement year
Valuation Report
2015/16 2016/17
31-Mar-16 340,000 359,600
31-Mar-17 n/a 345,000
Note: 2015/16 settlements are in 2015/16 dollars whilst 2016/17 settlements are in 2016/17 dollars.
KPMG | 53
© 2017 KPMG, an Australian partnership and a member firm of the KPMG network of
independent member firms affiliated with KPMG International Cooperative (“KPMG
International”), a Swiss entity. All rights reserved. The KPMG name and
logo are registered trademarks or trademarks of KPMG International. Liability limited by a scheme approved under Professional Standards Legislation.
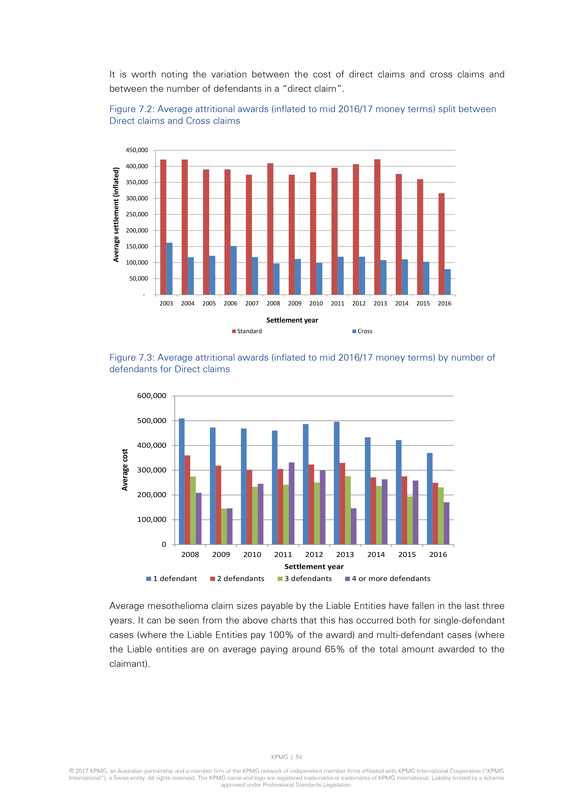
It is worth noting the variation between the cost of direct claims and cross claims and between the number of defendants in a
“direct claim”.
Figure 7.2: Average attritional awards (inflated to mid 2016/17 money terms) split between Direct claims and Cross claims
Average settlement (inflated)
450,000
400,000
350,000
300,000
250,000
200,000
150,000
100,000
50,000
-
2003 2004 2005 2006 2007 2008 2009 2010 2011 2012 2013 2014 2015 2016
Settlement year
Standard Cross
Figure 7.3: Average attritional awards (inflated to mid 2016/17 money terms) by number of defendants for Direct claims
Average cost
600,000
500,000
400,000
300,000
200,000
100,000
0
2008 2009 2010 2011 2012 2013 2014 2015 2016
Settlement year
1 defendant 2 defendants 3 defendants 4 or more defendants
Average mesothelioma claim sizes
payable by the Liable Entities have fallen in the last three years. It can be seen from the above charts that this has occurred both for single-defendant cases (where the Liable Entities pay 100% of the award) and multi-defendant cases (where the
Liable entities are on average paying around 65% of the total amount awarded to the claimant).
KPMG | 54
© 2017 KPMG, an Australian partnership and a member firm of the KPMG network of independent member firms affiliated with KPMG International Cooperative (“KPMG
International”), a Swiss entity. All rights reserved. The KPMG name and logo are registered trademarks or trademarks of KPMG International. Liability limited by a scheme approved under Professional Standards Legislation.
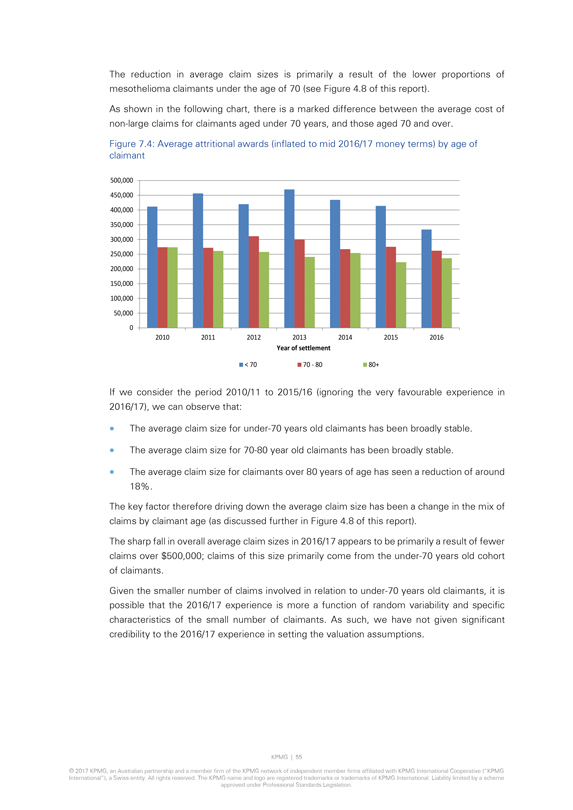
The reduction in average claim sizes is primarily a result of the lower proportions of mesothelioma claimants under the age of 70 (see
Figure 4.8 of this report).
As shown in the following chart, there is a marked difference between the average cost of
non-large claims for claimants aged under 70 years, and those aged 70 and over.
Figure 7.4: Average attritional awards
(inflated to mid 2016/17 money terms) by age of claimant
500,000
450,000
400,000
350,000
300,000
250,000
200,000
150,000
100,000
50,000
0
2010 2011 2012 2013 2014 2015 2016
Year of settlement
< 70
70 - 80
80+
If we consider the period 2010/11 to 2015/16 (ignoring the very favourable experience in 2016/17), we can observe that:
The average claim size for under-70 years old claimants has been broadly stable.
The average claim size for 70-80 year old claimants has been broadly stable.
The average claim size for claimants over 80 years of age has seen a reduction of around 18%.
The key factor therefore driving down the average claim size has been a change in the mix of claims by claimant age (as discussed further in Figure 4.8 of this
report).
The sharp fall in overall average claim sizes in 2016/17 appears to be primarily a result of fewer claims over $500,000; claims of this size primarily
come from the under-70 years old cohort of claimants.
Given the smaller number of claims involved in relation to under-70 years old claimants, it is possible that the 2016/17 experience is more a function of random variability and specific characteristics of the small number of claimants. As such, we have not given significant
credibility to the 2016/17 experience in setting the valuation assumptions.
KPMG | 55
© 2017 KPMG, an Australian partnership and a member firm of the KPMG network of independent member firms affiliated with KPMG International Cooperative (“KPMG
International”), a Swiss entity. All rights reserved. The KPMG name and logo are registered trademarks or trademarks of KPMG International. Liability limited by a scheme
approved under Professional Standards Legislation.
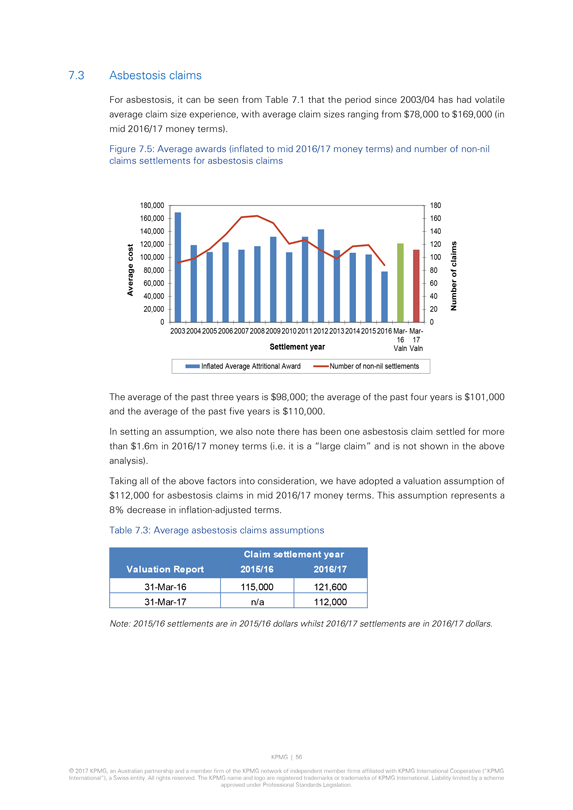
7.3 Asbestosis claims
For asbestosis, it can be
seen from Table 7.1 that the period since 2003/04 has had volatile average claim size experience, with average claim sizes ranging from $78,000 to $169,000 (in mid 2016/17 money terms).
Figure 7.5: Average awards (inflated to mid 2016/17 money terms) and number of non-nil claims settlements for asbestosis claims
Average cost
180,000 180
160,000 160
140,000 140
120,000 120
100,000 100
80,000 80
60,000 60
40,000 40
20,000 20
0 0
Number of claims
2003 2004 2005 2006 2007 2008 2009 2010 2011 2012 2013 2014 2015 2016 Mar- Mar-
16 17
Settlement year Valn Valn
Inflated Average Attritional Award
Number of non-nil
settlements
The average of the past three years is $98,000; the average of the past four years is $101,000 and the average of the past five years is $110,000.
In setting an assumption, we also note there has been one asbestosis claim settled for more than $1.6m in 2016/17 money terms (i.e. it is a “large claim”
and is not shown in the above analysis).
Taking all of the above factors into consideration, we have adopted a valuation assumption of $112,000 for asbestosis
claims in mid 2016/17 money terms. This assumption represents a 8% decrease in inflation-adjusted terms.
Table 7.3: Average asbestosis claims assumptions
Claim settlement year
Valuation Report 2015/16 2016/17
31-Mar-16 115,000 121,600
31-Mar-17 n/a 112,000
Note: 2015/16 settlements are in 2015/16 dollars whilst 2016/17 settlements are in 2016/17 dollars.
KPMG | 56
© 2017 KPMG, an Australian partnership and a member firm of the KPMG network of
independent member firms affiliated with KPMG International Cooperative (“KPMG
International”), a Swiss entity. All rights reserved. The KPMG name and
logo are registered trademarks or trademarks of KPMG International. Liability limited by a scheme approved under Professional Standards Legislation.
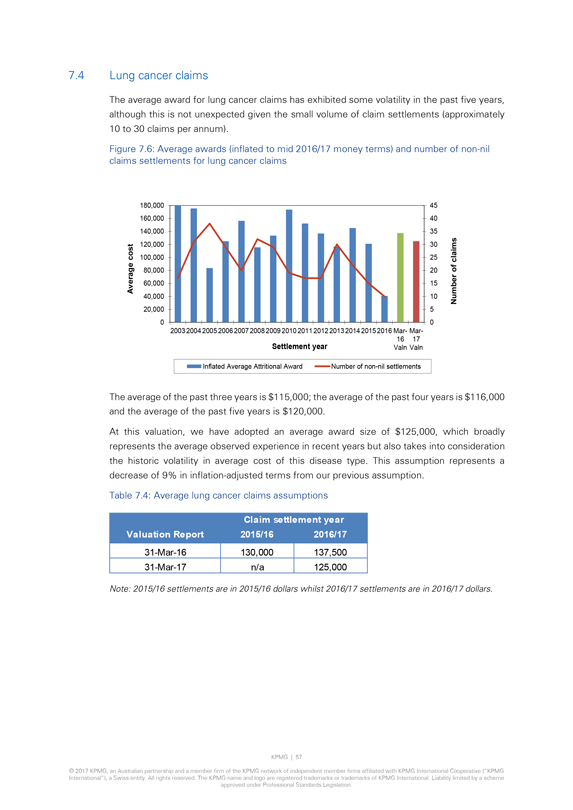
7.4 Lung cancer claims
The average award for lung
cancer claims has exhibited some volatility in the past five years, although this is not unexpected given the small volume of claim settlements (approximately 10 to 30 claims per annum).
Figure 7.6: Average awards (inflated to mid 2016/17 money terms) and number of non-nil claims settlements for lung cancer claims
Average cost
180,000 45
160,000 40
140,000 35
120,000 30
100,000 25
80,000 20
60,000 15
40,000 10
20,000 5
0 0
Number of claims
2003 2004 2005 2006 2007 2008 2009 2010 2011 2012 2013 2014 2015 2016 Mar- Mar-
16 17
Settlement year Valn Valn
Inflated Average Attritional Award
Number of non-nil
settlements
The average of the past three years is $115,000; the average of the past four years is $116,000 and the average of the past five years is $120,000.
At this valuation, we have adopted an average award size of $125,000, which broadly represents the average observed experience in recent years but also takes into
consideration the historic volatility in average cost of this disease type. This assumption represents a decrease of 9% in inflation-adjusted terms from our previous assumption.
Table 7.4: Average lung cancer claims assumptions
Claim settlement year
Valuation Report
2015/16 2016/17
31-Mar-16 130,000 137,500
31-Mar-17 n/a 125,000
Note: 2015/16 settlements are in 2015/16 dollars whilst 2016/17 settlements are in 2016/17 dollars.
KPMG | 57
© 2017 KPMG, an Australian partnership and a member firm of the KPMG network of
independent member firms affiliated with KPMG International Cooperative (“KPMG
International”), a Swiss entity. All rights reserved. The KPMG name and
logo are registered trademarks or trademarks of KPMG International. Liability limited by a scheme approved under Professional Standards Legislation.
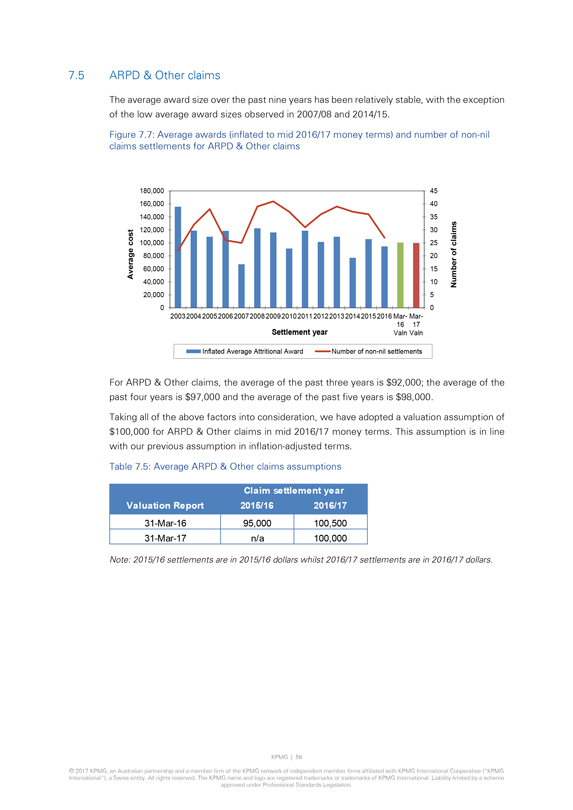
7.5 ARPD & Other claims
The average award
size over the past nine years has been relatively stable, with the exception of the low average award sizes observed in 2007/08 and 2014/15.
Figure 7.7: Average
awards (inflated to mid 2016/17 money terms) and number of non-nil claims settlements for ARPD & Other claims
Average cost
180,000 45
160,000 40
140,000 35
120,000 30
100,000 25
80,000 20
60,000 15
40,000 10
20,000 5
0 0
Number of claims
2003 2004 2005 2006 2007 2008 2009 2010 2011 2012 2013 2014 2015 2016 Mar- Mar-
16 17
Settlement year Valn Valn
Inflated Average Attritional Award
Number of non-nil
settlements
For ARPD & Other claims, the average of the past three years is $92,000; the average of the past four years is $97,000 and the average of the
past five years is $98,000.
Taking all of the above factors into consideration, we have adopted a valuation assumption of $100,000 for ARPD & Other claims
in mid 2016/17 money terms. This assumption is in line with our previous assumption in inflation-adjusted terms.
Table 7.5: Average ARPD & Other claims
assumptions
Claim settlement year
Valuation Report 2015/16 2016/17
31-Mar-16 95,000 100,500
31-Mar-17 n/a 100,000
Note: 2015/16 settlements are in 2015/16 dollars whilst 2016/17 settlements are in 2016/17 dollars.
KPMG | 58
© 2017 KPMG, an Australian partnership and a member firm of the KPMG network of
independent member firms affiliated with KPMG International Cooperative (“KPMG
International”), a Swiss entity. All rights reserved. The KPMG name and
logo are registered trademarks or trademarks of KPMG International. Liability limited by a scheme approved under Professional Standards Legislation.
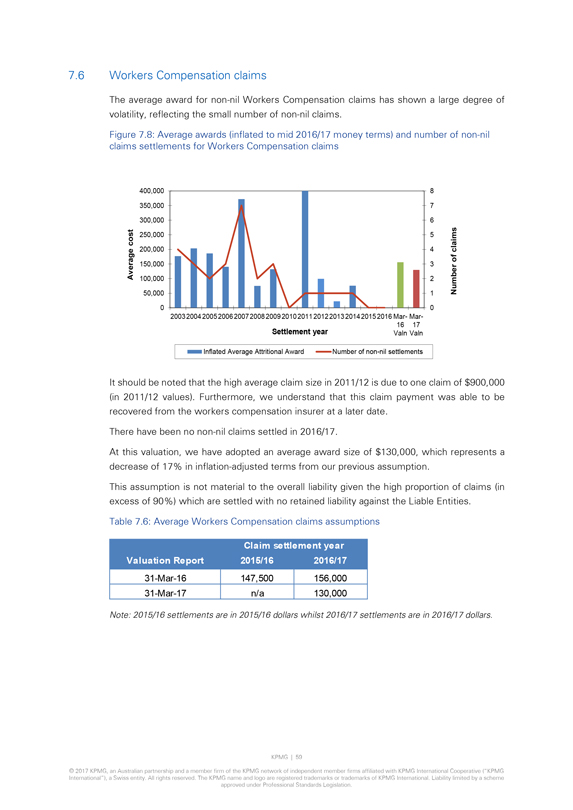
7.6 Workers Compensation claims
The average award
for non-nil Workers Compensation claims has shown a large degree of volatility, reflecting the small number of non-nil claims.
Figure 7.8: Average awards (inflated to mid 2016/17 money terms) and number of non-nil claims settlements for Workers Compensation claims
Average cost
400,000 8
350,000 7
300,000 6
250,000 5
200,000 4
150,000 3
100,000 2
50,000 1
0 0
Number of claims
2003 2004 2005 2006 2007 2008 2009 2010 2011 2012 2013 2014 2015 2016 Mar- Mar-
16 17
Settlement year Valn Valn
Inflated Average Attritional Award
Number of
non-nil settlements
It should be noted that the high average claim size in 2011/12 is due to one claim of $900,000 (in
2011/12 values). Furthermore, we understand that this claim payment was able to be recovered from the workers compensation insurer at a later date.
There have been
no non-nil claims settled in 2016/17.
At this valuation, we have adopted an average award size of $130,000, which
represents a decrease of 17% in inflation-adjusted terms from our previous assumption.
This assumption is not material to the overall liability given the high
proportion of claims (in excess of 90%) which are settled with no retained liability against the Liable Entities. Table 7.6: Average Workers Compensation claims assumptions
Claim settlement year
Valuation Report 2015/16 2016/17
31-Mar-16 147,500 156,000
31-Mar-17 n/a 130,000
Note: 2015/16 settlements are in 2015/16 dollars whilst 2016/17
settlements are in 2016/17 dollars.
KPMG | 59
© 2017 KPMG, an Australian
partnership and a member firm of the KPMG network of independent member firms affiliated with KPMG International Cooperative (“KPMG
International”), a
Swiss entity. All rights reserved. The KPMG name and logo are registered trademarks or trademarks of KPMG International. Liability limited by a scheme approved under Professional Standards Legislation.
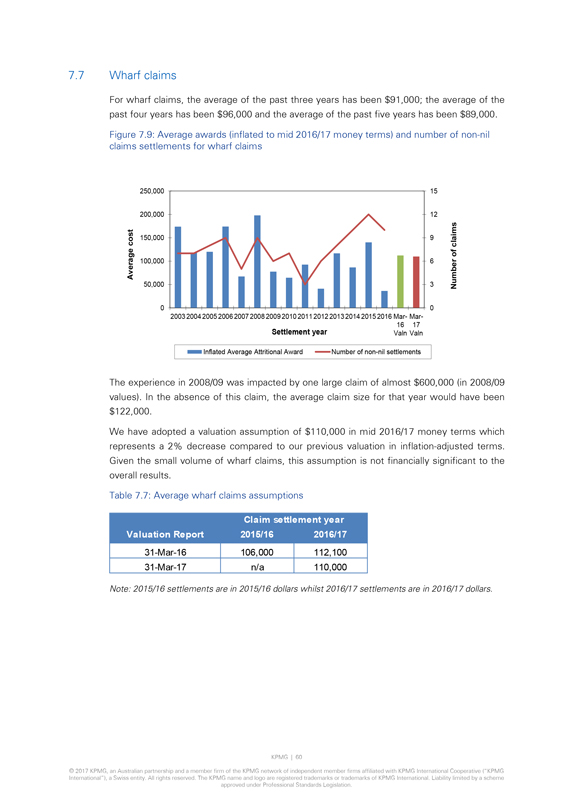
7.7 Wharf claims
For wharf claims, the average of
the past three years has been $91,000; the average of the past four years has been $96,000 and the average of the past five years has been $89,000. Figure 7.9: Average awards (inflated to mid 2016/17 money terms) and number of non-nil claims settlements for wharf claims
250,000
15
200,000
12
Average cost
150,000
9
Number of claims
100,000
6
50,000
3
0
0
2003 2004 2005 2006 2007 2008 2009 2010 2011 2012 2013 2014 2015 2016 Mar- Mar-
16 17
Settlement year
Valn Valn
Inflated Average Attritional Award
Number of non-nil settlements
The experience in
2008/09 was impacted by one large claim of almost $600,000 (in 2008/09 values). In the absence of this claim, the average claim size for that year would have been $122,000.
We have adopted a valuation assumption of $110,000 in mid 2016/17 money terms which represents a 2% decrease compared to our previous valuation in
inflation-adjusted terms. Given the small volume of wharf claims, this assumption is not financially significant to the overall results.
Table 7.7: Average wharf claims assumptions
Claim settlement year
Valuation Report
2015/16
2016/17
31-Mar-16 106,000 112,100
31-Mar-17 n/a 110,000
Note: 2015/16 settlements are in 2015/16 dollars whilst 2016/17 settlements are in 2016/17 dollars.
KPMG | 60
© 2017 KPMG, an Australian partnership and a member firm of the KPMG network of
independent member firms affiliated with KPMG International Cooperative (“KPMG International”), a Swiss entity. All rights reserved. The KPMG name and logo are registered trademarks or trademarks of KPMG International. Liability limited by
a scheme approved under Professional Standards Legislation.
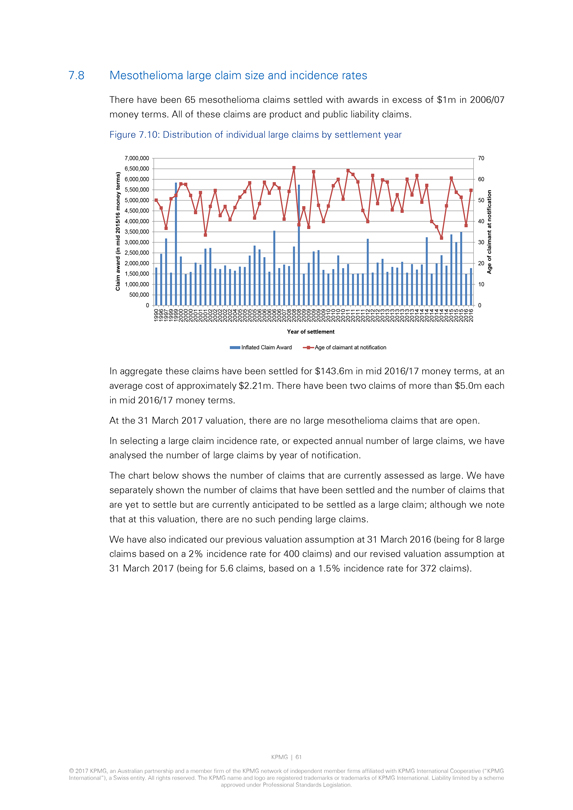
7.8 Mesothelioma large claim size and incidence rates
There have been 65 mesothelioma claims settled with awards in excess of $1m in 2006/07 money terms. All of these claims are product and public liability claims.
Figure 7.10: Distribution of individual large claims by settlement year
Claim award (in mid
2015/16 money terms)
0 500,000 1,000,000 1,500,000 2,000,000 2,500,000 3,000,000 3,500,000 4,000,000 4,500,000 5,000,000 5,500,000 6,000,000 6,500,000 7,000,000
1990 1996 1997 1999 1999 2000 2000 2000 2001 2001 2001 2002 2002 2002 2002 2002 2004 2005 2005 2005
2005 2006 2006 2006 2006 2006 2007 2008 2008 2008 2009 2009 2009 2009 2009 2010 2010 2010 2010 2011 2011 2011 2011 2012
2012 2012 2013 2013 2013 2013 2013 2013 2013 2014 2014 2014 2014 2014 2014 2014 2015 2015 2015 2016 2016 0
10 20 30 40 50 60 70
Age of claimant at notification
Year of settlement
Inflated Claim Award
Age of claimant at notification
In aggregate these claims have been settled for $143.6m in mid
2016/17 money terms, at an average cost of approximately $2.21m. There have been two claims of more than $5.0m each in mid 2016/17 money terms.
At the
31 March 2017 valuation, there are no large mesothelioma claims that are open. In selecting a large claim incidence rate, or expected annual number of large claims, we have analysed the number of large claims by year of notification.
The chart below shows the number of claims that are currently assessed as large. We have separately shown the number of claims that have been settled and the
number of claims that are yet to settle but are currently anticipated to be settled as a large claim; although we note that at this valuation, there are no such pending large claims.
We have also indicated our previous valuation assumption at 31 March 2016 (being for 8 large claims based on a 2% incidence rate for 400 claims) and our revised valuation
assumption at
31 March 2017 (being for 5.6 claims, based on a 1.5% incidence rate for 372 claims).
KPMG | 61
© 2017 KPMG, an Australian partnership and a member firm of the KPMG network of
independent member firms affiliated with KPMG International Cooperative (“KPMG International”), a Swiss entity. All rights reserved. The KPMG name and logo are registered trademarks or trademarks of KPMG International. Liability limited by
a scheme approved under Professional Standards Legislation.
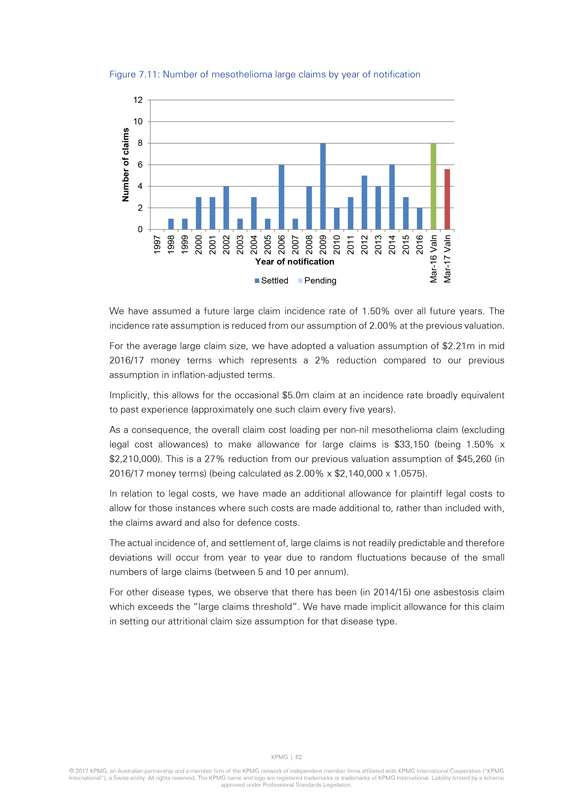
Figure 7.11: Number of mesothelioma large claims by year of notification
Number of claims
0 2 4 6 8 10 12
1997 1998 1999 2000 2001 2002 2003 2004 2005 2006 2007 2008
Year of notification
Settled Pending
2009 2010 2011 2012 2013 2014 2015 2016
Mar-16 Valn
Mar-17 Valn
We have assumed a future
large claim incidence rate of 1.50% over all future years. The incidence rate assumption is reduced from our assumption of 2.00% at the previous valuation. For the average large claim size, we have adopted a valuation assumption of $2.21m in mid
2016/17 money terms which represents a 2% reduction compared to our previous assumption in inflation-adjusted terms.
Implicitly, this allows for the occasional
$5.0m claim at an incidence rate broadly equivalent to past experience (approximately one such claim every five years).
As a consequence, the overall claim cost
loading per non-nil mesothelioma claim (excluding legal cost allowances) to make allowance for large claims is $33,150 (being 1.50% x $2,210,000). This is a 27% reduction from our previous valuation assumption
of $45,260 (in 2016/17 money terms) (being calculated as 2.00% x $2,140,000 x 1.0575).
In relation to legal costs, we have made an additional allowance for
plaintiff legal costs to allow for those instances where such costs are made additional to, rather than included with, the claims award and also for defence costs.
The actual incidence of, and settlement of, large claims is not readily predictable and therefore deviations will occur from year to year due to random
fluctuations because of the small numbers of large claims (between 5 and 10 per annum).
For other disease types, we observe that there has been (in 2014/15) one
asbestosis claim which exceeds the “large claims threshold”. We have made implicit allowance for this claim in setting our attritional claim size assumption for that disease type.
KPMG | 62
© 2017 KPMG, an Australian partnership and a member firm of the KPMG network of
independent member firms affiliated with KPMG International Cooperative (“KPMG
International”), a Swiss entity. All rights reserved. The KPMG name and
logo are registered trademarks or trademarks of KPMG International. Liability limited by a scheme approved under Professional Standards Legislation.
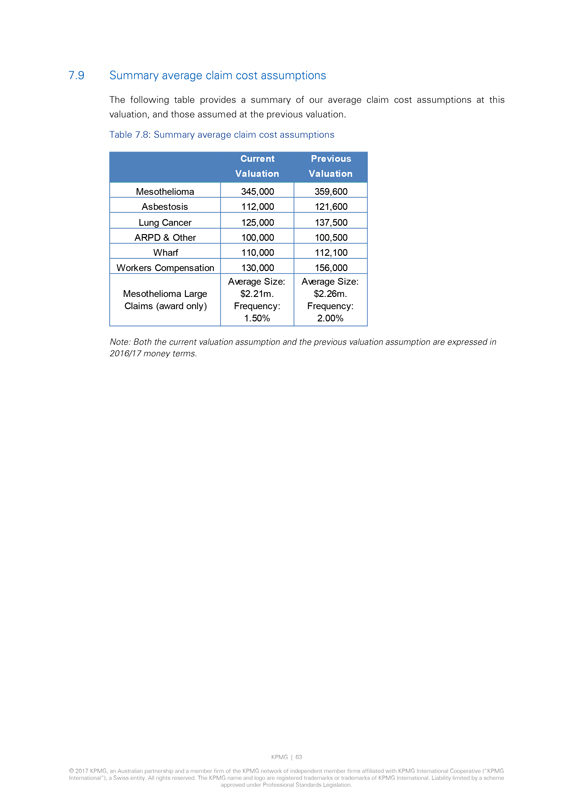
7.9 Summary average claim cost assumptions
The
following table provides a summary of our average claim cost assumptions at this valuation, and those assumed at the previous valuation.
Table 7.8: Summary average
claim cost assumptions
Current Valuation
Previous Valuation
Mesothelioma 345,000 359,600
Asbestosis 112,000 121,600
Lung Cancer 125,000 137,500
ARPD & Other 100,000 100,500
Wharf 110,000 112,100
Workers Compensation 130,000 156,000
Mesothelioma Large Claims (award only)
Average Size: $2.21m.
Average Size: $2.26m.
Frequency: 1.50%
Frequency: 2.00%
Note: Both the current valuation assumption and the previous valuation
assumption are expressed in 2016/17 money terms.
KPMG | 63
© 2017 KPMG,
an Australian partnership and a member firm of the KPMG network of independent member firms affiliated with KPMG International Cooperative (“KPMG
International”), a Swiss entity. All rights reserved. The KPMG name and logo are registered trademarks or trademarks of KPMG International. Liability limited
by a scheme approved under Professional Standards Legislation.
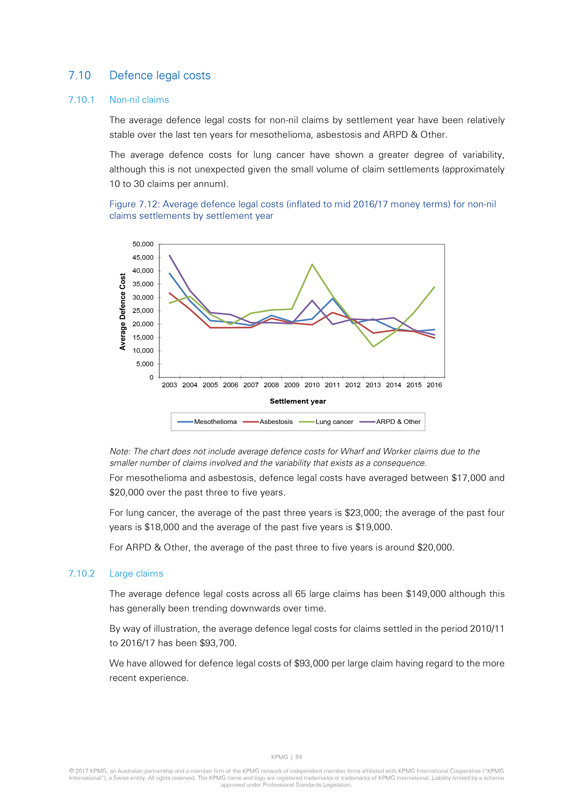
7.10 Defence legal costs
7.10.1 Non-nil claims
The average defence legal costs for non-nil claims by settlement year have
been relatively stable over the last ten years for mesothelioma, asbestosis and ARPD & Other.
The average defence costs for lung cancer have shown a greater
degree of variability, although this is not unexpected given the small volume of claim settlements (approximately 10 to 30 claims per annum).
Figure 7.12: Average
defence legal costs (inflated to mid 2016/17 money terms) for non-nil claims settlements by settlement year
50,000 45,000
40,000 35,000 30,000 25,000 20,000 15,000 10,000 5,000 0
Average Defence Cost
2003 2004 2005 2006 2007 2008 2009 2010 2011 2012 2013 2014 2015 2016
Settlement year
Mesothelioma
Asbestosis
Lung cancer
ARPD & Other
Note: The chart does not include average defence costs for Wharf and Worker
claims due to the smaller number of claims involved and the variability that exists as a consequence.
For mesothelioma and asbestosis, defence legal costs have
averaged between $17,000 and $20,000 over the past three to five years.
For lung cancer, the average of the past three years is $23,000; the average of the past
four years is $18,000 and the average of the past five years is $19,000.
For ARPD & Other, the average of the past three to five years is around $20,000.
7.10.2 Large claims
The average defence legal costs across all 65 large
claims has been $149,000 although this has generally been trending downwards over time.
By way of illustration, the average defence legal costs for claims settled
in the period 2010/11 to 2016/17 has been $93,700.
We have allowed for defence legal costs of $93,000 per large claim having regard to the more recent experience.
KPMG | 64
© 2017 KPMG, an Australian partnership and a member firm of
the KPMG network of independent member firms affiliated with KPMG International Cooperative (“KPMG
International”), a Swiss entity. All rights reserved.
The KPMG name and logo are registered trademarks or trademarks of KPMG International. Liability limited by a scheme approved under Professional Standards Legislation.
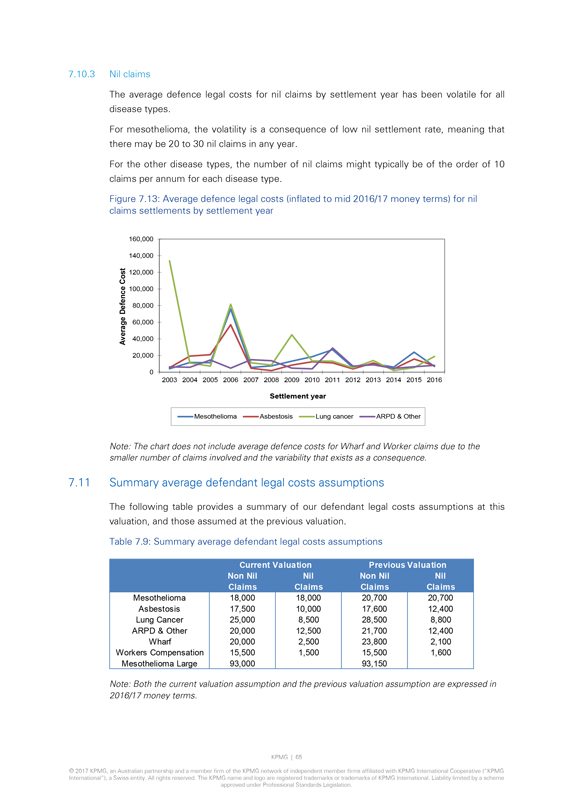
7.10.3 Nil claims
The average defence legal costs
for nil claims by settlement year has been volatile for all disease types.
For mesothelioma, the volatility is a consequence of low nil settlement rate, meaning
that there may be 20 to 30 nil claims in any year.
For the other disease types, the number of nil claims might typically be of the order of 10 claims per annum for
each disease type.
Figure 7.13: Average defence legal costs (inflated to mid 2016/17 money terms) for nil claims settlements by settlement year
Average Defence Cost
160,000 140,000 120,000 100,000 80,000 60,000 40,000 20,000 0
2003 2004 2005 2006 2007 2008 2009 2010 2011 2012 2013 2014 2015 2016
Settlement year
Mesothelioma
Asbestosis
Lung cancer
ARPD & Other
Note: The chart does not include average defence costs for Wharf and Worker claims due to the smaller number of claims involved and the variability that exists as a consequence.
7.11 Summary average defendant legal costs assumptions
The following table
provides a summary of our defendant legal costs assumptions at this valuation, and those assumed at the previous valuation.
Table 7.9: Summary average defendant
legal costs assumptions
Current Valuation
Previous Valuation
Non Nil Claims
Nil Claims
Non Nil Claims
Nil Claims
Mesothelioma 18,000 18,000 20,700 20,700
Asbestosis 17,500 10,000 17,600 12,400
Lung Cancer 25,000 8,500 28,500 8,800
ARPD & Other 20,000 12,500 21,700 12,400
Wharf 20,000 2,500 23,800 2,100
Workers Compensation 15,500 1,500 15,500 1,600
Mesothelioma Large 93,000 93,150
Note: Both the current valuation assumption and the previous
valuation assumption are expressed in 2016/17 money terms.
KPMG | 65
©
2017 KPMG, an Australian partnership and a member firm of the KPMG network of independent member firms affiliated with KPMG International Cooperative (“KPMG
International”), a Swiss entity. All rights reserved. The KPMG name and logo are registered trademarks or trademarks of KPMG International. Liability limited
by a scheme approved under Professional Standards Legislation.
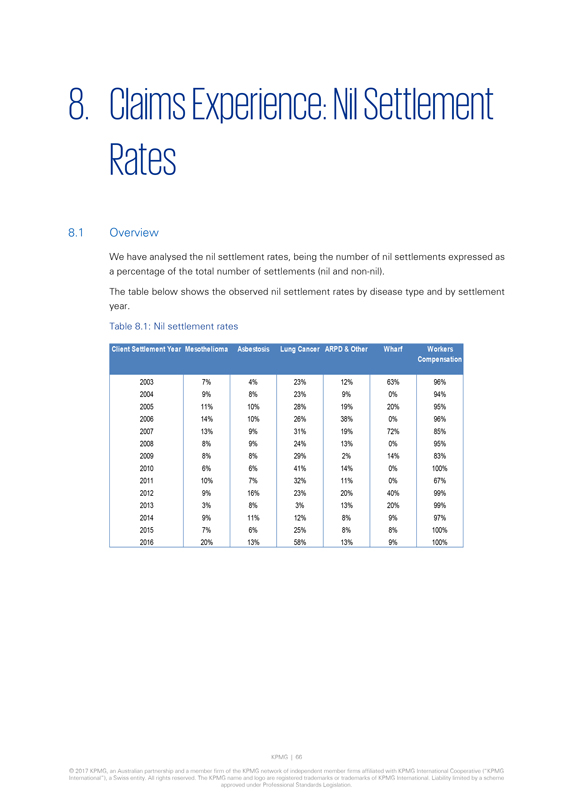
8. Claims Experience: Nil Settlement Rates
8.1
Overview
We have analysed the nil settlement rates, being the number of nil settlements expressed as a percentage of the total number of settlements (nil and non-nil).
The table below shows the observed nil settlement rates by disease type and by settlement year.
Table 8.1: Nil settlement rates
Client Settlement Year Mesothelioma Asbestosis Lung Cancer
ARPD & Other Wharf Workers Compensation
2003 7% 4% 23% 12% 63% 96%
2004
9% 8% 23% 9% 0% 94%
2005 11% 10% 28% 19% 20% 95%
2006 14% 10% 26% 38% 0% 96%
2007 13% 9% 31% 19% 72% 85%
2008 8% 9% 24% 13% 0% 95%
2009 8% 8% 29% 2% 14% 83%
2010 6% 6% 41% 14% 0% 100%
2011 10% 7% 32% 11% 0% 67%
2012 9% 16% 23% 20% 40% 99%
2013 3% 8% 3% 13% 20% 99%
2014 9% 11% 12% 8% 9% 97%
2015 7% 6% 25% 8% 8% 100%
2016 20% 13% 58% 13% 9% 100%
KPMG | 66
© 2017 KPMG, an Australian partnership and a member firm of the KPMG network of
independent member firms affiliated with KPMG International Cooperative (“KPMG
International”), a Swiss entity. All rights reserved. The KPMG name and
logo are registered trademarks or trademarks of KPMG International. Liability limited by a scheme approved under Professional Standards Legislation.
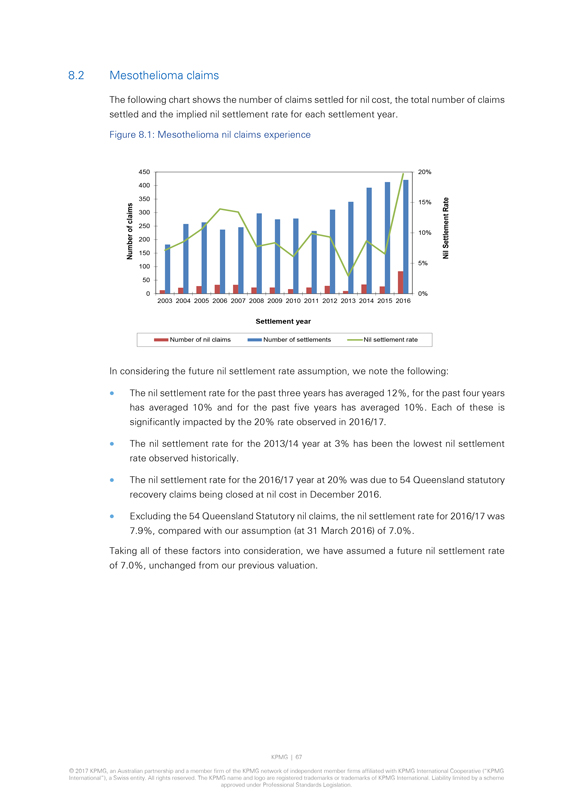
8.2 Mesothelioma claims
The following chart shows
the number of claims settled for nil cost, the total number of claims settled and the implied nil settlement rate for each settlement year. Figure 8.1: Mesothelioma nil claims experience 450 20% 400
350 15% 300 250 Number of claims 10% 200 150 Nil Settlement Rate 100 5% 50 0 0% 2003 2004 2005 2006 2007 2008 2009 2010 2011 2012 2013 2014 2015 2016 Settlement year Number of nil
claims Number of settlements Nil settlement rate
In considering the future nil settlement rate assumption, we note the following:
The nil settlement rate for the past three years has averaged 12%, for the past four years has averaged 10% and for the past five years has averaged 10%. Each of these is
significantly impacted by the 20% rate observed in 2016/17.
The nil settlement rate for the 2013/14 year at 3% has been the lowest nil settlement rate observed
historically.
The nil settlement rate for the 2016/17 year at 20% was due to 54 Queensland statutory recovery claims being closed at nil cost in December 2016.
Excluding the 54 Queensland Statutory nil claims, the nil settlement rate for 2016/17 was 7.9%, compared with our assumption (at 31 March 2016) of 7.0%.
Taking all
of these factors into consideration, we have assumed a future nil settlement rate of 7.0%, unchanged from our previous valuation. KPMG | 67
© 2017 KPMG, an
Australian partnership and a member firm of the KPMG network of independent member firms affiliated with KPMG International Cooperative (“KPMG International”), a Swiss entity. All rights reserved. The KPMG name and logo are registered
trademarks or trademarks of KPMG International. Liability limited by a scheme approved under Professional Standards Legislation.
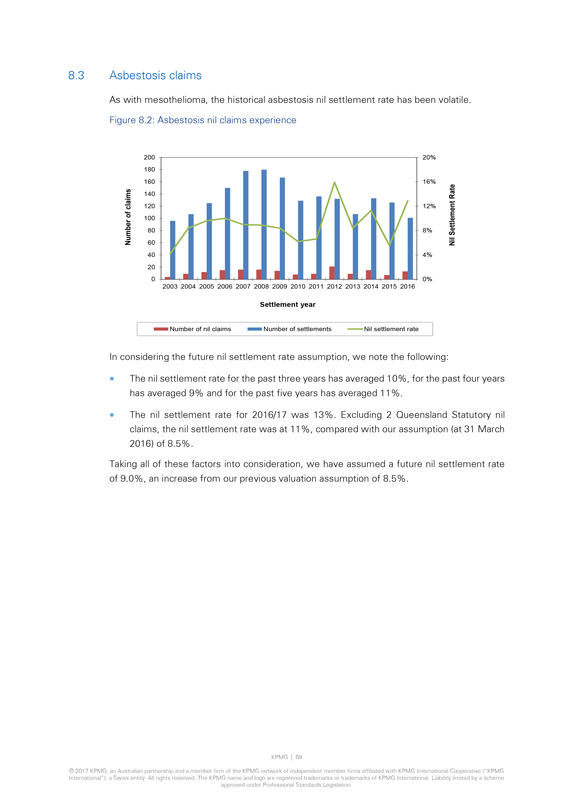
8.3 Asbestosis claims As with mesothelioma, the historical asbestosis nil settlement rate has been volatile. Figure 8.2: Asbestosis nil
claims experience Number of claims 200 20% 180 160 16% 140 120 12% 100 80 8% Nil Settlement Rate 60 40
4% 20 0 0% 2003 2004 2005 2006 2007 2008 2009 2010 2011 2012
2013 2014 2015 2016 Settlement year
Number of nil claims Number of settlements Nil settlement rate In considering the future nil settlement rate assumption, we
note the following: The nil settlement rate for the past three years has averaged 10%, for the past four years has averaged 9% and for the past five years has averaged 11%. The nil settlement rate for 2016/17 was 13%. Excluding 2 Queensland
Statutory nil claims, the nil settlement rate was at 11%, compared with our assumption (at 31 March 2016) of 8.5%.
Taking all of these factors into consideration,
we have assumed a future nil settlement rate of 9.0%, an increase from our previous valuation assumption of 8.5%. KPMG | 68 © 2017 KPMG, an Australian partnership and a member firm of the KPMG network of independent member firms affiliated with
KPMG International Cooperative (“KPMG International”), a Swiss entity. All rights reserved. The KPMG name and logo are registered trademarks or trademarks of KPMG International. Liability limited by a scheme approved under Professional
Standards Legislation.
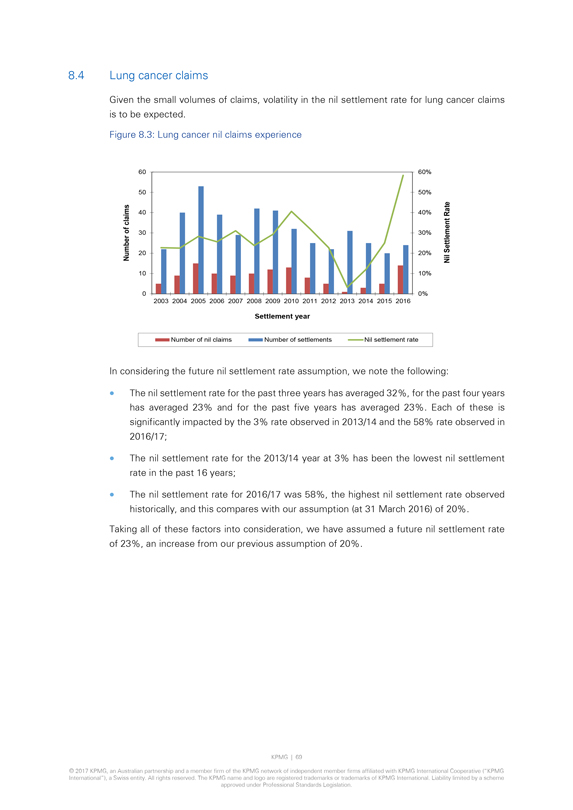
8.4 Lung cancer claims
Given the small volumes of
claims, volatility in the nil settlement rate for lung cancer claims is to be expected.
Figure 8.3: Lung cancer nil claims experience 60 60%
50 50% 40 40% 30 30% Number of claims 20 20% Nil Settlement Rate 10 10% 0 0% 2003 2004 2005 2006 2007 2008 2009 2010 2011 2012 2013 2014 2015 2016 Settlement year Number of nil
claims Number of settlements Nil settlement rate
In considering the future nil settlement rate assumption, we note the following:
The nil settlement rate for the past three years has averaged 32%, for the past four years has averaged 23% and for the past five years has averaged 23%. Each of these is
significantly impacted by the 3% rate observed in 2013/14 and the 58% rate observed in 2016/17;
The nil settlement rate for the 2013/14 year at 3% has been the
lowest nil settlement rate in the past 16 years;
The nil settlement rate for 2016/17 was 58%, the highest nil settlement rate observed historically, and this
compares with our assumption (at 31 March 2016) of 20%.
Taking all of these factors into consideration, we have assumed a future nil settlement rate of 23%, an
increase from our previous assumption of 20%. KPMG | 69 © 2017 KPMG, an Australian partnership and a member firm of the KPMG network of independent member firms affiliated with KPMG International Cooperative (“KPMG International”), a
Swiss entity. All rights reserved. The KPMG name and logo are registered trademarks or trademarks of KPMG International. Liability limited by a scheme approved under Professional Standards Legislation.
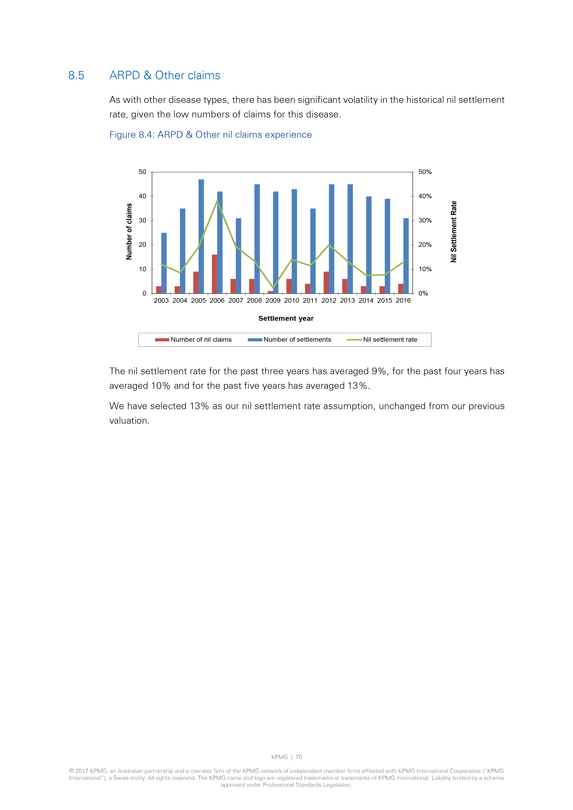
8.5 ARPD & Other claims
As with other disease
types, there has been significant volatility in the historical nil settlement rate, given the low numbers of claims for this disease.
Figure 8.4: ARPD & Other
nil claims experience 50 50% 40 40% 30
30% Number of claims 20 20% Nil Settlement Rate 10 10% 0 0% 2003 2004 2005 2006 2007 2008 2009 2010 2011 2012 2013 2014 2015
2016
Settlement year
Number of nil claims Number of settlements Nil
settlement rate
The nil settlement rate for the past three years has averaged 9%, for the past four years has averaged 10% and for the past five years has averaged
13%. We have selected 13% as our nil settlement rate assumption, unchanged from our previous valuation.
KPMG | 70
© 2017 KPMG, an Australian partnership and a member firm of the KPMG network of independent member firms affiliated with KPMG International Cooperative (“KPMG
International”), a Swiss entity. All rights reserved. The KPMG name and logo are registered trademarks or trademarks of KPMG International. Liability limited by a scheme approved under Professional Standards Legislation.
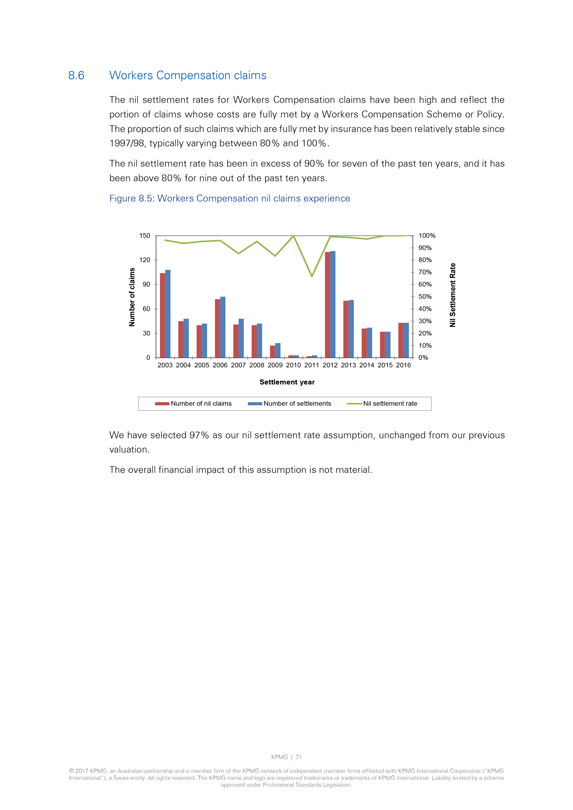
8.6 Workers Compensation claims The nil settlement rates for Workers Compensation claims have been high and reflect the portion of
claims whose costs are fully met by a Workers Compensation Scheme or Policy. The proportion of such claims which are fully met by insurance has been relatively stable since 1997/98, typically varying between 80% and 100%.
The nil settlement rate has been in excess of 90% for seven of the past ten years, and it has been above 80% for nine out of the past ten years.
Figure 8.5: Workers Compensation nil claims experience
Number of claims
150 100% 90% 120 80% 70% 90 60% 50% 60 40% 30% 30 20% 10% 0 0%
2003 2004 2005 2006 2007 2008
2009 2010 2011 2012 2013 2014 2015 2016
Nil Settlement Rate
Settlement year
Number of nil claims Number of settlements Nil settlement rate
We have selected 97% as our nil settlement rate assumption, unchanged from our previous valuation.
The overall financial impact of this assumption is not material.
KPMG | 71
© 2017 KPMG, an Australian partnership and a member firm of the KPMG network of independent member firms affiliated with KPMG International Cooperative
(“KPMG International”), a Swiss entity. All rights reserved. The KPMG name and logo are registered trademarks or trademarks of KPMG International. Liability limited by a scheme approved under Professional Standards Legislation.
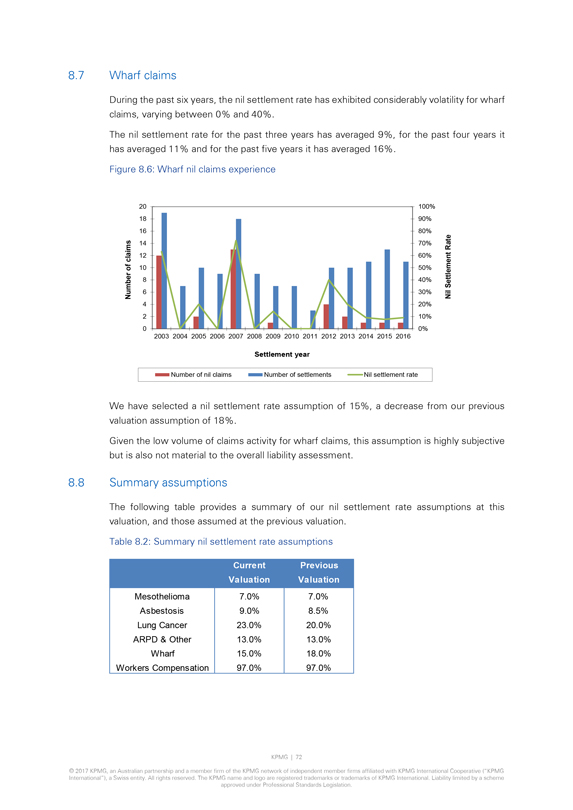
8.7 Wharf claims
During the past six years, the
nil settlement rate has exhibited considerably volatility for wharf claims, varying between 0% and 40%.
The nil settlement rate for the past three years has
averaged 9%, for the past four years it has averaged 11% and for the past five years it has averaged 16%.
Figure 8.6: Wharf nil claims experience
20 100%
18 90%
16 80%
14 70%
Number of claims
12 60%
10 50%
8 40%
Nil Settlement Rate
6 30%
4 20%
2 10%
0 0%
2003 2004 2005 2006 2007 2008 2009 2010 2011 2012 2013 2014 2015 2016
Settlement year
Number of nil claims
Number of settlements
Nil settlement rate
We have selected a nil settlement rate assumption of 15%, a decrease from our previous valuation assumption of 18%.
Given the low volume of claims activity for wharf claims, this assumption is highly subjective but is also not material to the overall liability assessment.
8.8 Summary assumptions
The following table provides a summary of our nil settlement rate
assumptions at this valuation, and those assumed at the previous valuation.
Table 8.2: Summary nil settlement rate assumptions
Current Valuation
Previous Valuation
Mesothelioma 7.0% 7.0%
Asbestosis 9.0% 8.5%
Lung Cancer 23.0% 20.0%
ARPD & Other 13.0% 13.0%
Wharf 15.0% 18.0%
Workers Compensation 97.0% 97.0%
KPMG | 72
© 2017 KPMG, an Australian partnership and a member firm of the KPMG network of
independent member firms affiliated with KPMG International Cooperative (“KPMG International”), a Swiss entity. All rights reserved. The KPMG name and logo are registered trademarks or trademarks of KPMG International. Liability limited by
a scheme approved under Professional Standards Legislation.
9. Economic and Other Assumptions
9.1 Overview
The two main economic assumptions required for our valuation are:
The
underlying claims inflation assumptions adopted to project the future claims settlement amounts and related costs.
The discount rate adopted for the present value
determinations.
These are considered in turn in Sections 9.2 to 9.4.
We also
discuss the basis of derivation of other assumptions, being:
The cross-claim recovery rate; and
The pattern of settlement of future reported claims and pending claims.
9.2 Claims inflation
We are required to make assumptions about the future rate of inflation of claims costs. We have adopted a standard Australian actuarial claims inflation model for
liabilities of the type considered in this report that is based on:
An underlying, or base, rate of general economic inflation relevant to the liabilities, in this
case based on wage/salary (earnings) inflation; and
A rate of superimposed inflation, i.e. the rate at which claims costs inflation exceeds base inflation.
9.2.1 Base inflation basis
Ideally, we would aim to derive our long term base
inflation assumptions based on observable market indicators or other economic benchmarks. Unfortunately, such indicators and benchmarks typically focus on inflation measures such as CPI (e.g. CPI index bond yields and RBA inflation targets).
We have derived our base inflation assumption from CPI based indicators together with long term CPI / AWOTE relativities.
KPMG | 73
© 2017 KPMG, an Australian partnership and a member firm of the KPMG network of
independent member firms affiliated with KPMG International Cooperative (“KPMG International”), a Swiss entity. All rights reserved. The KPMG name and logo are registered trademarks or trademarks of KPMG International. Liability limited by
a scheme approved under Professional Standards Legislation.
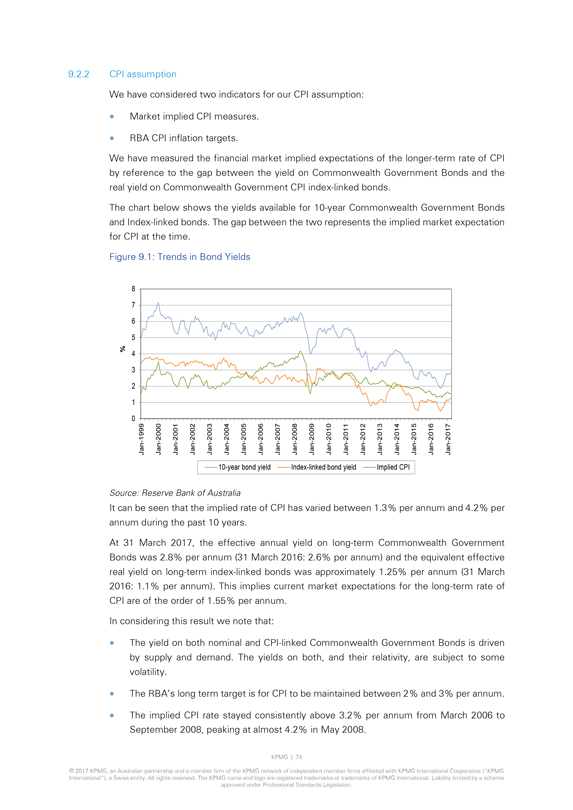
9.2.2 CPI assumption
We have considered two
indicators for our CPI assumption:
Market implied CPI measures.
RBA CPI
inflation targets.
We have measured the financial market implied expectations of the longer-term rate of CPI by reference to the gap between the yield on
Commonwealth Government Bonds and the real yield on Commonwealth Government CPI index-linked bonds.
The chart below shows the yields available for 10-year Commonwealth Government Bonds and Index-linked bonds. The gap between the two represents the implied market expectation for CPI at the time.
Figure 9.1: Trends in Bond Yields
%
0
1
2
3
4
5
6
7
8
Jan-1999 Jan-2000 Jan-2001 Jan-2002 Jan-2003 Jan-2004 Jan-2005 Jan-2006 Jan-2007 Jan-2008 Jan-2009 Jan-2010 Jan-2011 Jan-2012 Jan-2013 Jan-2014 Jan-2015 Jan-2016 Jan-2017
10-year bond yield
Index-linked bond yield
Implied CPI
Source: Reserve Bank of Australia
It can be seen that the implied rate of CPI has varied
between 1.3% per annum and 4.2% per annum during the past 10 years.
At 31 March 2017, the effective annual yield on long-term Commonwealth Government Bonds
was 2.8% per annum (31 March 2016: 2.6% per annum) and the equivalent effective real yield on long-term index-linked bonds was approximately 1.25% per annum (31 March 2016: 1.1% per annum). This implies current market expectations for the
long-term rate of CPI are of the order of 1.55% per annum.
In considering this result we note that:
The yield on both nominal and CPI-linked Commonwealth Government Bonds is driven by supply and demand. The yields on both, and their
relativity, are subject to some volatility.
The RBA’s long term target is for CPI to be maintained between 2% and 3% per annum.
The implied CPI rate stayed consistently above 3.2% per annum from March 2006 to September 2008, peaking at almost 4.2% in May 2008.
KPMG | 74
© 2017 KPMG, an Australian partnership and a member firm of the KPMG network of
independent member firms affiliated with KPMG International Cooperative (“KPMG International”), a Swiss entity. All rights reserved. The KPMG name and logo are registered trademarks or trademarks of KPMG International. Liability limited by
a scheme approved under Professional Standards Legislation.
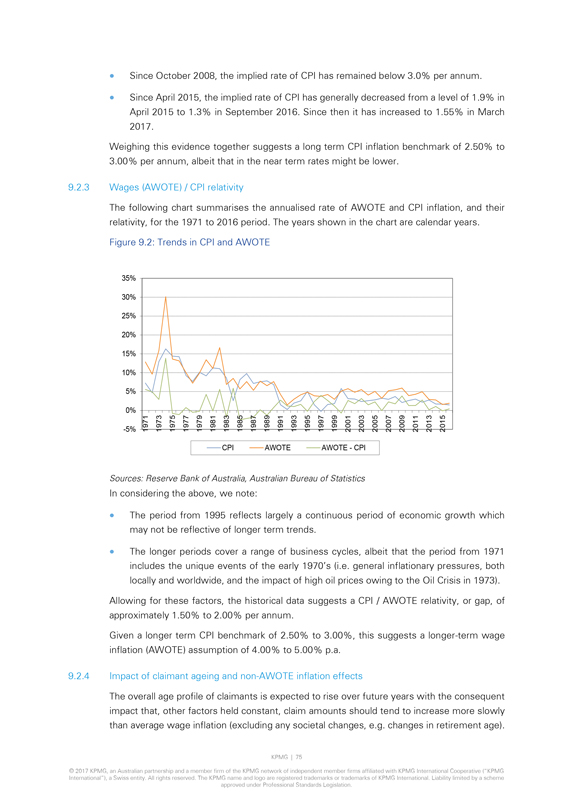
Since October 2008, the implied rate of CPI has remained below 3.0% per annum.
Since April 2015, the implied rate of CPI has generally decreased from a level of 1.9% in April 2015 to 1.3% in September 2016. Since then it has increased to 1.55% in March 2017.
Weighing this evidence together suggests a long term CPI inflation benchmark of 2.50% to
3.00% per annum, albeit that in the near term rates might be lower.
9.2.3 Wages (AWOTE) / CPI
relativity
The following chart summarises the annualised rate of AWOTE and CPI inflation, and their relativity, for the 1971 to 2016 period. The years shown in the
chart are calendar years.
Figure 9.2: Trends in CPI and AWOTE
-5%
0%
5%
10%
15%
20%
25%
30%
35%
1971 1973 1975 1977 1979 1981 1983 1985 1987 1989 1991 1993 1995 1997 1999 2001 2003 2005 2007 2009 2011 2013 2015
CPI
AWOTE
AWOTE - CPI
Sources: Reserve Bank of Australia, Australian Bureau of
Statistics
In considering the above, we note:
The period from 1995 reflects
largely a continuous period of economic growth which may not be reflective of longer term trends.
The longer periods cover a range of business cycles, albeit that
the period from 1971 includes the unique events of the early 1970’s (i.e. general inflationary pressures, both locally and worldwide, and the impact of high oil prices owing to the Oil Crisis in 1973).
Allowing for these factors, the historical data suggests a CPI / AWOTE relativity, or gap, of approximately 1.50% to 2.00% per annum.
Given a longer term CPI benchmark of 2.50% to 3.00%, this suggests a longer-term wage inflation (AWOTE) assumption of 4.00% to 5.00% p.a.
9.2.4 Impact of claimant ageing and non-AWOTE inflation effects
The overall age profile of claimants is expected to rise over future years with the consequent impact that, other factors held constant, claim amounts should tend to increase more
slowly than average wage inflation (excluding any societal changes, e.g. changes in retirement age).
KPMG | 75
© 2017 KPMG, an Australian partnership and a member firm of the KPMG network of independent member firms affiliated with KPMG International Cooperative (“KPMG
International”), a Swiss entity. All rights reserved. The KPMG name and logo are registered trademarks or trademarks of KPMG International. Liability limited by a scheme approved under Professional Standards Legislation.
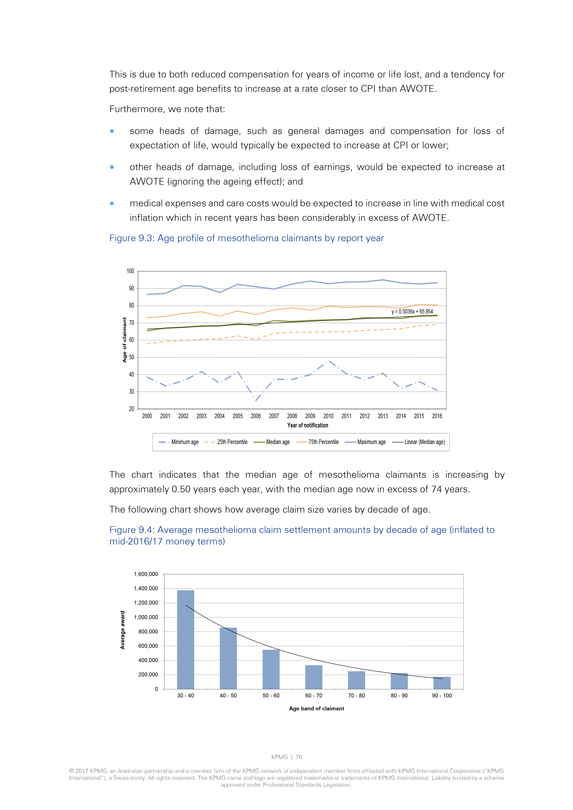
This is due to both reduced compensation for years of income or life lost, and a tendency for post-retirement age benefits to increase
at a rate closer to CPI than AWOTE.
Furthermore, we note that:
some heads of
damage, such as general damages and compensation for loss of expectation of life, would typically be expected to increase at CPI or lower;
other heads of damage,
including loss of earnings, would be expected to increase at AWOTE (ignoring the ageing effect); and
medical expenses and care costs would be expected to increase
in line with medical cost inflation which in recent years has been considerably in excess of AWOTE.
Figure 9.3: Age profile of mesothelioma claimants by report
year
Age of claimant
y = 0.5036x + 65.954
100
90
80
70
60
50
40
30
20
2000 2001 2002 2003 2004 2005 2006 2007 2008 2009 2010 2011 2012 2013 2014 2015 2016
Year of
notification
Minimum age
25th Percentile Median age
75th Percentile
Maximum age
Linear (Median age)
The chart indicates that the median age of mesothelioma claimants is
increasing by approximately 0.50 years each year, with the median age now in excess of 74 years.
The following chart shows how average claim size varies by decade
of age.
Figure 9.4: Average mesothelioma claim settlement amounts by decade of age (inflated to mid-2016/17 money terms)
Average award
1,600,000
1,400,000
1,200,000
1,000,000
800,000
600,000
400,000
200,000
0
30 - 40
40 - 50
50 - 60
60 - 70
70 - 80
80 - 90
90 - 100
Age band of claimant
KPMG | 76
© 2017 KPMG, an Australian partnership and a member firm of the KPMG network of
independent member firms affiliated with KPMG International Cooperative (“KPMG International”), a Swiss entity. All rights reserved. The KPMG name and logo are registered trademarks or trademarks of KPMG International. Liability limited by
a scheme approved under Professional Standards Legislation.
The analysis suggests that the average mesothelioma award reduces by approximately 30% for each increasing decade of age when
considering the typical age range of the claimants (i.e. over 60 years of age), although it can be seen that the rate of reduction in award sizes by decade of age decreases after 60 years of age.
Weighing these various factors together, and allowing for the relative mix of claims between mesothelioma and non-mesothelioma, we consider
that a reasonable assumption for the deflationary allowance for the impact of increases in the average age of claimants upon average sizes is approximately 0.75% to 1.00% per annum.
Taking all of these factors into account, we have adopted a long-term base inflation assumption of 4.00% per annum.
The adopted assumption is slightly lower than our previous long-term assumption of 4.25% per annum.
9.2.5 Adjustments to base inflation assumptions in the short term
With the current prevailing
economic conditions, including lower yields and implied lower outlook for inflation measures, we consider it appropriate to select lower short term assumptions for base inflation.
In the short to medium term, we have adopted 3.50% as the base inflation assumption for 2017/18, increasing to 3.75% for 2018/19 and 4.00% for 2019/20. These assumptions have been
maintained from our previous valuation.
We have assumed that the long-term rates of base inflation will apply from 2020/21 onwards.
The following table summarizes the base inflation assumptions we have selected for the current and previous valuations.
Table 9.1: Base inflation assumptions
Current Valuation
Previous Valuation
2016/17 n/a 3.50%
2017/18 3.50% 3.50%
2018/19 3.75% 3.75%
2019/20 4.00% 4.00%
Long-term 4.00% 4.25%
These assumptions apply both to claims awards and legal costs.
KPMG | 77
© 2017 KPMG, an Australian partnership and a member firm of the KPMG network of independent member firms affiliated with KPMG International Cooperative (“KPMG
International”), a Swiss entity. All rights reserved. The KPMG name and logo are registered trademarks or trademarks of KPMG International. Liability limited by a scheme approved under Professional Standards Legislation.
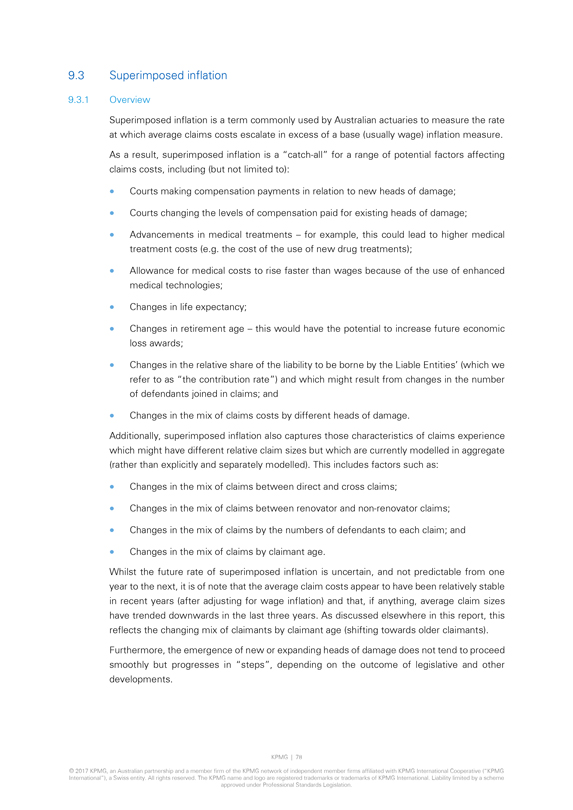
9.3 Superimposed inflation
9.3.1 Overview
Superimposed inflation is a term commonly used by Australian actuaries to measure the rate at which average claims costs escalate in excess of a base (usually
wage) inflation measure.
As a result, superimposed inflation is a “catch-all” for a range of potential factors
affecting claims costs, including (but not limited to):
Courts making compensation payments in relation to new heads of damage;
Courts changing the levels of compensation paid for existing heads of damage;
Advancements in
medical treatments – for example, this could lead to higher medical treatment costs (e.g. the cost of the use of new drug treatments);
Allowance for medical
costs to rise faster than wages because of the use of enhanced medical technologies;
Changes in life expectancy;
Changes in retirement age - this would have the potential to increase future economic loss awards;
Changes in the relative share of the liability to be borne by the Liable Entities’ (which we refer to as “the contribution rate”) and which might result from changes
in the number of defendants joined in claims; and
Changes in the mix of claims costs by different heads of damage.
Additionally, superimposed inflation also captures those characteristics of claims experience which might have different relative claim sizes but which are currently modelled in
aggregate (rather than explicitly and separately modelled). This includes factors such as:
Changes in the mix of claims between direct and cross claims;
Changes in the mix of claims between renovator and non-renovator claims;
Changes in the mix of claims by the numbers of defendants to each claim; and
Changes in the
mix of claims by claimant age.
Whilst the future rate of superimposed inflation is uncertain, and not predictable from one year to the next, it is of note that the
average claim costs appear to have been relatively stable in recent years (after adjusting for wage inflation) and that, if anything, average claim sizes
have
trended downwards in the last three years. As discussed elsewhere in this report, this reflects the changing mix of claimants by claimant age (shifting towards older claimants). Furthermore, the emergence of new or expanding heads of damage does not
tend to proceed smoothly but progresses in “steps”, depending on the outcome of legislative and other developments.
KPMG | 78
© 2017 KPMG, an Australian partnership and a member firm of the KPMG network of independent member firms affiliated with KPMG International Cooperative (“KPMG
International”), a Swiss entity. All rights reserved. The KPMG name and logo are registered trademarks or trademarks of KPMG International. Liability limited by a scheme approved under Professional Standards Legislation.
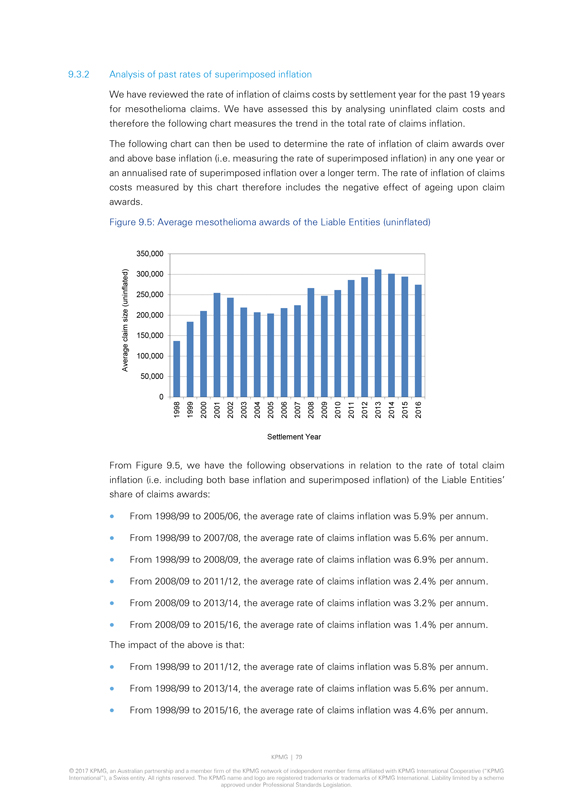
9.3.2 Analysis of past rates of superimposed inflation
We have reviewed the rate of inflation of claims costs by settlement year for the past 19 years for mesothelioma claims. We have assessed this by analysing uninflated claim costs
and therefore the following chart measures the trend in the total rate of claims inflation.
The following chart can then be used to determine the rate of inflation
of claim awards over and above base inflation (i.e. measuring the rate of superimposed inflation) in any one year or an annualised rate of superimposed inflation over a longer term. The rate of inflation of claims costs measured by this chart
therefore includes the negative effect of ageing upon claim awards.
Figure 9.5: Average mesothelioma awards of the Liable Entities (uninflated)
Average claim size (uninflated)
0
50,000
100,000
150,000
200,000
250,000
300,000
350,000
1998 1999 2000 2001 2002 2003 2004 2005 2006 2007 2008 2009 2010 2011 2012 2013 2014
2015 2016
Settlement Year
From Figure 9.5, we have the following observations
in relation to the rate of total claim inflation (i.e. including both base inflation and superimposed inflation) of the Liable Entities’ share of claims awards:
From 1998/99 to 2005/06, the average rate of claims inflation was 5.9% per annum.
From 1998/99 to 2007/08, the average rate of claims inflation was 5.6% per annum.
From 1998/99
to 2008/09, the average rate of claims inflation was 6.9% per annum.
From 2008/09 to 2011/12, the average rate of claims inflation was 2.4% per annum.
From 2008/09 to 2013/14, the average rate of claims inflation was 3.2% per annum.
From 2008/09
to 2015/16, the average rate of claims inflation was 1.4% per annum.
The impact of the above is that:
From 1998/99 to 2011/12, the average rate of claims inflation was 5.8% per annum.
From 1998/99
to 2013/14, the average rate of claims inflation was 5.6% per annum.
From 1998/99 to 2015/16, the average rate of claims inflation was 4.6% per annum.
KPMG | 79
© 2017 KPMG, an Australian partnership and a member firm of the KPMG network of
independent member firms affiliated with KPMG International Cooperative (“KPMG International”), a Swiss entity. All rights reserved. The KPMG name and logo are registered trademarks or trademarks of KPMG International. Liability limited by
a scheme approved under Professional Standards Legislation.
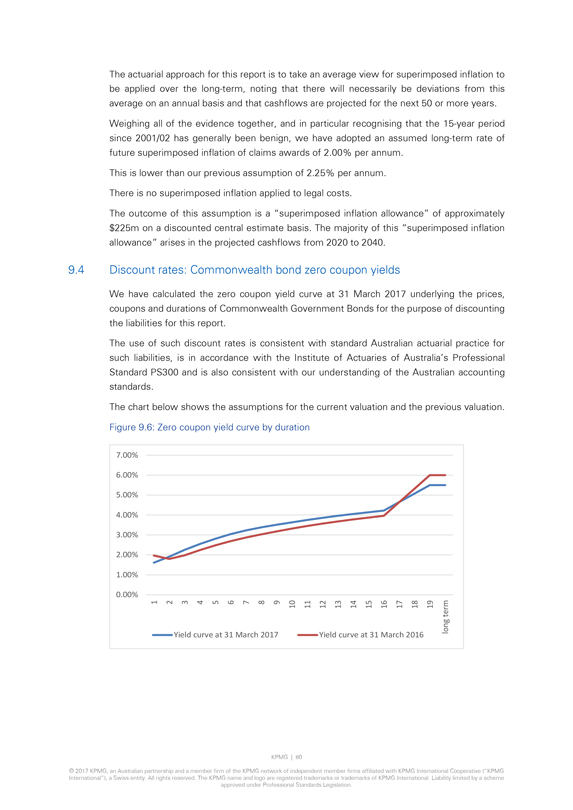
The actuarial approach for this report is to take an average view for superimposed inflation to be applied over the long-term, noting
that there will necessarily be deviations from this average on an annual basis and that cashflows are projected for the next 50 or more years.
Weighing all of the
evidence together, and in particular recognising that the 15-year period since 2001/02 has generally been benign, we have adopted an assumed long-term rate of future superimposed inflation of claims awards of
2.00% per annum.
This is lower than our previous assumption of 2.25% per annum.
There is no superimposed inflation applied to legal costs.
The outcome of
this assumption is a “superimposed inflation allowance” of approximately $225m on a discounted central estimate basis. The majority of this “superimposed inflation allowance” arises in the projected cashflows from 2020 to 2040.
9.4 Discount rates: Commonwealth bond zero coupon yields
We have calculated
the zero coupon yield curve at 31 March 2017 underlying the prices, coupons and durations of Commonwealth Government Bonds for the purpose of discounting the liabilities for this report.
The use of such discount rates is consistent with standard Australian actuarial practice for such liabilities, is in accordance with the Institute of Actuaries of Australia’s
Professional Standard PS300 and is also consistent with our understanding of the Australian accounting standards.
The chart below shows the assumptions for the
current valuation and the previous valuation.
Figure 9.6: Zero coupon yield curve by duration
7.00%
6.00%
5.00%
4.00%
3.00%
2.00%
1.00%
0.00%
1 2 3 4 5 6 7 8 9 10 11 12 13 14 15 16 17 18 19
long term
Yield curve at 31 March 2017
Yield curve at 31 March 2016
KPMG | 80
© 2017 KPMG, an Australian partnership and a member firm of the KPMG network of
independent member firms affiliated with KPMG International Cooperative (“KPMG International”), a Swiss entity. All rights reserved. The KPMG name and logo are registered trademarks or trademarks of KPMG International. Liability limited by
a scheme approved under Professional Standards Legislation.
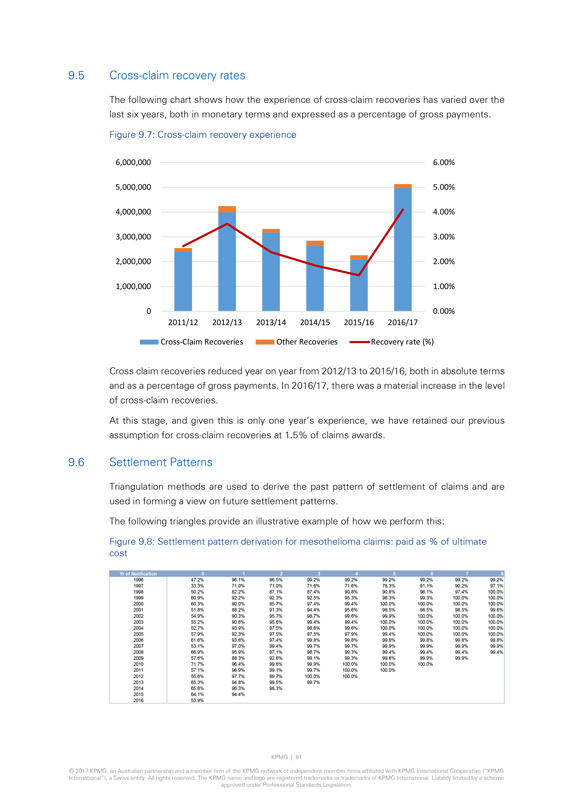
9.5 Cross-claim recovery rates
The following chart
shows how the experience of cross-claim recoveries has varied over the last six years, both in monetary terms and expressed as a percentage of gross payments.
Figure 9.7: Cross-claim recovery experience
6,000,000 6.00%
5,000,000 5.00%
4,000,000 4.00%
3,000,000 3.00%
2,000,000 2.00%
1,000,000 1.00%
0 0.00%
2011/12
2012/13
2013/14
2014/15
2015/16
2016/17
Cross-Claim Recoveries
Other Recoveries
Recovery rate (%)
Cross claim recoveries reduced year on year from 2012/13 to 2015/16, both in
absolute terms and as a percentage of gross payments. In 2016/17, there was a material increase in the level of cross-claim recoveries.
At this stage, and given
this is only one year’s experience, we have retained our previous assumption for cross-claim recoveries at 1.5% of claims awards.
9.6 Settlement Patterns
Triangulation methods are used to derive the past pattern of settlement of claims and are used in forming a view on future settlement patterns.
The following triangles provide an illustrative example of how we perform this:
Figure 9.8:
Settlement pattern derivation for mesothelioma claims: paid as % of ultimate cost
Yr of Notification
0 1 2 3 4 5 6 7 8
1996 47.2% 96.1% 96.5% 99.2% 99.2% 99.2% 99.2% 99.2% 99.2%
1997 33.3% 71.0% 71.0% 71.6% 71.6% 78.3% 81.1% 90.2% 97.1%
1998 50.2% 82.2% 87.1% 87.4% 90.8%
90.8% 96.1% 97.4% 100.0%
1999 60.9% 92.2% 92.3% 92.5% 95.3% 96.3% 99.3% 100.0% 100.0%
2000 60.3% 90.0% 95.7% 97.4% 99.4% 100.0% 100.0% 100.0% 100.0%
2001 51.8% 88.2% 91.3% 94.4%
95.6% 98.5% 98.5% 98.5% 99.6%
2002 54.9% 90.3% 95.7% 98.7% 99.6% 99.9% 100.0% 100.0% 100.0%
2003 55.2% 90.6% 95.6% 99.4% 99.4% 100.0% 100.0% 100.0% 100.0%
2004 52.7% 93.9% 97.5% 98.6%
99.6% 100.0% 100.0% 100.0% 100.0%
2005 57.9% 92.3% 97.5% 97.5% 97.9% 99.4% 100.0% 100.0% 100.0%
2006 61.6% 93.6% 97.4% 99.8% 99.8% 99.8% 99.8% 99.8% 99.8%
2007 53.1% 97.0% 99.4% 99.7% 99.7%
99.9% 99.9% 99.9% 99.9%
2008 66.9% 95.9% 97.1% 98.7% 99.3% 99.4% 99.4% 99.4% 99.4%
2009 57.6% 88.3% 92.6% 99.1% 99.3% 99.6% 99.9% 99.9%
2010 71.7% 96.4% 99.6% 99.9% 100.0%
100.0% 100.0%
2011 57.1% 96.9% 99.1% 99.7% 100.0% 100.0%
2012 55.6% 97.7%
99.7% 100.0% 100.0%
2013 65.3% 94.8% 99.5% 99.7%
2014 65.8% 96.3% 98.3%
2015 64.1% 94.4%
2016 53.9%
KPMG | 81
© 2017 KPMG, an Australian partnership and a member firm of the KPMG network of
independent member firms affiliated with KPMG International Cooperative (“KPMG International”), a Swiss entity. All rights reserved. The KPMG name and logo are registered trademarks or trademarks of KPMG International. Liability limited by
a scheme approved under Professional Standards Legislation.
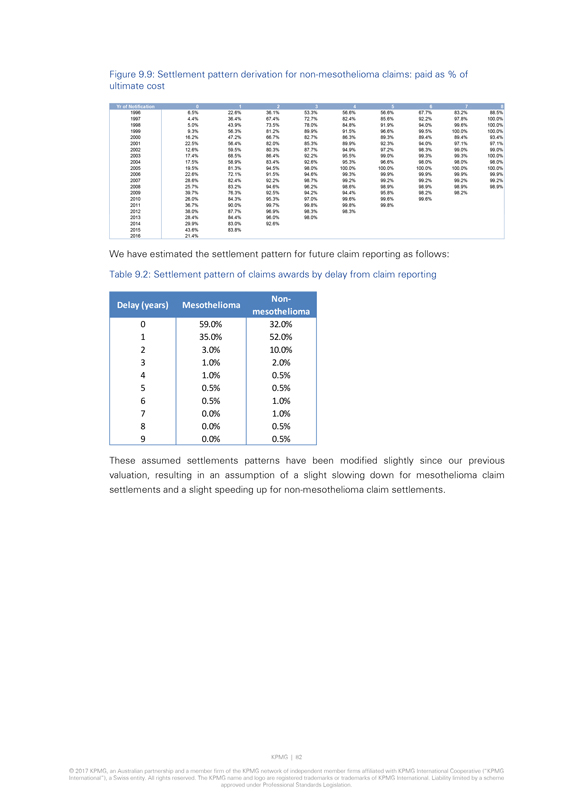
Figure 9.9: Settlement pattern derivation for non-mesothelioma claims: paid as % of ultimate
cost
Yr of Notification
0 1 2 3 4 5 6 7 8
1996 6.5% 22.6% 36.1% 53.3% 56.6% 56.6% 67.7% 83.2% 88.5%
1997 4.4% 36.4% 67.4% 72.7% 82.4%
85.6% 92.2% 97.8% 100.0%
1998 5.0% 43.9% 73.5% 78.0% 84.8% 91.9% 94.0% 99.6% 100.0%
1999 9.3% 56.3% 81.2% 89.9% 91.5% 96.6% 99.5% 100.0% 100.0%
2000 16.2% 47.2% 66.7% 82.7% 86.3%
89.3% 89.4% 89.4% 93.4%
2001 22.5% 56.4% 82.0% 85.3% 89.9% 92.3% 94.0% 97.1% 97.1%
2002 12.6% 59.5% 80.3% 87.7% 94.9% 97.2% 98.3% 99.0% 99.0%
2003 17.4% 68.5% 86.4% 92.2% 95.5%
99.0% 99.3% 99.3% 100.0%
2004 17.5% 58.9% 83.4% 92.6% 95.3% 96.6% 98.0% 98.0% 98.0%
2005 19.5% 81.3% 94.5% 98.0% 100.0% 100.0% 100.0% 100.0% 100.0%
2006 22.6% 72.1% 91.5% 94.6%
99.3% 99.9% 99.9% 99.9% 99.9%
2007 28.6% 82.4% 92.2% 98.7% 99.2% 99.2% 99.2% 99.2% 99.2%
2008 25.7% 83.2% 94.6% 96.2% 98.6% 98.9% 98.9% 98.9% 98.9%
2009 39.7% 76.3% 92.5% 94.2% 94.4%
95.8% 98.2% 98.2%
2010 26.0% 84.3% 95.3% 97.0% 99.6% 99.6% 99.6%
2011 36.7%
90.0% 99.7% 99.8% 99.8% 99.8%
2012 38.0% 87.7% 96.9% 98.3% 98.3%
2013 28.4%
84.4% 96.0% 98.0%
2014 29.9% 83.0% 92.6%
2015 43.6% 83.8%
2016 21.4%
We have estimated the settlement pattern for future claim reporting as follows:
Table 9.2: Settlement pattern of claims awards by delay from claim reporting
Delay (years)
Mesothelioma
Non-mesothelioma
0 59.0% 32.0%
1 35.0% 52.0%
2 3.0% 10.0%
3 1.0% 2.0%
4 1.0% 0.5%
5 0.5% 0.5%
6 0.5% 1.0%
7 0.0% 1.0%
8 0.0% 0.5%
9 0.0% 0.5%
These assumed settlements patterns have been modified slightly since our previous valuation, resulting in an assumption of a slight slowing down for mesothelioma claim settlements
and a slight speeding up for non-mesothelioma claim settlements.
KPMG | 82
© 2017 KPMG, an Australian partnership and a member firm of the KPMG network of independent member firms affiliated with KPMG International Cooperative (“KPMG
International”), a Swiss entity. All rights reserved. The KPMG name and logo are registered trademarks or trademarks of KPMG International. Liability limited by a scheme approved under Professional Standards Legislation.
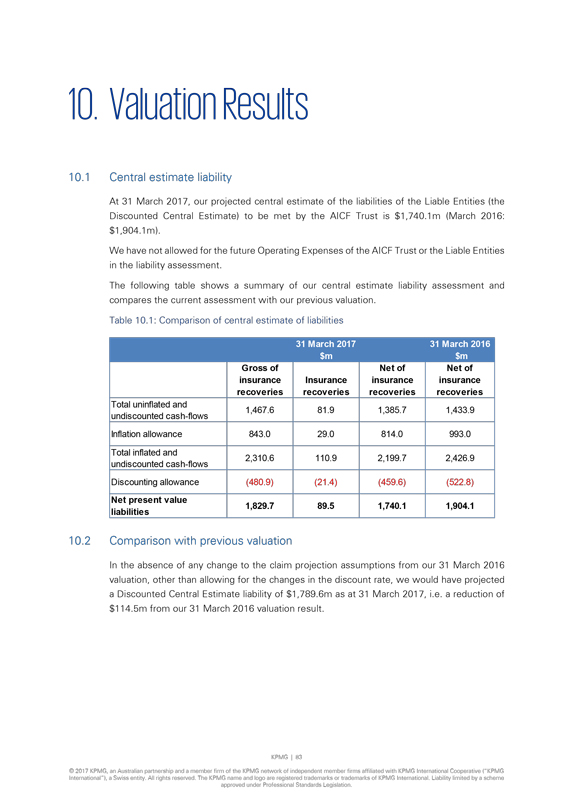
10. Valuation Results
10.1 Central estimate
liability
At 31 March 2017, our projected central estimate of the liabilities of the Liable Entities (the Discounted Central Estimate) to be met by the AICF
Trust is $1,740.1m (March 2016: $1,904.1m).
We have not allowed for the future Operating Expenses of the AICF Trust or the Liable Entities in the liability
assessment.
The following table shows a summary of our central estimate liability assessment and compares the current assessment with our previous valuation.
Table 10.1: Comparison of central estimate of liabilities
31 March 2017
$m 31 March 2016 $m
Gross of insurance recoveries Insurance recoveries Net of insurance recoveries Net of insurance recoveries
Total uninflated and undiscounted cash-flows 1,467.6 81.9 1,385.7 1,433.9
Inflation allowance
843.0 29.0 814.0 993.0
Total inflated and undiscounted cash-flows 2,310.6 110.9 2,199.7 2,426.9
Discounting allowance (480.9) (21.4) (459.6) (522.8)
Net present value liabilities 1,829.7
89.5 1,740.1 1,904.1
10.2 Comparison with previous valuation
In the absence
of any change to the claim projection assumptions from our 31 March 2016 valuation, other than allowing for the changes in the discount rate, we would have projected a Discounted Central Estimate liability of $1,789.6m as at 31 March 2017,
i.e. a reduction of $114.5m from our 31 March 2016 valuation result.
KPMG | 83
© 2017 KPMG, an Australian partnership and a member firm of the KPMG network of independent member firms affiliated with KPMG International Cooperative (“KPMG
International”), a Swiss entity. All rights reserved. The KPMG name and logo are registered trademarks or trademarks of KPMG International. Liability limited by a scheme approved under Professional Standards Legislation.
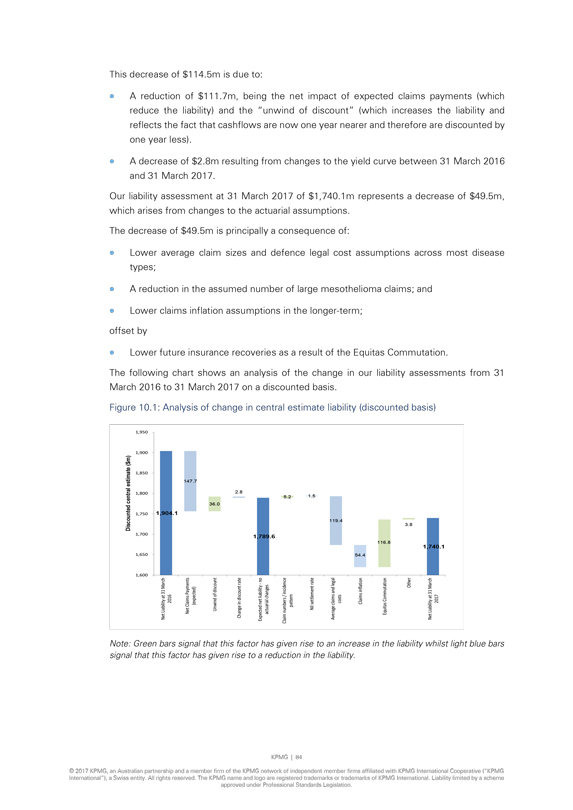
This decrease of $114.5m is due to:
• A
reduction of $111.7m, being the net impact of expected claims payments (which reduce the liability) and the “unwind of discount” (which increases the liability and reflects the fact that cashflows are now one year nearer and therefore are
discounted by one year less).
• A decrease of $2.8m resulting from changes to the yield curve between 31 March 2016 and 31 March 2017.
Our liability assessment at 31 March 2017 of $1,740.1m represents a decrease of $49.5m, which arises from changes to the actuarial assumptions.
The decrease of $49.5m is principally a consequence of:
• Lower average claim sizes and
defence legal cost assumptions across most disease types;
• A reduction in the assumed number of large mesothelioma claims; and
• Lower claims inflation assumptions in the longer-term; offset by
• Lower future
insurance recoveries as a result of the Equitas Commutation.
The following chart shows an analysis of the change in our liability assessments from 31 March
2016 to 31 March 2017 on a discounted basis.
Figure 10.1: Analysis of change in central estimate liability (discounted basis)
Discounted central estimate ($m)
1,950
1,900
1,850
1,800
1,750
1,700
1,650
1,600
1,904.1
147.7
36.0
2.8
1,789.6
5.2
1.5
119.4
54.4
116.8
3.8
1,740.1
Net Liability at 31 March 2016
Net Claims Payments (expected)
Unwind of discount
Change in discount rate
Expected net liability - no actuarial changes
Claim numbers / incidence pattern
Nil settlement rate
Average claims and legal costs
Claims inflation
Equitas Commutation
Other
Net Liability at 31 March 2017
Note: Green bars signal that this factor has given rise to
an increase in the liability whilst light blue bars signal that this factor has given rise to a reduction in the liability.
KPMG | 84
© 2017 KPMG, an Australian partnership and a member firm of the KPMG network of independent member firms affiliated with KPMG International Cooperative (“KPMG
International”), a Swiss entity. All rights reserved. The KPMG name and logo are registered trademarks or trademarks of KPMG International. Liability limited by a scheme approved under Professional Standards Legislation.
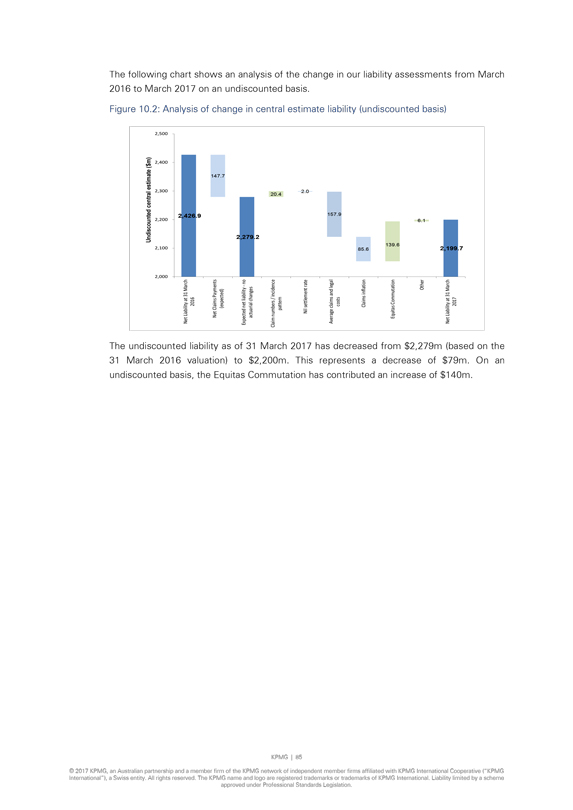
The following chart shows an analysis of the change in our liability assessments from March 2016 to March 2017 on an undiscounted basis.
Figure 10.2: Analysis of change in central estimate liability (undiscounted basis)
Undiscounted central estimate ($m)
2,500
2,400
2,300
2,200
2,100
2,000
2,426.9
147.7
2,279.2
20.4
2.0
157.9
85.6
139.6
6.1
2,199.7
Net Liability at 31 March 2016
Net Claims Payments (expected)
Expected net liability - no actuarial changes
Claim numbers / incidence pattern
Nil settlement rate
Average claims and legal costs
Claims inflation
Equitas Commutation
Other
Net Liability at 31 March 2017
The undiscounted liability as of 31 March 2017 has
decreased from $2,279m (based on the
31 March 2016 valuation) to $2,200m. This represents a decrease of $79m. On an undiscounted basis, the Equitas
Commutation has contributed an increase of $140m.
KPMG | 85
© 2017 KPMG,
an Australian partnership and a member firm of the KPMG network of independent member firms affiliated with KPMG International Cooperative (“KPMG International”), a Swiss entity. All rights reserved. The KPMG name and logo are registered
trademarks or trademarks of KPMG International. Liability limited by a scheme approved under Professional Standards Legislation.
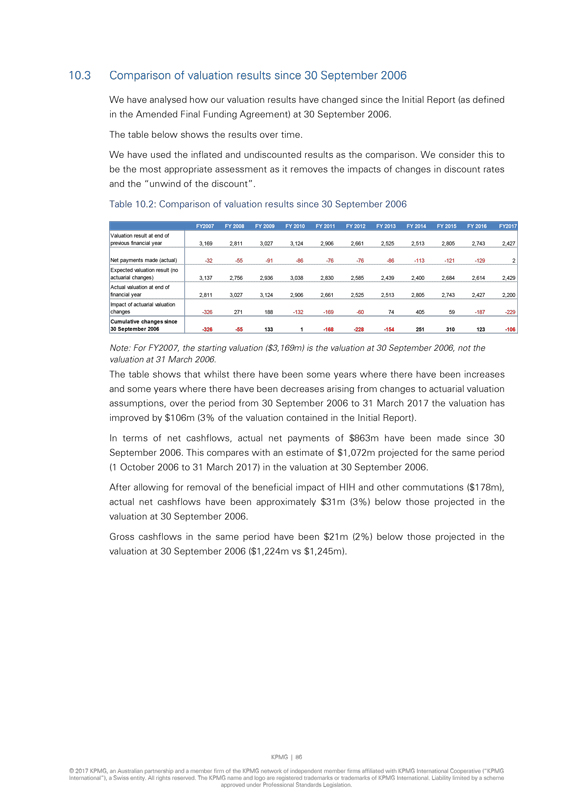
10.3 Comparison of valuation results since 30 September 2006
We have analysed how our valuation results have changed since the Initial Report (as defined in the Amended Final Funding Agreement) at 30 September 2006.
The table below shows the results over time.
We have used the inflated and undiscounted
results as the comparison. We consider this to be the most appropriate assessment as it removes the impacts of changes in discount rates and the “unwind of the discount”.
Table 10.2: Comparison of valuation results since 30 September 2006
FY2007 FY 2008 FY
2009 FY 2010 FY 2011 FY 2012 FY 2013 FY 2014 FY 2015 FY 2016 FY2017
Valuation result at end of previous financial year 3,169 2,811 3,027 3,124 2,906 2,661 2,525
2,513 2,805 2,743 2,427
Net payments made (actual) -32 -55 -91 -86 -76 -76 -86 -113 -121 -129 2
Expected valuation result (no actuarial changes) 3,137 2,756 2,936 3,038 2,830 2,585 2,439 2,400 2,684 2,614 2,429
Actual valuation at end of financial year 2,811 3,027 3,124 2,906 2,661 2,525 2,513 2,805 2,743 2,427 2,200
Impact of actuarial valuation changes -326 271 188 -132 -169 -60 74 405 59 -187 -229
Cumulative changes since 30 September 2006 -326 -55 133 1 -168 -228 -154 251 310 123 -106
Note: For FY2007, the starting valuation ($3,169m) is the valuation at 30 September 2006, not the valuation at 31 March 2006.
The table shows that whilst there have been some years where there have been increases and some years where there have been decreases arising from changes to actuarial valuation
assumptions, over the period from 30 September 2006 to 31 March 2017 the valuation has improved by $106m (3% of the valuation contained in the Initial Report).
In terms of net cashflows, actual net payments of $863m have been made since 30 September 2006. This compares with an estimate of $1,072m projected for the same period
(1 October 2006 to 31 March 2017) in the valuation at 30 September 2006.
After allowing for removal of the beneficial impact of HIH and other commutations ($178m), actual net cashflows have been approximately $31m (3%) below those projected in the
valuation at 30 September 2006.
Gross cashflows in the same period have been $21m (2%) below those projected in the valuation at 30 September 2006
($1,224m vs $1,245m).
KPMG | 86
© 2017 KPMG, an Australian partnership
and a member firm of the KPMG network of independent member firms affiliated with KPMG International Cooperative (“KPMG International”), a Swiss entity. All rights reserved. The KPMG name and logo are registered trademarks or trademarks of
KPMG International. Liability limited by a scheme approved under Professional Standards Legislation.
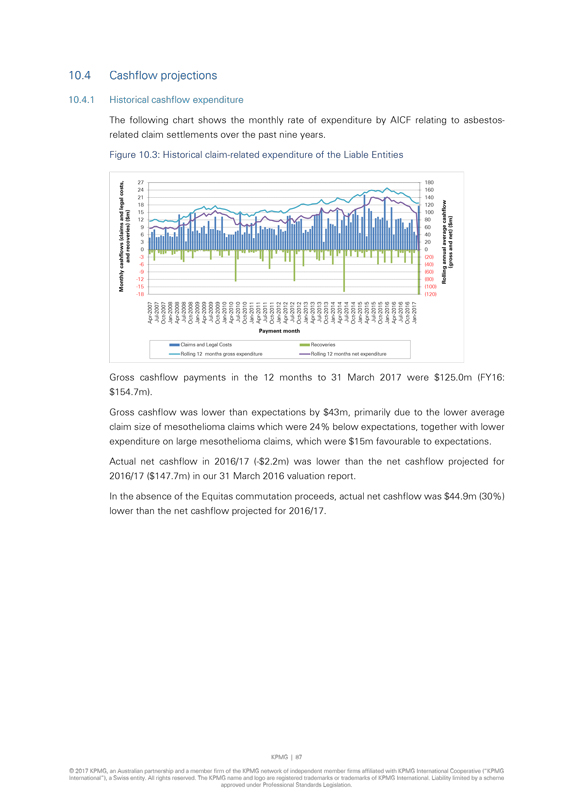
10.4 Cashflow projections
10.4.1 Historical
cashflow expenditure
The following chart shows the monthly rate of expenditure by AICF relating to asbestos-related claim settlements over the past nine years.
Figure 10.3: Historical claim-related expenditure of the Liable Entities
Monthly cashflows (claims and legal costs, and recoveries) ($m)
27
24
21
18
15
12
9
6
3
0
-3
-6
-9
-12
-15
-18
180
160
140
120
100
80
60
40
20
0
(20)
(40)
(60)
(80)
(100)
(120)
Rolling annual average cashflow (gross and net) ($m)
Apr-2007 Jul-2007 Oct-2007 Jan-2008 Apr-2008 Jul-2008 Oct-2008 Jan-2009 Apr-2009 Jul-2009 Oct-2009 Jan-2010 Apr-2010 Jul-2010 Oct-2010 Jan-2011 Apr-2011 Jul-2011 Oct-2011 Jan-2012 Apr-2012 Jul-2012 Oct-2012 Jan-2013 Apr-2013 Jul-2013 Oct-2013 Jan-2014 Apr-2014 Jul-2014 Oct-2014 Jan-2015 Apr-2015 Jul-2015 Oct-2015 Jan-2016 Apr-2016 Jul-2016 Oct-2016 Jan-2017
Payment month
Claims and Legal Costs Recoveries
Rolling 12 months gross expenditure Rolling 12 months net
expenditure
Gross cashflow payments in the 12 months to 31 March 2017 were $125.0m (FY16: $154.7m).
Gross cashflow was lower than expectations by $43m, primarily due to the lower average claim size of mesothelioma claims which were 24% below expectations, together with lower
expenditure on large mesothelioma claims, which were $15m favourable to expectations. Actual net cashflow in 2016/17 (-$2.2m) was lower than the net cashflow projected for 2016/17 ($147.7m) in our 31 March 2016 valuation report.
In the absence of the Equitas commutation proceeds, actual net cashflow was $44.9m (30%) lower than the net cashflow projected for 2016/17.
KPMG | 87
© 2017 KPMG, an Australian partnership and a member firm of the KPMG network of
independent member firms affiliated with KPMG International Cooperative (“KPMG International”), a Swiss entity. All rights reserved. The KPMG name and logo are registered trademarks or trademarks of KPMG International. Liability limited by
a scheme approved under Professional Standards Legislation.
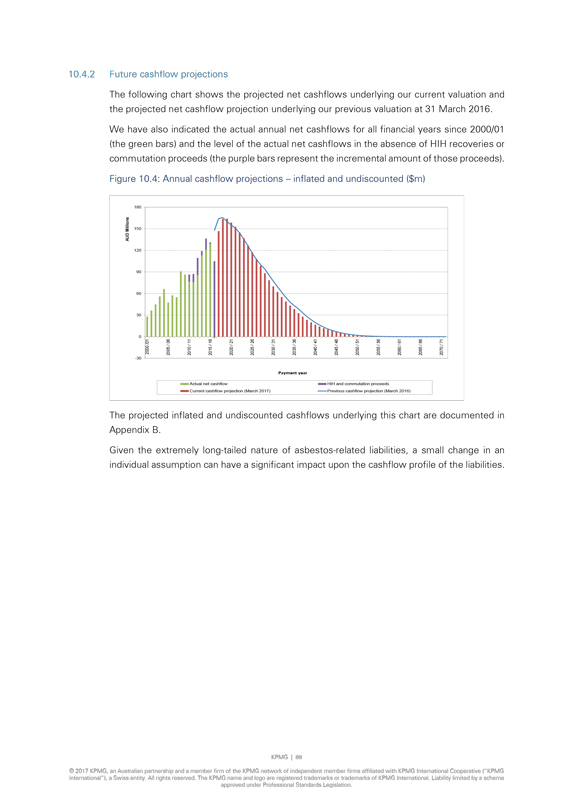
10.4.2 Future cashflow projections
The following
chart shows the projected net cashflows underlying our current valuation and the projected net cashflow projection underlying our previous valuation at 31 March 2016.
We have also indicated the actual annual net cashflows for all financial years since 2000/01 (the green bars) and the level of the actual net cashflows in the absence of HIH
recoveries or commutation proceeds (the purple bars represent the incremental amount of those proceeds).
Figure 10.4: Annual cashflow projections – inflated
and undiscounted ($m)
AUD Millions
180
150
120
90
60
30
0 -30
2000 /01 2005 / 06 2010 / 11 2015 / 16 2020 / 21 2025 / 26 2030 / 31 2035 / 36 2040 / 41 2045 / 46 2050 / 51 2055 / 56 2060 / 61 2065 / 66 2070 / 71
Payment year
Actual net cashflow
HIH and commutation proceeds
Current cashflow projection (March 2017)
Previous cashflow projection (March 2016)
The projected inflated and undiscounted cashflows
underlying this chart are documented in Appendix B.
Given the extremely long-tailed nature of asbestos-related liabilities, a small change in an individual
assumption can have a significant impact upon the cashflow profile of the liabilities.
KPMG | 88
© 2017 KPMG, an Australian partnership and a member firm of the KPMG network of independent member firms affiliated with KPMG International Cooperative (“KPMG
International”), a Swiss entity. All rights reserved. The KPMG name and logo are registered trademarks or trademarks of KPMG International. Liability limited by a scheme approved under Professional Standards Legislation.
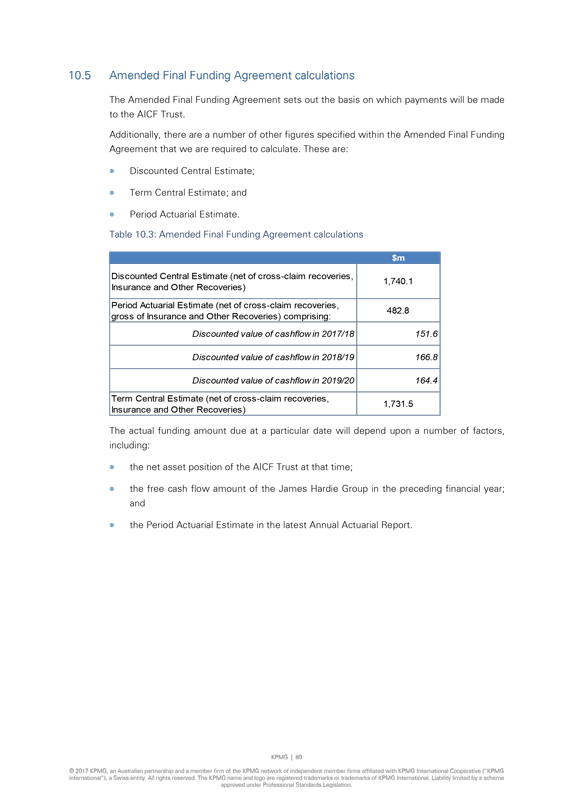
10.5 Amended Final Funding Agreement calculations
The Amended Final Funding Agreement sets out the basis on which payments will be made to the AICF Trust.
Additionally, there are a number of other figures specified within the Amended Final Funding Agreement that we are required to calculate. These are:
• Discounted Central Estimate;
• Term Central Estimate; and
• Period Actuarial Estimate.
Table 10.3: Amended Final Funding Agreement calculations
Discounted Central Estimate (net of cross-claim recoveries, Insurance and Other Recoveries)
Period Actuarial Estimate (net of cross-claim recoveries, gross of Insurance and Other Recoveries) comprising:
Discounted value of cashflow in 2017/18
Discounted value of cashflow in 2018/19
Discounted value of cashflow in 2019/20
Term Central Estimate (net of cross-claim recoveries,
Insurance and Other Recoveries)
$m
1,740.1
482.8
151.6
166.8
164.4
1,731.5
The actual funding amount due at a particular date will depend upon a number of
factors, including:
• the net asset position of the AICF Trust at that time;
• the free cash flow amount of the James Hardie Group in the preceding financial year; and
• the Period Actuarial Estimate in the latest Annual Actuarial Report.
KPMG | 89
© 2017 KPMG, an Australian partnership and a member firm of
the KPMG network of independent member firms affiliated with KPMG International Cooperative (“KPMG International”), a Swiss entity. All rights reserved. The KPMG name and logo are registered trademarks or trademarks of KPMG International.
Liability limited by a scheme approved under Professional Standards Legislation.
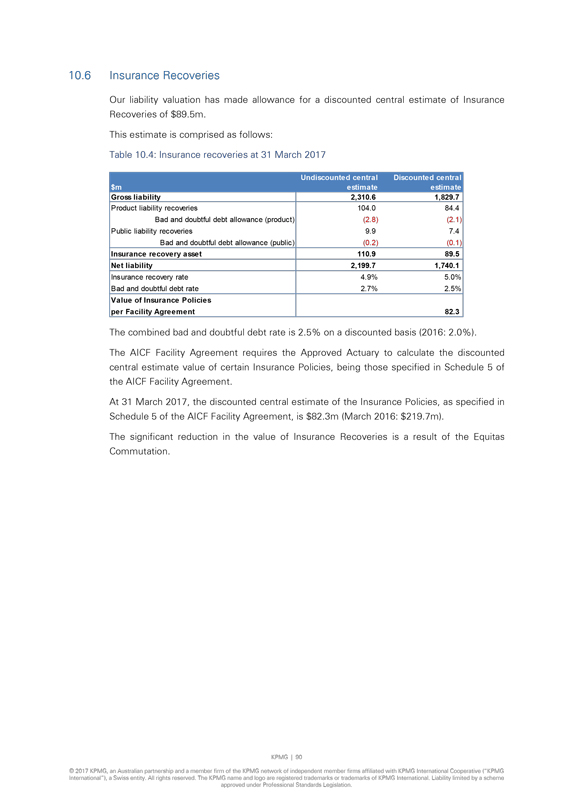
10.6 Insurance Recoveries
Our liability valuation
has made allowance for a discounted central estimate of Insurance Recoveries of $89.5m.
This estimate is comprised as follows:
Table 10.4: Insurance recoveries at 31 March 2017
$m
Gross liability
Product liability recoveries
Bad and doubtful debt allowance (product)
Public liability recoveries
Bad and doubtful debt allowance (public)
Insurance recovery asset
Net liability
Insurance recovery rate
Bad and doubtful debt rate
Value of Insurance Policies per Facility Agreement
Undiscounted central estimate
2,310.6
104.0
(2.8)
9.9
(0.2)
110.9
2,199.7
4.9%
2.7%
Discounted central estimate
1,829.7
84.4
(2.1)
7.4
(0.1)
89.5
1,740.1
5.0%
2.5%
82.3
The combined bad and doubtful debt rate is 2.5% on a discounted basis
(2016: 2.0%). The AICF Facility Agreement requires the Approved Actuary to calculate the discounted central estimate value of certain Insurance Policies, being those specified in Schedule 5 of the AICF Facility Agreement.
At 31 March 2017, the discounted central estimate of the Insurance Policies, as specified in Schedule 5 of the AICF Facility Agreement, is $82.3m (March 2016: $219.7m).
The significant reduction in the value of Insurance Recoveries is a result of the Equitas Commutation.
KPMG | 90
© 2017 KPMG, an Australian partnership and a member firm of the KPMG network of
independent member firms affiliated with KPMG International Cooperative (“KPMG International”), a Swiss entity. All rights reserved. The KPMG name and logo are registered trademarks or trademarks of KPMG International. Liability limited by
a scheme approved under Professional Standards Legislation.
11. Uncertainty
11.1 Overview
There is uncertainty involved in any valuation of the liabilities of an insurance company or a self-insurer. The sources of such uncertainty include, but are not limited to:
• Parameter error – this is the risk that the parameters and assumptions chosen ultimately prove not to be reflective of future experience.
• Model error – this is the risk that the model selected for the valuation of the liabilities ultimately proves not to be adequate for the projection of the liabilities.
• Legal and social developments – this is the risk that the legal environment in which claims are settled changes relative to its current and historical
position thereby causing significantly different awards.
• Future actual rates of inflation being different from that assumed.
• The general economic environment being different from that assumed.
• Potential
sources of exposure – this is the risk that there exist sources of exposure which are as yet unknown or unquantifiable, or for which no liabilities have yet been observed, but which may trigger future claims.
In the case of asbestos liabilities, these uncertainties are exacerbated by the extremely long latency period from exposure to onset of disease and notification of a claim.
Asbestos-related claims often take in excess of 40 years from original exposure to become notified and then settled, compared with an average delay from exposure to settlement of 4-5 years for many other
compensation-type liabilities such as Comprehensive Third-Party injury liabilities or other Workers Compensation liabilities.
Specific forms of uncertainty
relating to asbestos-related disease liabilities include:
• The difficulty in quantifying the extent and pattern of past asbestos exposures and the number and
incidence of the ultimate number of lives that may be affected by asbestos related diseases arising from such past asbestos exposures;
• The timing of the
peak level and future pattern of incidence of claims reporting for mesothelioma, particularly in light of the high level of claims reporting activity in 2008/09, the lower levels of activity through to 2011/12 and the significant increases in claims
reporting in the next three years through to 2014/15;
• The propensity of individuals affected by diseases arising from such exposure to file common law
claims against defendants;
• The extent to which the Liable Entities will be joined in such future common law claims;
KPMG | 91
© 2017 KPMG, an Australian partnership and a member firm of the KPMG network of
independent member firms affiliated with KPMG International Cooperative (“KPMG International”), a Swiss entity. All rights reserved. The KPMG name and logo are registered trademarks or trademarks of KPMG International. Liability limited by
a scheme approved under Professional Standards Legislation.
• The mix of claimants by age, in particular noting the shift towards older claimants and which has had a downwards effect on
average claim sizes in recent years;
• The fact that the ultimate severity of the impact of the disease and the quantum of the claims that will be awarded
will be subject to the outcome of events that have not yet occurred, including:
– medical and epidemiological developments, including those relating to life
expectancy in general;
– court interpretations;
– legislative
changes;
– changes to the form and range of benefits for which compensation may be awarded (“heads of damage”);
– public attitudes to claiming;
– the potential for future procedural reforms in NSW
and other States affecting the legal costs incurred in managing and settling claims;
– potential third-wave exposures; and
– social and economic conditions such as inflation.
11.2 Sensitivity testing
As we have noted above, there are many sources of uncertainty. Actuaries often perform “sensitivity testing” to identify the impact of different assumptions on future
experience, thereby providing an indication of the degree of parameter error risk to which the valuation assessment is exposed.
Sensitivity testing may be
considered as being a mechanism for testing “what will the liabilities be if instead of choosing [x] for assumption [a] we choose [y]?” It is also a mechanism for identifying how the result will change if experience turns out different in
a particular way relative to that which underlies the central estimate expectations. As such, it provides an indication of the level of variability inherent in the valuation.
We have performed some sensitivity tests of the results of our central estimate valuation. We have sensitivity tested the following factors:
• number of claims notified: 10% above and below our central estimate assumption.
•
average claim cost of a non-nil claim: 5% above and below our central estimate assumption.
• nil settlement rate: 2
percentage points above and below our central estimate assumption.
• superimposed inflation: being 0% per annum or 4% per annum over all future years.
• mesothelioma incidence pattern: we have tested two separate alternative outcomes:
– Pattern 1 takes our central estimate pattern through to 2025/26 but assumes an increased rate of joining of the Liable Entities from 2026/27 onwards.
KPMG | 92
© 2017 KPMG, an Australian partnership and a member firm of the KPMG network of
independent member firms affiliated with KPMG International Cooperative (“KPMG International”), a Swiss entity. All rights reserved. The KPMG name and logo are registered trademarks or trademarks of KPMG International. Liability limited by
a scheme approved under Professional Standards Legislation.
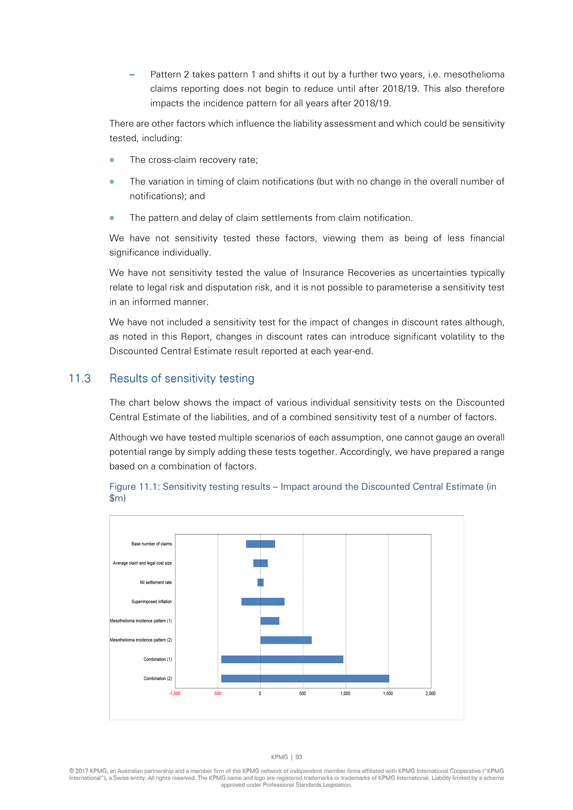
– Pattern 2 takes pattern 1 and shifts it out by a further two years, i.e. mesothelioma claims reporting does not begin to reduce
until after 2018/19. This also therefore impacts the incidence pattern for all years after 2018/19.
There are other factors which influence the liability
assessment and which could be sensitivity tested, including:
• The cross-claim recovery rate;
• The variation in timing of claim notifications (but with no change in the overall number of notifications); and
• The pattern and delay of claim settlements from claim notification.
We have not
sensitivity tested these factors, viewing them as being of less financial significance individually.
We have not sensitivity tested the value of Insurance
Recoveries as uncertainties typically relate to legal risk and disputation risk, and it is not possible to parameterise a sensitivity test in an informed manner.
We have not included a sensitivity test for the impact of changes in discount rates although, as noted in this Report, changes in discount rates can introduce
significant volatility to the Discounted Central Estimate result reported at each year-end.
11.3 Results of sensitivity
testing
The chart below shows the impact of various individual sensitivity tests on the Discounted Central Estimate of the liabilities, and of a combined
sensitivity test of a number of factors. Although we have tested multiple scenarios of each assumption, one cannot gauge an overall potential range by simply adding these tests together. Accordingly, we have prepared a range based on a combination
of factors.
Figure 11.1: Sensitivity testing results – Impact around the Discounted Central Estimate (in $m)
Base number of claims
Average claim and legal cost size
Nil settlement rate
Superimposed inflation
Mesothelioma incidence pattern (1)
Mesothelioma incidence pattern (2)
Combination (1)
Combination (2)
-1,000 -500 0 500 1,000 1,500 2,000
KPMG | 93
© 2017 KPMG, an Australian partnership and a member firm of the KPMG network of independent member firms affiliated with KPMG International Cooperative
(“KPMG International”), a Swiss entity. All rights reserved. The KPMG name and logo are registered trademarks or trademarks of KPMG International. Liability limited by a scheme approved under Professional Standards Legislation.
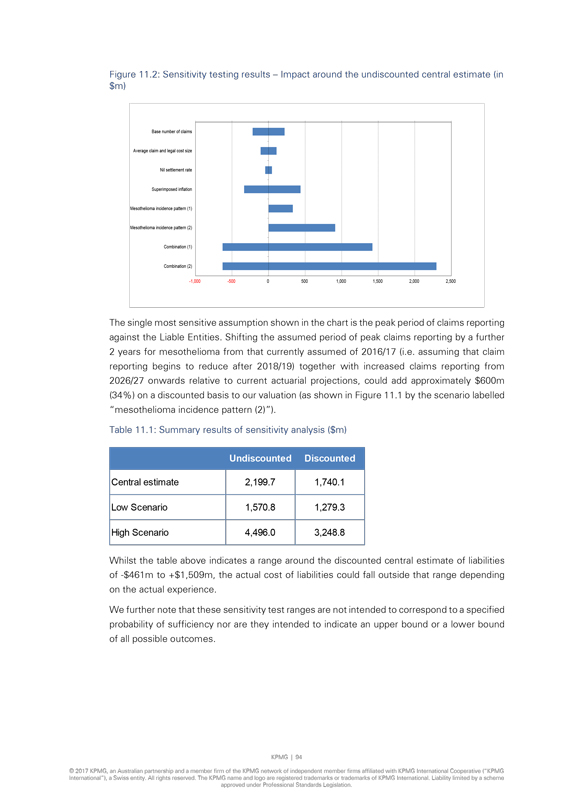
Figure 11.2: Sensitivity testing results – Impact around the undiscounted central estimate (in $m)
Base number of claims
Average claim and legal cost size
Nil settlement rate
Superimposed inflation
Mesothelioma incidence pattern (1)
Mesothelioma incidence pattern (2)
Combination (1)
Combination (2)
-1,000 -500 0 500 1,000 1,500 2,000 2,500
The single
most sensitive assumption shown in the chart is the peak period of claims reporting against the Liable Entities. Shifting the assumed period of peak claims reporting by a further 2 years for mesothelioma from that currently assumed of 2016/17 (i.e.
assuming that claim reporting begins to reduce after 2018/19) together with increased claims reporting from 2026/27 onwards relative to current actuarial projections, could add approximately $600m (34%) on a discounted basis to our valuation (as
shown in Figure 11.1 by the scenario labelled “mesothelioma incidence pattern (2)”).
Table 11.1: Summary results of sensitivity analysis ($m)
Undiscounted
Discounted
Central estimate
2,199.7
1,740.1
Low Scenario
1,570.8
1,279.3
High Scenario
4,496.0
3,248.8
Whilst the table above indicates a range around the discounted central estimate of
liabilities of -$461m to +$1,509m, the actual cost of liabilities could fall outside that range depending on the actual experience.
We further note that these
sensitivity test ranges are not intended to correspond to a specified probability of sufficiency nor are they intended to indicate an upper bound or a lower bound of all possible outcomes.
KPMG | 94
© 2017 KPMG, an Australian partnership and a member firm of the KPMG network of
independent member firms affiliated with KPMG International Cooperative (“KPMG International”), a Swiss entity. All rights reserved. The KPMG name and logo are registered trademarks or trademarks of KPMG International. Liability limited by
a scheme approved under Professional Standards Legislation.
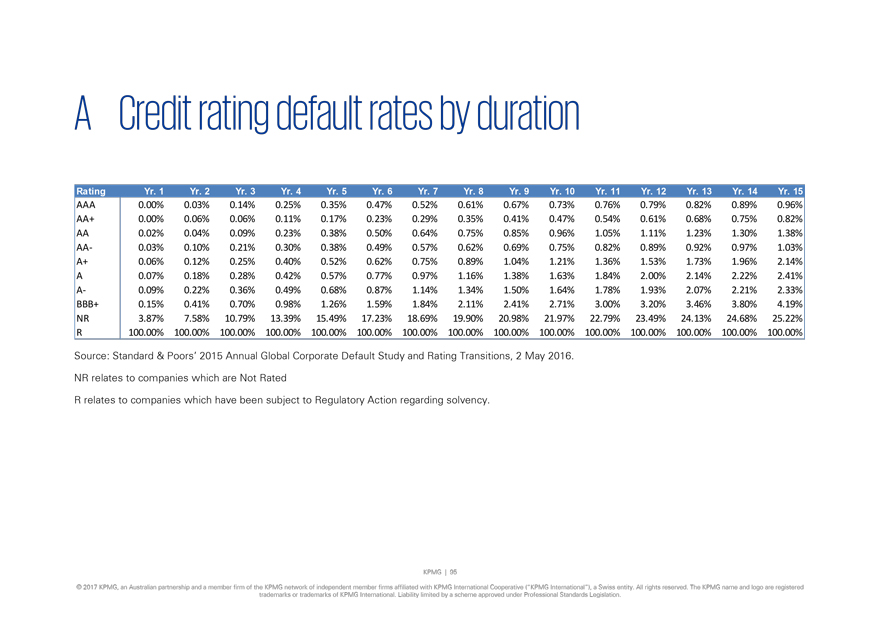
A Credit rating default rates by duration
Rating Yr. 1 Yr. 2 Yr. 3 Yr. 4 Yr. 5 Yr. 6 Yr. 7 Yr. 8 Yr. 9 Yr. 10 Yr. 11 Yr. 12 Yr. 13 Yr. 14 Yr. 15
AAA 0.00% 0.03% 0.14% 0.25% 0.35% 0.47% 0.52% 0.61% 0.67% 0.73% 0.76% 0.79% 0.82% 0.89% 0.96%
AA+ 0.00% 0.06% 0.06% 0.11% 0.17% 0.23% 0.29% 0.35% 0.41% 0.47% 0.54% 0.61% 0.68% 0.75% 0.82%
AA 0.02% 0.04% 0.09% 0.23% 0.38% 0.50% 0.64% 0.75% 0.85% 0.96% 1.05% 1.11% 1.23% 1.30% 1.38%
AA- 0.03% 0.10% 0.21% 0.30% 0.38% 0.49% 0.57% 0.62% 0.69% 0.75% 0.82% 0.89% 0.92% 0.97% 1.03%
A+ 0.06% 0.12% 0.25% 0.40% 0.52% 0.62% 0.75% 0.89% 1.04% 1.21% 1.36% 1.53% 1.73% 1.96% 2.14%
A
0.07% 0.18% 0.28% 0.42% 0.57% 0.77% 0.97% 1.16% 1.38% 1.63% 1.84% 2.00% 2.14% 2.22% 2.41%
A- 0.09% 0.22% 0.36% 0.49% 0.68% 0.87% 1.14% 1.34% 1.50% 1.64% 1.78%
1.93% 2.07% 2.21% 2.33%
BBB+ 0.15% 0.41% 0.70% 0.98% 1.26% 1.59% 1.84% 2.11% 2.41% 2.71% 3.00% 3.20% 3.46% 3.80% 4.19%
NR 3.87% 7.58% 10.79% 13.39% 15.49% 17.23% 18.69% 19.90% 20.98% 21.97% 22.79% 23.49% 24.13% 24.68% 25.22%
R 100.00% 100.00% 100.00% 100.00% 100.00% 100.00% 100.00% 100.00% 100.00% 100.00% 100.00% 100.00% 100.00% 100.00% 100.00%
Source: Standard & Poors’ 2015 Annual Global Corporate Default Study and Rating Transitions, 2 May 2016.
NR relates to companies which are Not Rated
R relates to companies which have been subject to
Regulatory Action regarding solvency.
KPMG | 95
© 2017 KPMG, an
Australian partnership and a member firm of the KPMG network of independent member firms affiliated with KPMG International Cooperative (“KPMG International”), a Swiss entity. All rights reserved. The KPMG name and logo are registered
trademarks or trademarks of KPMG International. Liability limited by a scheme approved under Professional Standards Legislation.
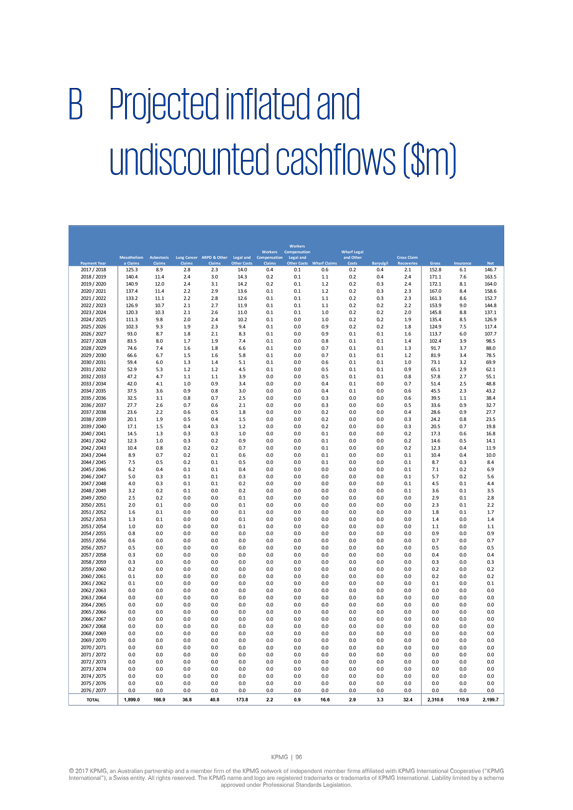
B Projected inflated and undiscounted cashflows ($m)
Payment Year
Mesotheliom a Claims
Asbestosis Claims
Lung Cancer Claims
ARPD & Other Claims
Legal and Other Costs
Workers Compensation Claims
Workers Compensation Legal and Other Costs
Wharf Claims
Wharf Legal and Other Costs
Baryulgil
Cross Claim Recoveries
Gross Insurance
Net
2017 / 2018 125.3 8.9 2.8 2.3 14.0 0.4 0.1 0.6 0.2 0.4 2.1 152.8 6.1 146.7
2018 / 2019 140.4
11.4 2.4 3.0 14.3 0.2 0.1 1.1 0.2 0.4 2.4 171.1 7.6 163.5
2019 / 2020 140.9 12.0 2.4 3.1 14.2 0.2 0.1 1.2 0.2 0.3 2.4 172.1 8.1 164.0
2020 / 2021 137.4 11.4 2.2 2.9 13.6 0.1 0.1 1.2 0.2 0.3 2.3 167.0 8.4 158.6
2021 / 2022 133.2
11.1 2.2 2.8 12.6 0.1 0.1 1.1 0.2 0.3 2.3 161.3 8.6 152.7
2022 / 2023 126.9 10.7 2.1 2.7 11.9 0.1 0.1 1.1 0.2 0.2 2.2 153.9 9.0 144.8
2023 / 2024 120.3 10.3 2.1 2.6 11.0 0.1 0.1 1.0 0.2 0.2 2.0 145.8 8.8 137.1
2024 / 2025 111.3
9.8 2.0 2.4 10.2 0.1 0.0 1.0 0.2 0.2 1.9 135.4 8.5 126.9
2025 / 2026 102.3 9.3 1.9 2.3 9.4 0.1 0.0 0.9 0.2 0.2 1.8 124.9 7.5 117.4
2026 / 2027 93.0 8.7 1.8 2.1 8.3 0.1 0.0 0.9 0.1 0.1 1.6 113.7 6.0 107.7
2027 / 2028 83.5 8.0
1.7 1.9 7.4 0.1 0.0 0.8 0.1 0.1 1.4 102.4 3.9 98.5
2028 / 2029 74.6 7.4 1.6 1.8 6.6 0.1 0.0 0.7 0.1 0.1 1.3 91.7 3.7 88.0
2029 / 2030 66.6 6.7 1.5 1.6 5.8 0.1 0.0 0.7 0.1 0.1 1.2 81.9 3.4 78.5
2030 / 2031 59.4 6.0
1.3 1.4 5.1 0.1 0.0 0.6 0.1 0.1 1.0 73.1 3.2 69.9
2031 / 2032 52.9 5.3 1.2 1.2 4.5 0.1 0.0 0.5 0.1 0.1 0.9 65.1 2.9 62.1
2032 / 2033 47.2 4.7 1.1 1.1 3.9 0.0 0.0 0.5 0.1 0.1 0.8 57.8 2.7 55.1
2033 / 2034 42.0 4.1
1.0 0.9 3.4 0.0 0.0 0.4 0.1 0.0 0.7 51.4 2.5 48.8
2034 / 2035 37.5 3.6 0.9 0.8 3.0 0.0 0.0 0.4 0.1 0.0 0.6 45.5 2.3 43.2
2035 / 2036 32.5 3.1 0.8 0.7 2.5 0.0 0.0 0.3 0.0 0.0 0.6 39.5 1.1 38.4
2036 / 2037 27.7 2.6
0.7 0.6 2.1 0.0 0.0 0.3 0.0 0.0 0.5 33.6 0.9 32.7
2037 / 2038 23.6 2.2 0.6 0.5 1.8 0.0 0.0 0.2 0.0 0.0 0.4 28.6 0.9 27.7
2038 / 2039 20.1 1.9 0.5 0.4 1.5 0.0 0.0 0.2 0.0 0.0 0.3 24.2 0.8 23.5
2039 / 2040 17.1 1.5
0.4 0.3 1.2 0.0 0.0 0.2 0.0 0.0 0.3 20.5 0.7 19.8
2040 / 2041 14.5 1.3 0.3 0.3 1.0 0.0 0.0 0.1 0.0 0.0 0.2 17.3 0.6 16.8
2041 / 2042 12.3 1.0 0.3 0.2 0.9 0.0 0.0 0.1 0.0 0.0 0.2 14.6 0.5 14.1
2042 / 2043 10.4 0.8
0.2 0.2 0.7 0.0 0.0 0.1 0.0 0.0 0.2 12.3 0.4 11.9
2043 / 2044 8.9 0.7 0.2 0.1 0.6 0.0 0.0 0.1 0.0 0.0 0.1 10.4 0.4 10.0
2044 / 2045 7.5 0.5 0.2 0.1 0.5 0.0 0.0 0.1 0.0 0.0 0.1 8.7 0.3 8.4
2045 / 2046 6.2 0.4 0.1
0.1 0.4 0.0 0.0 0.0 0.0 0.0 0.1 7.1 0.2 6.9
2046 / 2047 5.0 0.3 0.1 0.1 0.3 0.0 0.0 0.0 0.0 0.0 0.1 5.7 0.2 5.6
2047 / 2048 4.0 0.3 0.1 0.1 0.2 0.0 0.0 0.0 0.0 0.0 0.1 4.5 0.1 4.4
2048 / 2049 3.2 0.2 0.1
0.0 0.2 0.0 0.0 0.0 0.0 0.0 0.1 3.6 0.1 3.5
2049 / 2050 2.5 0.2 0.0 0.0 0.1 0.0 0.0 0.0 0.0 0.0 0.0 2.9 0.1 2.8
2050 / 2051 2.0 0.1 0.0 0.0 0.1 0.0 0.0 0.0 0.0 0.0 0.0 2.3 0.1 2.2
2051 / 2052 1.6 0.1 0.0
0.0 0.1 0.0 0.0 0.0 0.0 0.0 0.0 1.8 0.1 1.7
2052 / 2053 1.3 0.1 0.0 0.0 0.1 0.0 0.0 0.0 0.0 0.0 0.0 1.4 0.0 1.4
2053 / 2054 1.0 0.0 0.0 0.0 0.1 0.0 0.0 0.0 0.0 0.0 0.0 1.1 0.0 1.1
2054 / 2055 0.8 0.0 0.0
0.0 0.0 0.0 0.0 0.0 0.0 0.0 0.0 0.9 0.0 0.9
2055 / 2056 0.6 0.0 0.0 0.0 0.0 0.0 0.0 0.0 0.0 0.0 0.0 0.7 0.0 0.7
2056 / 2057 0.5 0.0 0.0 0.0 0.0 0.0 0.0 0.0 0.0 0.0 0.0 0.5 0.0 0.5
2057 / 2058 0.3 0.0 0.0
0.0 0.0 0.0 0.0 0.0 0.0 0.0 0.0 0.4 0.0 0.4
2058 / 2059 0.3 0.0 0.0 0.0 0.0 0.0 0.0 0.0 0.0 0.0 0.0 0.3 0.0 0.3
2059 / 2060 0.2 0.0 0.0 0.0 0.0 0.0 0.0 0.0 0.0 0.0 0.0 0.2 0.0 0.2
2060 / 2061 0.1 0.0 0.0
0.0 0.0 0.0 0.0 0.0 0.0 0.0 0.0 0.2 0.0 0.2
2061 / 2062 0.1 0.0 0.0 0.0 0.0 0.0 0.0 0.0 0.0 0.0 0.0 0.1 0.0 0.1
2062 / 2063 0.0 0.0 0.0 0.0 0.0 0.0 0.0 0.0 0.0 0.0 0.0 0.0 0.0 0.0
2063 / 2064 0.0 0.0 0.0
0.0 0.0 0.0 0.0 0.0 0.0 0.0 0.0 0.0 0.0 0.0
2064 / 2065 0.0 0.0 0.0 0.0 0.0 0.0 0.0 0.0 0.0 0.0 0.0 0.0 0.0 0.0
2065 / 2066 0.0 0.0 0.0 0.0 0.0 0.0 0.0 0.0 0.0 0.0 0.0 0.0 0.0 0.0
2066 / 2067 0.0 0.0 0.0
0.0 0.0 0.0 0.0 0.0 0.0 0.0 0.0 0.0 0.0 0.0
2067 / 2068 0.0 0.0 0.0 0.0 0.0 0.0 0.0 0.0 0.0 0.0 0.0 0.0 0.0 0.0
2068 / 2069 0.0 0.0 0.0 0.0 0.0 0.0 0.0 0.0 0.0 0.0 0.0 0.0 0.0 0.0
2069 / 2070 0.0 0.0 0.0
0.0 0.0 0.0 0.0 0.0 0.0 0.0 0.0 0.0 0.0 0.0
2070 / 2071 0.0 0.0 0.0 0.0 0.0 0.0 0.0 0.0 0.0 0.0 0.0 0.0 0.0 0.0
2071 / 2072 0.0 0.0 0.0 0.0 0.0 0.0 0.0 0.0 0.0 0.0 0.0 0.0 0.0 0.0
2072 / 2073 0.0 0.0 0.0
0.0 0.0 0.0 0.0 0.0 0.0 0.0 0.0 0.0 0.0 0.0
2073 / 2074 0.0 0.0 0.0 0.0 0.0 0.0 0.0 0.0 0.0 0.0 0.0 0.0 0.0 0.0
2074 / 2075 0.0 0.0 0.0 0.0 0.0 0.0 0.0 0.0 0.0 0.0 0.0 0.0 0.0 0.0
2075 / 2076 0.0 0.0 0.0
0.0 0.0 0.0 0.0 0.0 0.0 0.0 0.0 0.0 0.0 0.0
2076 / 2077 0.0 0.0 0.0 0.0 0.0 0.0 0.0 0.0 0.0 0.0 0.0 0.0 0.0 0.0
TOTAL 1,899.0 166.9 36.8 40.8 173.8 2.2 0.9 16.6 2.9 3.3 32.4 2,310.6 110.9 2,199.7
KPMG | 96
© 2017 KPMG, an Australian partnership and a member firm of the KPMG network of independent member firms affiliated with KPMG International Cooperative
(“KPMG International”), a Swiss entity. All rights reserved. The KPMG name and logo are registered trademarks or trademarks of KPMG International. Liability limited by a scheme approved under Professional Standards Legislation.
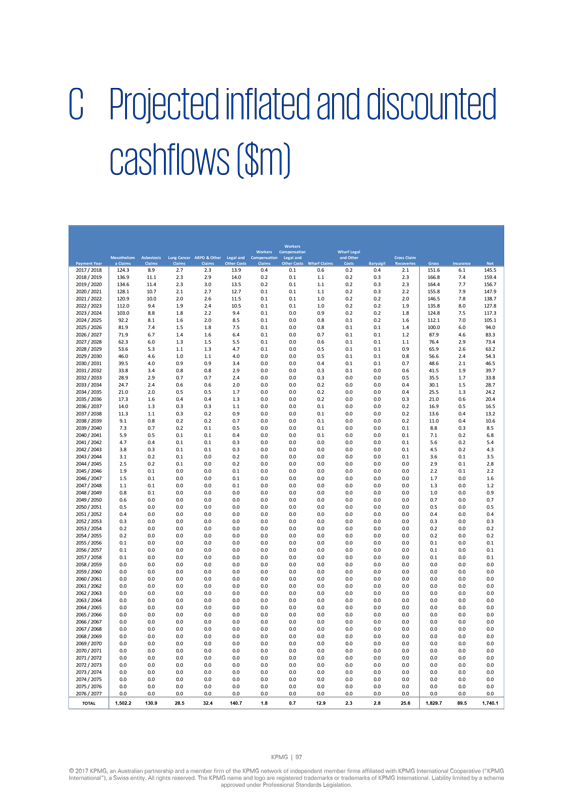
C Projected inflated and discounted cashflows ($m)
Payment Year
Mesotheliom a Claims
Asbestosis Claims
Lung Cancer Claims
ARPD & Other Claims
Legal and Other Costs
Workers Compensation Claims
Workers Compensation Legal and Other Costs
Wharf Claims
Wharf Legal and Other Costs
Baryulgil
Cross Claim Recoveries
Gross
Insurance
Net
2017 / 2018 124.3 8.9 2.7 2.3 13.9 0.4 0.1 0.6 0.2 0.4 2.1 151.6 6.1 145.5
2018 / 2019 136.9 11.1 2.3 2.9 14.0 0.2 0.1 1.1 0.2 0.3 2.3 166.8 7.4 159.4
2019 / 2020 134.6
11.4 2.3 3.0 13.5 0.2 0.1 1.1 0.2 0.3 2.3 164.4 7.7 156.7
2020 / 2021 128.1 10.7 2.1 2.7 12.7 0.1 0.1 1.1 0.2 0.3 2.2 155.8 7.9 147.9
2021 / 2022 120.9 10.0 2.0 2.6 11.5 0.1 0.1 1.0 0.2 0.2 2.0 146.5 7.8 138.7
2022 / 2023 112.0
9.4 1.9 2.4 10.5 0.1 0.1 1.0 0.2 0.2 1.9 135.8 8.0 127.8
2023 / 2024 103.0 8.8 1.8 2.2 9.4 0.1 0.0 0.9 0.2 0.2 1.8 124.8 7.5 117.3
2024 / 2025 92.2 8.1 1.6 2.0 8.5 0.1 0.0 0.8 0.1 0.2 1.6 112.1 7.0 105.1
2025 / 2026 81.9 7.4
1.5 1.8 7.5 0.1 0.0 0.8 0.1 0.1 1.4 100.0 6.0 94.0
2026 / 2027 71.9 6.7 1.4 1.6 6.4 0.1 0.0 0.7 0.1 0.1 1.2 87.9 4.6 83.3
2027 / 2028 62.3 6.0 1.3 1.5 5.5 0.1 0.0 0.6 0.1 0.1 1.1 76.4 2.9 73.4
2028 / 2029 53.6 5.3
1.1 1.3 4.7 0.1 0.0 0.5 0.1 0.1 0.9 65.9 2.6 63.2
2029 / 2030 46.0 4.6 1.0 1.1 4.0 0.0 0.0 0.5 0.1 0.1 0.8 56.6 2.4 54.3
2030 / 2031 39.5 4.0 0.9 0.9 3.4 0.0 0.0 0.4 0.1 0.1 0.7 48.6 2.1 46.5
2031 / 2032 33.8 3.4
0.8 0.8 2.9 0.0 0.0 0.3 0.1 0.0 0.6 41.5 1.9 39.7
2032 / 2033 28.9 2.9 0.7 0.7 2.4 0.0 0.0 0.3 0.0 0.0 0.5 35.5 1.7 33.8
2033 / 2034 24.7 2.4 0.6 0.6 2.0 0.0 0.0 0.2 0.0 0.0 0.4 30.1 1.5 28.7
2034 / 2035 21.0 2.0
0.5 0.5 1.7 0.0 0.0 0.2 0.0 0.0 0.4 25.5 1.3 24.2
2035 / 2036 17.3 1.6 0.4 0.4 1.3 0.0 0.0 0.2 0.0 0.0 0.3 21.0 0.6 20.4
2036 / 2037 14.0 1.3 0.3 0.3 1.1 0.0 0.0 0.1 0.0 0.0 0.2 16.9 0.5 16.5
2037 / 2038 11.3 1.1
0.3 0.2 0.9 0.0 0.0 0.1 0.0 0.0 0.2 13.6 0.4 13.2
2038 / 2039 9.1 0.8 0.2 0.2 0.7 0.0 0.0 0.1 0.0 0.0 0.2 11.0 0.4 10.6
2039 / 2040 7.3 0.7 0.2 0.1 0.5 0.0 0.0 0.1 0.0 0.0 0.1 8.8 0.3 8.5
2040 / 2041 5.9 0.5 0.1
0.1 0.4 0.0 0.0 0.1 0.0 0.0 0.1 7.1 0.2 6.8
2041 / 2042 4.7 0.4 0.1 0.1 0.3 0.0 0.0 0.0 0.0 0.0 0.1 5.6 0.2 5.4
2042 / 2043 3.8 0.3 0.1 0.1 0.3 0.0 0.0 0.0 0.0 0.0 0.1 4.5 0.2 4.3
2043 / 2044 3.1 0.2 0.1
0.0 0.2 0.0 0.0 0.0 0.0 0.0 0.1 3.6 0.1 3.5
2044 / 2045 2.5 0.2 0.1 0.0 0.2 0.0 0.0 0.0 0.0 0.0 0.0 2.9 0.1 2.8
2045 / 2046 1.9 0.1 0.0 0.0 0.1 0.0 0.0 0.0 0.0 0.0 0.0 2.2 0.1 2.2
2046 / 2047 1.5 0.1 0.0
0.0 0.1 0.0 0.0 0.0 0.0 0.0 0.0 1.7 0.0 1.6
2047 / 2048 1.1 0.1 0.0 0.0 0.1 0.0 0.0 0.0 0.0 0.0 0.0 1.3 0.0 1.2
2048 / 2049 0.8 0.1 0.0 0.0 0.0 0.0 0.0 0.0 0.0 0.0 0.0 1.0 0.0 0.9
2049 / 2050 0.6 0.0 0.0
0.0 0.0 0.0 0.0 0.0 0.0 0.0 0.0 0.7 0.0 0.7
2050 / 2051 0.5 0.0 0.0 0.0 0.0 0.0 0.0 0.0 0.0 0.0 0.0 0.5 0.0 0.5
2051 / 2052 0.4 0.0 0.0 0.0 0.0 0.0 0.0 0.0 0.0 0.0 0.0 0.4 0.0 0.4
2052 / 2053 0.3 0.0 0.0
0.0 0.0 0.0 0.0 0.0 0.0 0.0 0.0 0.3 0.0 0.3
2053 / 2054 0.2 0.0 0.0 0.0 0.0 0.0 0.0 0.0 0.0 0.0 0.0 0.2 0.0 0.2
2054 / 2055 0.2 0.0 0.0 0.0 0.0 0.0 0.0 0.0 0.0 0.0 0.0 0.2 0.0 0.2
2055 / 2056 0.1 0.0 0.0
0.0 0.0 0.0 0.0 0.0 0.0 0.0 0.0 0.1 0.0 0.1
2056 / 2057 0.1 0.0 0.0 0.0 0.0 0.0 0.0 0.0 0.0 0.0 0.0 0.1 0.0 0.1
2057 / 2058 0.1 0.0 0.0 0.0 0.0 0.0 0.0 0.0 0.0 0.0 0.0 0.1 0.0 0.1
2058 / 2059 0.0 0.0 0.0
0.0 0.0 0.0 0.0 0.0 0.0 0.0 0.0 0.0 0.0 0.0
2059 / 2060 0.0 0.0 0.0 0.0 0.0 0.0 0.0 0.0 0.0 0.0 0.0 0.0 0.0 0.0
2060 / 2061 0.0 0.0 0.0 0.0 0.0 0.0 0.0 0.0 0.0 0.0 0.0 0.0 0.0 0.0
2061 / 2062 0.0 0.0 0.0
0.0 0.0 0.0 0.0 0.0 0.0 0.0 0.0 0.0 0.0 0.0
2062 / 2063 0.0 0.0 0.0 0.0 0.0 0.0 0.0 0.0 0.0 0.0 0.0 0.0 0.0 0.0
2063 / 2064 0.0 0.0 0.0 0.0 0.0 0.0 0.0 0.0 0.0 0.0 0.0 0.0 0.0 0.0
2064 / 2065 0.0 0.0 0.0
0.0 0.0 0.0 0.0 0.0 0.0 0.0 0.0 0.0 0.0 0.0
2065 / 2066 0.0 0.0 0.0 0.0 0.0 0.0 0.0 0.0 0.0 0.0 0.0 0.0 0.0 0.0
2066 / 2067 0.0 0.0 0.0 0.0 0.0 0.0 0.0 0.0 0.0 0.0 0.0 0.0 0.0 0.0
2067 / 2068 0.0 0.0 0.0
0.0 0.0 0.0 0.0 0.0 0.0 0.0 0.0 0.0 0.0 0.0
2068 / 2069 0.0 0.0 0.0 0.0 0.0 0.0 0.0 0.0 0.0 0.0 0.0 0.0 0.0 0.0
2069 / 2070 0.0 0.0 0.0 0.0 0.0 0.0 0.0 0.0 0.0 0.0 0.0 0.0 0.0 0.0
2070 / 2071 0.0 0.0 0.0
0.0 0.0 0.0 0.0 0.0 0.0 0.0 0.0 0.0 0.0 0.0
2071 / 2072 0.0 0.0 0.0 0.0 0.0 0.0 0.0 0.0 0.0 0.0 0.0 0.0 0.0 0.0
2072 / 2073 0.0 0.0 0.0 0.0 0.0 0.0 0.0 0.0 0.0 0.0 0.0 0.0 0.0 0.0
2073 / 2074 0.0 0.0 0.0
0.0 0.0 0.0 0.0 0.0 0.0 0.0 0.0 0.0 0.0 0.0
2074 / 2075 0.0 0.0 0.0 0.0 0.0 0.0 0.0 0.0 0.0 0.0 0.0 0.0 0.0 0.0
2075 / 2076 0.0 0.0 0.0 0.0 0.0 0.0 0.0 0.0 0.0 0.0 0.0 0.0 0.0 0.0
2076 / 2077 0.0 0.0 0.0
0.0 0.0 0.0 0.0 0.0 0.0 0.0 0.0 0.0 0.0 0.0
TOTAL 1,502.2 130.9 28.5 32.4 140.7 1.8 0.7 12.9 2.3 2.8 25.6 1,829.7 89.5 1,740.1
KPMG | 97
© 2017 KPMG, an Australian partnership and a member firm of the KPMG network of
independent member firms affiliated with KPMG International Cooperative (“KPMG International”), a Swiss entity. All rights reserved. The KPMG name and logo are registered trademarks or trademarks of KPMG International. Liability limited by
a scheme approved under Professional Standards Legislation.
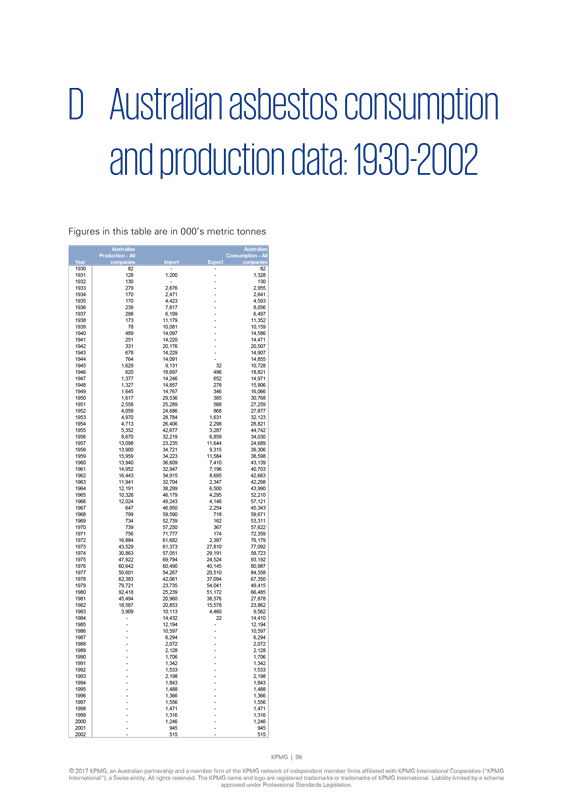
D Australian asbestos consumption and production data: 1930-2002
Figures in this table are in 000’s metric tonnes
Year
Australian Production-All companies
Import
Export
Australian Consumption-All companies
1930 82 - - 82
1931 128 1,200 - 1,328
1932 130 - - 130
1933 279 2,676 - 2,955
1934 170 2,471 - 2,641
1935 170 4,423 - 4,593
1936 239 7,817 - 8,056
1937 298 6,199 - 6,497
1938 173 11,179 - 11,352
1939 78 10,081 - 10,159
1940 489 14,097 - 14,586
1941 251 14,220 - 14,471
1942 331 20,176 - 20,507
1943 678 14,229 - 14,907
1944 764 14,091 - 14,855
1945 1,629 9,131 32 10,728
1946 620 18,697 496 18,821
1947 1,377 14,246 652 14,971
1948 1,327 14,857 278 15,906
1949 1,645 14,767 346 16,066
1950 1,617 29,536 385 30,768
1951 2,558 25,289 588 27,259
1952 4,059 24,686 868 27,877
1953 4,970 28,784 1,631 32,123
1954 4,713 26,406 2,298 28,821
1955 5,352 42,677 3,287 44,742
1956 8,670 32,219 6,859 34,030
1957 13,098 23,235 11,644 24,689
1958 13,900 34,721 9,315 39,306
1959 15,959 34,223 11,584 38,598
1960 13,940 36,609 7,410 43,139
1961 14,952 32,947 7,196 40,703
1962 16,443 34,915 8,695 42,663
1963 11,941 32,704 2,347 42,298
1964 12,191 38,299 6,500 43,990
1965 10,326 46,179 4,295 52,210
1966 12,024 49,243 4,146 57,121
1967 647 46,950 2,254 45,343
1968 799 59,590 718 59,671
1969 734 52,739 162 53,311
1970 739 57,250 367 57,622
1971 756 71,777 174 72,359
1972 16,884 61,682 2,387 76,179
1973 43,529 61,373 27,810 77,092
1974 30,863 57,051 29,191 58,723
1975 47,922 69,794 24,524 93,192
1976 60,642 60,490 40,145 80,987
1977 50,601 54,267 20,510 84,358
1978 62,383 42,061 37,094 67,350
1979 79,721 23,735 54,041 49,415
1980 92,418 25,239 51,172 66,485
1981 45,494 20,960 38,576 27,878
1982 18,587 20,853 15,578 23,862
1983 3,909 10,113 4,460 9,562
1984 - 14,432 22 14,410
1985 - 12,194 - 12,194
1986 - 10,597 - 10,597
1987 - 6,294 - 6,294
1988 - 2,072 - 2,072
1989 - 2,128 - 2,128
1990 - 1,706 - 1,706
1991 - 1,342 - 1,342
1992 - 1,533 - 1,533
1993 - 2,198 - 2,198
1994 - 1,843 - 1,843
1995 - 1,488 - 1,488
1996 - 1,366 - 1,366
1997 - 1,556 - 1,556
1998 - 1,471 - 1,471
1999 - 1,316 - 1,316
2000 - 1,246 - 1,246
2001 - 945 - 945
2002 - 515 - 515
KPMG | 98
© 2017 KPMG, an Australian partnership and a member firm of the KPMG network of independent member firms affiliated with KPMG International Cooperative (“KPMG
International”), a Swiss entity. All rights reserved. The KPMG name and logo are registered trademarks or trademarks of KPMG International. Liability limited by a scheme approved under Professional Standards Legislation.
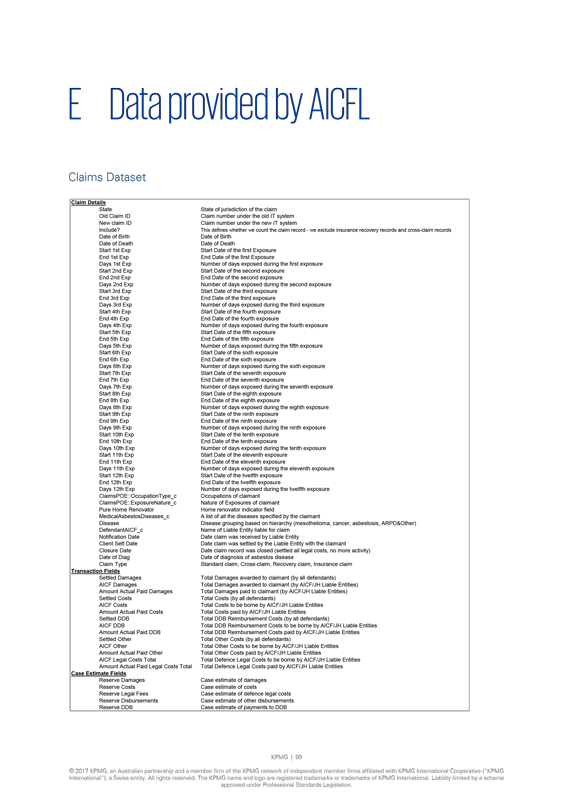
E Data provided by AICFL
Claims Dataset
Claim Details
State State of jurisdiction of the claim
Old Claim ID Claim number under the old IT system
New claim ID Claim number under the new IT
system
Include? This defines whether we count the claim record - we exclude insurance recovery records and cross-claim records
Date of Birth Date of Birth
Date of Death Date of Death
Start 1st Exp Start Date of the first Exposure
End 1st Exp End Date of the first Exposure
Days 1st Exp Number of days exposed during the first exposure
Start 2nd Exp
Start Date of the second exposure
End 2nd Exp End Date of the second exposure
Days 2nd Exp Number of days exposed during the second exposure
Start 3rd Exp
Start Date of the third exposure
End 3rd Exp End Date of the third exposure
Days 3rd Exp Number of days exposed during the third exposure
Start 4th Exp
Start Date of the fourth exposure
End 4th Exp End Date of the fourth exposure
Days 4th Exp Number of days exposed during the fourth exposure
Start 5th Exp
Start Date of the fifth exposure
End 5th Exp End Date of the fifth exposure
Days 5th Exp Number of days exposed during the fifth exposure
Start 6th Exp
Start Date of the sixth exposure
End 6th Exp End Date of the sixth exposure
Days 6th Exp Number of days exposed during the sixth exposure
Start 7th Exp
Start Date of the seventh exposure
End 7th Exp End Date of the seventh exposure
Days 7th Exp Number of days exposed during the seventh exposure
Start 8th Exp
Start Date of the eighth exposure
End 8th Exp End Date of the eighth exposure
Days 8th Exp Number of days exposed during the eighth exposure
Start 9th Exp
Start Date of the ninth exposure
End 9th Exp End Date of the ninth exposure
Days 9th Exp Number of days exposed during the ninth exposure
Start 10th Exp
Start Date of the tenth exposure
End 10th Exp End Date of the tenth exposure
Days 10th Exp Number of days exposed during the tenth exposure
Start 11th Exp
Start Date of the eleventh exposure
End 11th Exp End Date of the eleventh exposure
Days 11th Exp Number of days exposed during the eleventh exposure
Start 12th Exp Start Date of
the twelfth exposure
End 12th Exp End Date of the twelfth exposure
Days 12th
Exp Number of days exposed during the twelfth exposure
ClaimsPOE::OccupationType_c Occupations of claimant
ClaimsPOE::ExposureNature_c Nature of Exposures of claimant
Pure Home Renovator Home renovator
indicator field
MedicalAsbestosDiseases_c A list of all the diseases specified by the claimant
Disease Disease grouping based on hierarchy (mesothelioma, cancer, asbestosis, ARPD&Other)
DefendantAICF_c Name of Liable Entity liable for claim
Notification Date Date
claim was received by Liable Entity
Client Sett Date Date claim was settled by the Liable Entity with the claimant
Closure Date Date claim record was closed (settled all legal costs, no more activity)
Date of
Diag Date of diagnosis of asbestos disease
Claim Type Standard claim, Cross-claim, Recovery claim, Insurance claim
Transaction Fields
Settled Damages Total Damages awarded to claimant (by all defendants)
AICF Damages Total Damages awarded to claimant (by AICF/JH Liable Entities)
Amount Actual Paid Damages Total Damages paid to claimant (by AICF/JH Liable Entities)
Settled Costs Total Costs (by all defendants)
AICF Costs Total Costs to be borne by AICF/JH
Liable Entities
Amount Actual Paid Costs Total Costs paid by AICF/JH Liable Entities
Settled DDB Total DDB Reimbursement Costs (by all defendants)
AICF DDB Total DDB Reimbursement
Costs to be borne by AICF/JH Liable Entities
Amount Actual Paid DDB Total DDB Reimbursement Costs paid by AICF/JH Liable Entities
Settled Other Total Other Costs (by all defendants)
AICF Other Total Other Costs to be borne
by AICF/JH Liable Entities
Amount Actual Paid Other Total Other Costs paid by AICF/JH Liable Entities
AICF Legal Costs Total Total Defence Legal Costs to be borne by AICF/JH Liable Entities
Amount
Actual Paid Legal Costs Total Total Defence Legal Costs paid by AICF/JH Liable Entities
Case Estimate Fields
Reserve Damages Case estimate of damages
Reserve Costs Case estimate of costs
Reserve Legal Fees Case estimate of defence legal costs
Reserve Disbursements Case estimate of
other disbursements
Reserve DDB Case estimate of payments to DDB
KPMG | 99
© 2017 KPMG, an Australian partnership and a member firm of the KPMG network of independent member firms affiliated with KPMG International Cooperative
(“KPMG
International”), a Swiss entity. All rights reserved. The KPMG name and logo are registered trademarks or trademarks of KPMG International.
Liability limited by a scheme approved under Professional Standards Legislation.
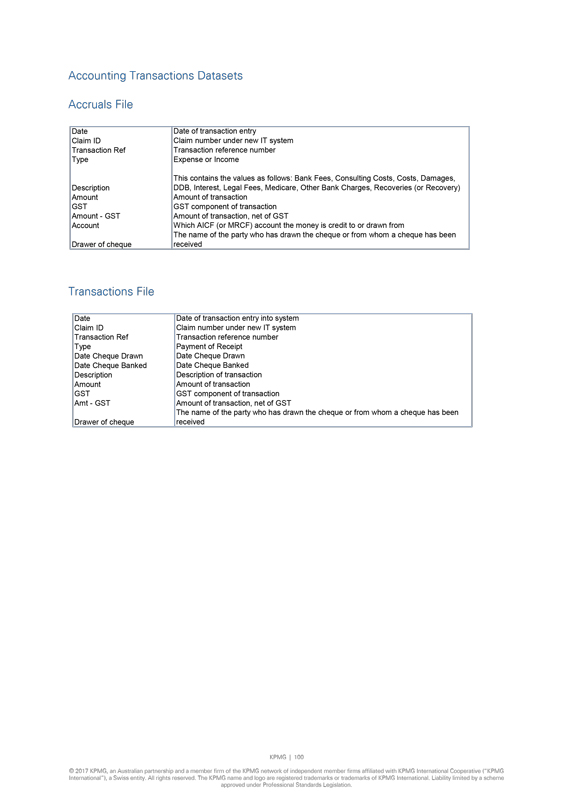
Accounting Transactions Datasets
Accruals File
Date Date of transaction entry
Claim ID Claim number under new IT system
Transaction Ref Transaction reference number
Type Expense or Income
This contains the values as follows: Bank Fees, Consulting Costs, Costs, Damages,
Description DDB, Interest, Legal Fees, Medicare, Other Bank Charges, Recoveries (or Recovery)
Amount Amount of transaction
GST GST component of transaction
Amount - GST Amount of transaction, net of GST
Account Which AICF (or MRCF) account the money
is credit to or drawn from
The name of the party who has drawn the cheque or from whom a cheque has been
Drawer of cheque received
Transactions File
Date Date of transaction entry into system
Claim ID Claim number under new IT system
Transaction Ref Transaction reference number
Type Payment of Receipt
Date Cheque Drawn Date Cheque Drawn
Date Cheque Banked Date Cheque Banked
Description Description of transaction
Amount Amount of transaction
GST GST component of transaction
Amt - GST Amount of transaction, net of GST
The name of the party who has drawn the cheque or from whom a cheque has been
Drawer of cheque received
KPMG | 100
© 2017 KPMG, an Australian partnership and a member firm of the KPMG network of independent member firms affiliated with KPMG International Cooperative (“KPMG
International”), a Swiss entity. All rights reserved. The KPMG name and logo are registered trademarks or trademarks of KPMG International. Liability limited by a scheme approved under Professional Standards Legislation.
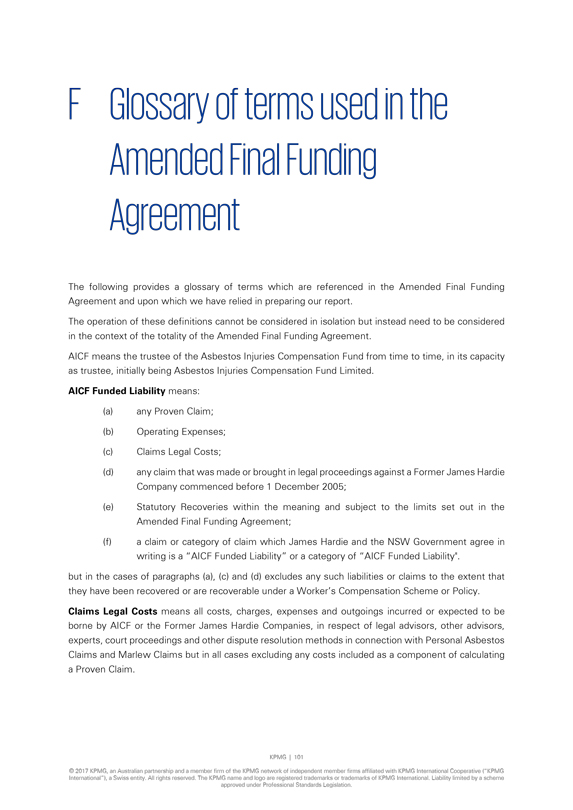
F Glossary of terms used in the Amended Final Funding Agreement
The following provides a glossary of terms which are referenced in the Amended Final Funding Agreement and upon which we have relied in preparing our report.
The operation of these definitions cannot be considered in isolation but instead need to be considered in the context of the totality of the Amended Final Funding Agreement.
AICF means the trustee of the Asbestos Injuries Compensation Fund from time to time, in its capacity as trustee, initially being Asbestos Injuries Compensation
Fund Limited.
AICF Funded Liability means:
(a) any Proven Claim;
(b) Operating Expenses;
(c) Claims Legal Costs;
(d) any claim that was made or brought in legal proceedings against a Former James Hardie Company commenced before 1 December 2005;
(e) Statutory Recoveries within the meaning and subject to the limits set out in the Amended Final Funding Agreement;
(f) a claim or category of claim which James Hardie and the NSW Government agree in writing is a “AICF Funded Liability” or a category of “AICF Funded
Liability”.
but in the cases of paragraphs (a), (c) and (d) excludes any such liabilities or claims to the extent that they have been recovered or are
recoverable under a Worker’s Compensation Scheme or Policy.
Claims Legal Costs means all costs, charges, expenses and outgoings incurred or expected to be
borne by AICF or the Former James Hardie Companies, in respect of legal advisors, other advisors, experts, court proceedings and other dispute resolution methods in connection with Personal Asbestos Claims and Marlew Claims but in all cases
excluding any costs included as a component of calculating a Proven Claim.
KPMG | 101
© 2017 KPMG, an Australian partnership and a member firm of the KPMG network of independent member firms affiliated with KPMG International Cooperative (“KPMG
International”), a Swiss entity. All rights reserved. The KPMG name and logo are registered trademarks or trademarks of KPMG International. Liability limited by a scheme approved under Professional Standards Legislation.
Concurrent Wrongdoer in relation to a personal injury or death claim for damages under common law or other law (excluding any law
introduced or imposed in breach of the restrictions on adverse regulatory or legislative action against the James Hardie Group under the Amended Final Funding Agreement, and which breach has been notified to the NSW Government in accordance with
Amended Final Funding Agreement), means a person whose acts or omissions, together with the acts or omissions of one or more Former James Hardie Companies or Marlew or any member of the James Hardie Group (whether or not together with any other
persons) caused, independently of each other or jointly, the damage or loss to another person that is the subject of that claim.
Contribution Claim means a
cross-claim or other claim under common law or other law (excluding any law introduced or imposed in breach of the restrictions on adverse regulatory or legislative action against the James Hardie Group under the Amended Final Funding Agreement, and
which breach has been notified to the NSW Government in accordance with Amended Final Funding Agreement):
(a) for contribution by a Concurrent Wrongdoer against a
Former James Hardie Company or a member of the James Hardie Group in relation to facts or circumstances which give rise to a right of a person to make a Personal Asbestos Claim or a Marlew Claim; or
(b) by another person who is entitled under common law (including by way of contract) to be subrogated to such a first mentioned cross-claim or other claim;
Discounted Central Estimate means the central estimate of the present value (determined using the discount rate used within the relevant actuarial report) of the liabilities of the
Former James Hardie Companies and Marlew in respect of expected Proven Claims and Claims Legal Costs, calculated in accordance with the Amended Final Funding Agreement.
Excluded Claims are any of the following liabilities of the Former James Hardie Companies:
(i)
personal injury or death claims arising from exposure to Asbestos outside Australia;
(ii) personal injury or death claims arising from exposure to Asbestos made
outside Australia;
(iii) claims for economic loss (other than any economic loss forming part of the calculation of an award of damages for personal injury or
death) or loss of property, including those relating to land remediation and/or Asbestos or Asbestos products removal, arising out of or in connection with Asbestos or Asbestos products manufactured, sold, distributed or used by or on behalf of the
Liable Entities;
(iv) any Excluded Marlew Claim;
(v) any liabilities of the
Liable Entities other than AICF Funded Liabilities.
Excluded Marlew Claim means a Marlew Claim:
(a) covered by the indemnities granted by the Minister of Mineral Resources under the deed between the Minister, Fuller Earthmoving Pty Limited and James Hardie Industries Limited
dated 11 March 1996; or
(b) by a current or former employee of Marlew in relation to an exposure to Asbestos in the course of such employment to the extent:
(i) the loss is recoverable under a Worker’s Compensation Scheme or Policy; or
KPMG | 102
© 2017 KPMG, an Australian partnership and a member firm of the KPMG network
of independent member firms affiliated with KPMG International Cooperative (“KPMG International”), a Swiss entity. All rights reserved. The KPMG name and logo are registered trademarks or trademarks of KPMG International. Liability limited
by a scheme approved under Professional Standards Legislation.
(ii) the Claimant is not unable to recover damages from a Marlew Joint Tortfeasor in accordance with the Marlew Legislation;
(c) by an individual who was or is an employee of a person other than Marlew arising from exposure to Asbestos in the course of such employment by that other person where such loss
is recoverable from that person or under a Worker’s Compensation Scheme or Policy; or
(d) in which another defendant (or its insurer) is a Marlew Joint
Tortfeasor from whom the plaintiff is entitled to recover compensation in proceedings in the Dust Diseases Tribunal, and the Claimant is not unable to recover damages from that Marlew Joint Tortfeasor in accordance with the Marlew Legislation.
Former James Hardie Companies means Amaca, Amaba and ABN 60.
Insurance and
Other Recoveries means any proceeds which may reasonably be expected to be recovered or recoverable for the account of a Former James Hardie Company or to result in the satisfaction (in whole or part) of a liability of a Former James Hardie Company
(of any nature) to a third party, under any product liability insurance policy or public liability insurance policy or commutation of such policy or under any other contract, including any contract of indemnity, but excluding any such amount
recovered or recoverable under a Worker’s Compensation Scheme or Policy.
Liable Entities see Former James Hardie Companies.
Marlew means Marlew Mining Pty Ltd (in liquidation), ACN 000 049 650, previously known as Asbestos Mines Pty Ltd.
Marlew Claim means, subject to the limitation on Statutory Recoveries, a claim which satisfies one of the following paragraphs and which is not an Excluded Marlew Claim:
(a) any present or future personal injury or death claim by an individual or the legal personal representative of an individual, for damages under common law or
other law (excluding any law introduced or imposed in breach of the restrictions on adverse regulatory or legislative action against the James Hardie Group under the Amended Final Funding Agreement, and which breach has been notified to the NSW
Government in accordance with the Amended Final Funding Agreement) which:
(i) arose or arises from exposure to Asbestos in the Baryulgil region from Asbestos
Mining Activities at Baryulgil conducted by Marlew, provided that:
A. the individual’s exposure to Asbestos occurred wholly within Australia; or
B. where the individual has been exposed to Asbestos both within and outside Australia, the amount of damages included in the Marlew Claim shall be limited to the amount
attributable to the proportion of the exposure which caused or contributed to the loss or damage giving rise to the Marlew Claim which occurred in Australia;
(ii)
is commenced in New South Wales in the Dust Diseases Tribunal; and
KPMG | 103
© 2017 KPMG, an Australian partnership and a member firm of the KPMG network of independent member firms affiliated with KPMG International Cooperative
(“KPMG
International”), a Swiss entity. All rights reserved. The KPMG name and logo are registered trademarks or trademarks of KPMG International.
Liability limited by a scheme approved under Professional Standards Legislation.
(iii) is or could have been made against Marlew had Marlew not been in external administration or wound up, or could be made against
Marlew on the assumption (other than as contemplated under the Marlew legislation) that Marlew will not be in the future in external administration;
(b) any claim
made under compensation to relatives legislation by a relative of a deceased individual (or personal representative of such a relative) or (where permitted by law) the legal personal representative of a deceased individual in each case where the
individual, but for such individual’s death, would have been entitled to bring a claim of the kind described in paragraph (a); or
(c) a Contribution Claim
relating to a claim described in paragraphs (a) or (b).
Marlew Joint Tortfeasor means any person who is or would be jointly and severally liable with Marlew in
respect of a Marlew Claim, had Marlew not been in external administration or wound up, or on the assumption that Marlew will not in the future be, in external administration or wound up other than as contemplated under the Marlew Legislation.
Payable Liability means any of the following:
(a) any Proven Claim (whether
arising before or after the date of this deed);
(b) Operating Expenses;
(c)
Claims Legal Costs;
(d) any liability of a Former James Hardie Company to the AICFL, however arising, in respect of any amounts paid by the AICFL in respect of any
liability or otherwise on behalf of the Former James Hardie Company;
(e) any claim that was made or brought in legal proceedings against a Former James Hardie
Company commenced before 1 December 2005;
(f) if regulations are made pursuant to section 30 of the Transaction Legislation and if and to the extent the AICFL
and James Hardie have notified the NSW Government that any such liability is to be included in the scope of Payable Liability, any liability of a Former James Hardie Company to pay amounts received by it from an insurer in respect of a liability to
a third party incurred by it for which it is or was insured under a contract of insurance entered into before 2 December 2005; and
(g) Statutory Recoveries
within the meaning and subject to the limits set out in the Amended Final Funding Agreement,
but in the cases of paragraphs (a), (c) and (e) excludes any such
liabilities or claims to the extent that they have been recovered or are recoverable under a Worker’s Compensation Scheme or Policy.
Period Actuarial Estimate
means, in respect of a period, the central estimate of the present value (determined using the discount rate used in the relevant actuarial report) of the liabilities of the Former James Hardie Companies and Marlew in respect of expected Proven
Claims and Claims Legal Costs (in each case which are reasonably expected to become payable in that period), before allowing for Insurance and Other Recoveries, calculated in accordance with the Amended Final Funding Agreement.
KPMG | 104
© 2017 KPMG, an Australian partnership and a member firm of the KPMG network
of independent member firms affiliated with KPMG International Cooperative (“KPMG
International”), a Swiss entity. All rights reserved. The KPMG name and
logo are registered trademarks or trademarks of KPMG International. Liability limited by a scheme approved under Professional Standards Legislation.
Personal Asbestos Claim means any present or future personal injury or death claim by an individual or the legal personal representative
of an individual, for damages under common law or under other law (excluding any law introduced or imposed in breach of the restrictions on adverse regulatory or legislative action against the James Hardie Group under the Amended Final Funding
Agreement, and which breach has been notified to the NSW Government under the Amended Final Funding Agreement) which:
(a) arises from exposure to Asbestos
occurring in Australia, provided that:
(i) the individual’s exposure to Asbestos occurred wholly within Australia; or
(ii) where the individual has been exposed to Asbestos both within and outside Australia, damages included in the Marlew Claim shall be limited to the amount attributable to the
proportion of the exposure which caused or contributed to the loss or damage giving rise to the Personal Asbestos Claim which occurred in Australia;
(b) is made in
proceedings in an Australian court or tribunal; and
(c) is made against:
(i)
all or any of the Liable Entities; or
(ii) any member of the James Hardie Group from time to time;
(d) any claim made under compensation to relatives legislation by a relative of a deceased individual (or personal representative of such a relative) or (where permitted by law)
the legal personal representative of a deceased individual in each case where the individual, but for such individual’s death, would have been entitled to bring a claim of the kind described in paragraph (a); or
(e) a Contribution Claim made in relation to a claim described in paragraph (a) or (b)
but
excludes all claims covered by a Worker’s Compensation Scheme or Policy.
Proven Claim means a proven Personal Asbestos Claim in respect of which final
judgment has been given against, or a binding settlement has been entered into by, a Former James Hardie Company, to the extent to which that entity incurs liability under that judgment or settlement, or a Proven Marlew Claim.
Statutory Recoveries means any statutory entitlement of the NSW Government or any Other Government or any governmental agency or authority of any such government (“Relevant
Body”) to impose liability on or to recover an amount or amounts from any person in respect of any payments made or to be made or benefits provided by a Relevant Body in respect of claims (other than as a defendant or in settlement of any
claim, including a cross-claim or claim for contribution).
Term means the period
(i) from the date on which the principal obligations under the Amended Final Funding Agreement will commence to 31 March 2045,
(ii) as may be extended in accordance with the terms of the Amended Final Funding Agreement.
KPMG | 105
© 2017 KPMG, an Australian partnership and a member firm of
the KPMG network of independent member firms affiliated with KPMG International Cooperative (“KPMG International”), a Swiss entity. All rights reserved. The KPMG name and logo are registered trademarks or trademarks of KPMG International.
Liability limited by a scheme approved under Professional Standards Legislation.
Term Central Estimate means the central estimate of the present value (determined using the discount rate used in the relevant Annual
Actuarial Report) of the liabilities of the Former James Hardie Companies and Marlew in respect of expected Proven Claims and Claims Legal Costs (in each case reasonably expected to become payable in the relevant period) after allowing for Insurance
and Other Recoveries during that period, from and including the day following the end of the Financial Year preceding that Payment Date up to and including the last day of the Term (excluding any automatic or potential extension of the Term, unless
or until the Term has been extended).
Workers Compensation Scheme or Policy means any of the following:
(a) any worker’s compensation scheme established by any law of the Commonwealth or of any State or Territory;
(b) any fund established to cover liabilities under insurance policies upon the actual or prospective insolvency of the insurer (including without limitation the Insurer Guarantee
Fund established under the Worker’s Compensation Act 1987 (NSW)); and
(c) any policy of insurance issued under or pursuant to such a scheme.
KPMG | 106
© 2017 KPMG, an Australian partnership and a member firm of the KPMG network
of independent member firms affiliated with KPMG International Cooperative (“KPMG International”), a Swiss entity. All rights reserved. The KPMG name and logo are registered trademarks or trademarks of KPMG International. Liability limited
by a scheme approved under Professional Standards Legislation.
KPMG
kpmg.com.au