Exhibit 99.5
james hardie industries plc remuneration report 2017

This Remuneration Report describes the executive remuneration philosophy, programs and objectives of the Remuneration
Committee and the Board of Directors (the “Board”), as well as the executive remuneration plans and programs implemented by James Hardie Industries plc. For purposes of this discussion, references to “James Hardie”, the
“Company”, “we”, “our” and “us” all refer to James Hardie Industries plc.
We are not required to produce a remuneration
report under applicable Irish, Australian or US rules or regulations. However, taking into consideration our significant Australian and US shareholder bases and our primary listing on the Australian Securities Exchange (“ASX”), we
have voluntarily produced a remuneration report consistent with those provided by similarly situated companies for non-binding shareholder approval since 2005.
This
Remuneration Report outlines the key remuneration plans and programs and share ownership information for our Board of Directors and certain of our senior executive officers (Chief Executive Officer (“CEO”), Chief Financial Officer
(“CFO”) and the other three highest paid executive officers based on total compensation that was earned or accrued for fiscal year 2017) (“Senior Executive Officers”) in fiscal year 2017, and also includes an
outline of the key changes for fiscal year 2018. Further details of these changes are set out in the 2017 Notice of Annual General Meeting (“AGM”).
We first provide a summary of our business performance and the key remuneration considerations and decisions made in fiscal year 2017. We then describe in detail our
remuneration philosophy, the individual elements of our remuneration program and the linkage between our remuneration programs and our pay-for-performance philosophy. For fiscal year 2017, our Senior Executive Officers are:
| ◾ |
|
Matthew Marsh, CFO and Executive Vice President – Corporate; |
| ◾ |
|
Sean Gadd, Executive Vice President – Markets and Segments; |
| ◾ |
|
Joseph Blasko, General Counsel and Chief Compliance Officer; and |
| ◾ |
|
Mark Fisher, former Executive Vice President – International. |
Mr Fisher is included in this Remuneration Report
based on his level of compensation and status as an executive officer as of 31 March 2017. Subsequent to 31 March 2017, Mr Fisher voluntarily terminated his employment with us as of 3 April 2017.
This Remuneration Report has been adopted by our Board on the recommendation of the Remuneration Committee.
FORWARD-LOOKING STATEMENTS
Certain statements in this Remuneration Report may constitute “forward-looking statements” as defined in the Private Securities Litigation Reform Act of 1995.
James Hardie Industries plc (James Hardie or the Company) uses such words as “believe”, “anticipate”, “plan”, “expect”, “intend”, “target”, “estimate”, “project”,
“predict”, “forecast”, “guideline”, “aim”, “will”, “should”, “likely”, “continue”, “may”, “objective”, “outlook”, and similar expressions
are intended to identify forward-looking statements but are not the exclusive means of identifying such statements. Readers are cautioned not to place undue reliance on these forward-looking statements and all such forward-looking statements are
qualified in their entirety by reference to the following cautionary statements.
Forward-looking statements are based on James Hardie’s current expectations,
estimates and assumptions and because forward-looking statements address future results, events and conditions, they, by their very nature, involve inherent risks and uncertainties, many of which are unforeseeable and beyond the Company’s
control. Many factors could cause the actual results, performance or achievements of James Hardie to be materially different from those expressed or implied in this Remuneration Report, including, among others, the risks and uncertainties set forth
in Section 3 “Risk Factors” in James Hardie’s Annual Report on Form 20-F for the year ended 31 March 2017; changes in general economic, political, governmental and business conditions globally and in the countries in which
James Hardie does business; changes in interest rates; changes in inflation rates; changes in exchange rates; the level of construction generally; changes in cement demand and prices; changes in raw material and energy prices; changes in business
strategy and various other factors. Should one or more of these risks or uncertainties materialise, or should underlying assumptions prove incorrect, actual results may vary materially from those described herein. These forward-looking statements
are made as of the date of this Remuneration Report and James Hardie does not assume any obligation to update them, except as required by law. Investors are encouraged to review James Hardie’s Annual Report on Form 20-F, and specifically the
risk factors discussed therein, as it contains important disclosures regarding the risks attendant to investing in our securities.
NON-GAAP
FINANCIAL INFORMATION
This Remuneration Report contains financial measures that are not considered a measure of financial performance under United States
generally accepted accounting principles (“US GAAP”) and should not be considered to be more meaningful than the equivalent US GAAP measure. Management has included such measures to provide investors with an alternative method
for assessing its operating results in a manner that is focused on the performance of its ongoing operations. Additionally, management uses such non-GAAP financial measures for the same purposes. However, these non-GAAP financial measures are not
prepared in accordance
2
with US GAAP, may not be reported by all of James Hardie’s competitors and may not be directly comparable to similarly titled measures of James Hardie’s competitors due to potential
differences in the exact method of calculation. For additional information regarding the non-GAAP financial measures presented in this Remuneration Report, including a reconciliation of each non-GAAP financial measure to the equivalent US GAAP
measure, see the sections titled “Definition and Other Terms” and “Non-US GAAP Financial Measures” included in James Hardie’s Management’s Analysis of Results for the fourth quarter and twelve months ended
31 March 2017.
EXECUTIVE SUMMARY
Fiscal Year 2017 Business Highlights
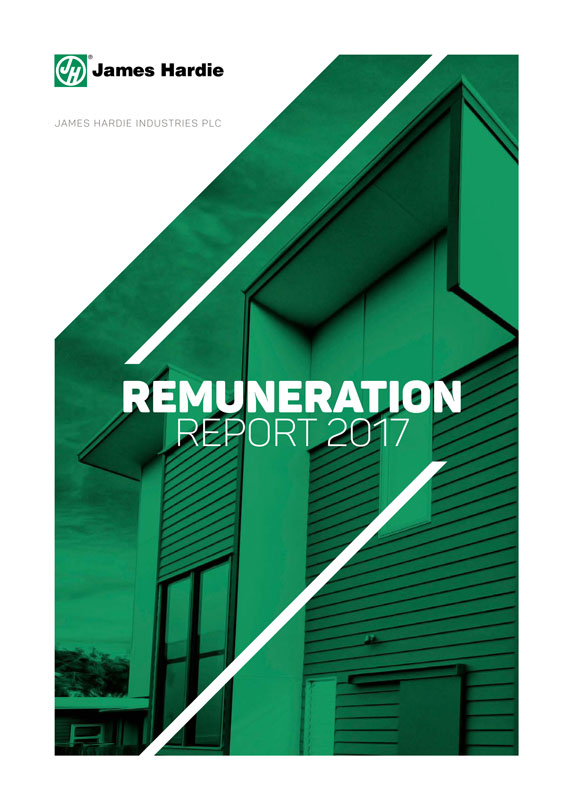
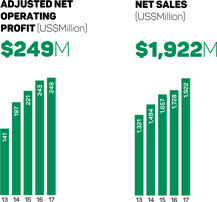
We delivered strong financial
performance in fiscal year 2017, highlighted by adjusted net operating profit of US$248.6 million, adjusted earnings before interest and taxes (“EBIT”) of US$354.3 million, and net sales of US$1.9 billion. In addition, we achieved a
12% increase in net cash provided by operating activities, compared to fiscal year 2016, and US$276.6 million of capital returned to shareholders through a combination of dividends and the previously announced share buyback program.
The following graphs show our performance for key financial measures during fiscal year 2017, with a comparison to prior corresponding periods:
Fiscal Year 2017 Compensation Highlights
Our fiscal year 2017 compensation continued to reflect and promote our pay-for-performance philosophy and our stated goal to position Senior Executive Officer fixed base
salary and benefits at the median and total target direct remuneration (comprising fixed and target variable remuneration) at the 75th percentile of our Peer Group (defined herein), if stretch short- and long-term target performance goals are met.
During May 2016, the Board, with the assistance of the Remuneration Committee and its independent remuneration advisers, undertook its annual review of our existing remuneration policies, programs and arrangements and determined the following for
fiscal year 2017 pay programs:
| ◾ |
|
There were no changes to Mr Gries’ fixed or variable compensation. Mr Gries’ base salary, target short-term incentive (“STI”), and target long-term incentive (“LTI”) remained
the same in fiscal year 2017 as they were for fiscal year 2016. |
| ◾ |
|
Base salary, target STI and target LTI increases for Mr Marsh were made to properly align his base salary with the increase in role scope and accountability that occurred for him during fiscal year 2016 as well as to
align his overall compensation package with (i) our CEO succession plan, (ii) our need to retain key senior executives through the eventual CEO transition process, (iii) our lean management structure, and (iv) the 75th percentile
of our Peer Group LTI values, consistent with our remuneration philosophy. |
| ◾ |
|
Base salary increases for Messrs Fisher and Blasko were made in line with our annual compensation review guidelines and were adjusted as required to maintain positioning relative to market merit increase levels. A small
increase to Mr Blasko’s target LTI was also made to better align his LTI target value with the 75th percentile of the market, consistent with our remuneration philosophy. There were no changes made to Mr Gadd’s fixed or variable
compensation components. |
| ◾ |
|
No changes were made to the operation or components of the company performance plan (“CP Plan”) or individual performance plan (“IP Plan”) for our annual STI program for fiscal year
2017 other than to establish new targets which align with our strategic initiatives as we do every year. A complete description of the performance hurdles applicable for fiscal year 2017 for the CP Plan is set out in the section titled
“Incentive Arrangements” later in this Remuneration Report. |
| ◾ |
|
No changes were made to the operation or components of our LTI program for fiscal year 2017 other than minor updates to the performance hurdles for the return on capital employed restricted stock unit (“ROCE
RSU”) and scorecard long-term incentive (“Scorecard LTI”) objectives. A complete description of the LTI program, including the applicable performance hurdles is set out in the section titled “Incentive
Arrangements” later in this Remuneration Report. |
3
JAMES HARDIE REMUNERATION REPORT
2017
REMUNERATION REPORT 2017 CONTINUED
Fiscal Year 2017 Total Target Compensation
Remuneration packages for Senior Executive Officers reflect our remuneration philosophy and comprise a mixture of fixed base salary and benefits and variable
performance-based incentives. The Remuneration Committee seeks to appropriately balance fixed and variable remuneration in order to align our total compensation structure with our pay-for-performance philosophy. The following chart summarises total
target compensation awarded to each Senior Executive Officer in fiscal year 2017:
Summary of Fiscal Year 2017 Senior Executive Officer Target Compensation
|
|
|
|
|
|
|
|
|
|
|
|
|
|
|
|
|
| SENIOR EXECUTIVE
OFFICER |
|
FY2017 ANNUAL
BASE SALARY
(US$)
|
|
|
FY2017 STI
TARGET VALUE
(US$)
|
|
|
FY2017
LTI
TARGET VALUE
(US$) |
|
|
FY2017 TOTAL TARGET
COMPENSATION
(US$)
|
|
| L Gries |
|
|
950,000 |
|
|
|
1,187,500 |
|
|
|
4,000,000 |
|
|
|
6,137,500 |
|
| M Marsh |
|
|
560,000 |
|
|
|
392,000 |
|
|
|
1,200,000 |
|
|
|
2,152,000 |
|
| M Fisher |
|
|
515,000 |
|
|
|
309,000 |
|
|
|
650,000 |
|
|
|
1,474,000 |
|
| S Gadd |
|
|
408,000 |
|
|
|
244,800 |
|
|
|
650,000 |
|
|
|
1,302,800 |
|
| J Blasko |
|
|
405,000 |
|
|
|
243,000 |
|
|
|
450,000 |
|
|
|
1,098,000 |
|
Results of 2017 Remuneration Report Vote
In
August 2016, our shareholders were asked to cast a non-binding advisory vote on our remuneration report for the fiscal year ended 31 March 2016. Although we are not required under applicable Irish, Australian or US laws or regulations to
provide a shareholder vote on our executive remuneration practices, the Board believes that it is important to engage shareholders on this important issue and we have voluntarily submitted our remuneration report for non-binding shareholder approval
on an annual basis since 2005 and currently intend to continue to do so. At our 2016 Annual General Meeting, our shareholders approved our remuneration report, with just over 78% of the votes cast in support of our remuneration program. The
Remuneration Committee considered the results of this advisory vote, together with investor feedback and other factors and data associated with strategic priorities discussed in this Remuneration Report, in determining our executive remuneration
policies, objectives and decisions and related shareholder engagement efforts for fiscal year 2017. The Remuneration Committee also considered these same factors in determining changes to our fiscal year 2018 executive remuneration programs,
resulting in a more evenly balanced focus between advancing critical operational and strategic objectives that position the Company for long-term success, and financial and shareholder return measures achieved. Among the adjustments it was also
decided to eliminate the retesting feature of our relative total shareholder return restricted stock unit (“Relative TSR RSU”) grants, which is understood to have been a factor of concern to a significant proportion of our
shareholders. A complete description of the changes to our fiscal year 2018 executive remuneration programs is set out in the section titled “Remuneration for Fiscal Year 2018” later in this Remuneration Report.
APPROACH TO SENIOR EXECUTIVE REMUNERATION
Remuneration Philosophy
As our main business and all of our Senior Executive
Officers are located in the US, our remuneration philosophy is to provide our Senior Executive Officers with an overall package that is competitive with Peer Group companies (defined herein) exposed to the US housing market. Within this philosophy,
the executive remuneration framework emphasises operational excellence and shareholder value creation through incentives which link executive remuneration with the interests of shareholders. Our remuneration plans and programs are structured to
enable us to: (i) attract and retain talented executives; (ii) reward outstanding individual and corporate performance; and (iii) align the interests of our executives to the interests of our shareholders, with the ultimate goal of
improving long-term value for our shareholders. This pay-for-performance system continues to serve as the framework for executive remuneration, aligning the remuneration received with the performance achieved.
Composition of Remuneration Packages
In line with our remuneration
philosophy, our goal is to position Senior Executive Officer fixed base salary and benefits at the median and total target direct remuneration (comprising fixed and target variable remuneration) at the 75th percentile of our Peer Group, if stretch
short and long-term target performance goals are met. Performance goals for target variable performance-based incentive remuneration are set with the expectation that we will deliver results in the top quartile of our Peer Group. Performance below
this level will result in variable remuneration payments below target (and potentially zero for poor performance). Performance above this level will result in variable remuneration payments above target.
4
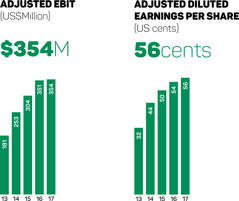
Relative Weightings of Fixed and Variable Remuneration
The charts below detail the relative weightings of fixed versus variable remuneration for the CEO and other Senior Executive Officers for fiscal years 2017 and 2016.
Fixed remuneration includes base salary and other fixed benefits. Variable remuneration is comprised of STI awards and the following three LTI components: (i) Relative TSR RSUs; (ii) ROCE RSUs; and (iii) Scorecard LTI, each of which
are discussed in more detail in this Remuneration Report. STI awards include amounts earned under the CP and IP plans for each fiscal year, paid in June of the following fiscal year, and LTI components are shown at total maximum grant value.
Setting Remuneration Packages
Remuneration decisions are based on the executive remuneration philosophy and framework described in this Remuneration Report. The Remuneration Committee reviews and the
Board approves this framework each year.
Remuneration packages for Senior Executive Officers are evaluated each year to make sure that they continue to align with
our compensation philosophy, are competitive with our Peer Group and developments in the market, and continue to support our business structure and objectives. In making decisions regarding individual Senior Executive Officers, the Remuneration
Committee takes into account both the results of an annual remuneration positioning review provided by the Remuneration Committee’s independent advisor and the Senior Executive Officer’s responsibilities and performance.
All aspects of the remuneration package for our CEO and CFO are determined by the Remuneration Committee and ratified by the Board. All aspects of the remuneration
package for the remaining Senior Executive Officers are determined by the Remuneration Committee on the recommendation of the CEO.
Remuneration Committee
Governance
The remuneration program for our Senior Executive Officers is overseen by our Remuneration Committee, the members of which are appointed by the Board.
As prescribed by the Remuneration Committee Charter, the duties of the Remuneration Committee include, among other things: (i) administering and making recommendations on our incentive compensation and equity-based remuneration plans;
(ii) reviewing the remuneration of directors; (iii) reviewing the remuneration framework for the Company; and (iv) making recommendations to the Board on our recruitment, retention and termination policies and procedures for senior
management. The current members of the Remuneration Committee are David Harrison (Chairman), Brian Anderson, Russell Chenu, Michael Hammes and Alison Littley, the majority of whom are independent non-executive directors. A more complete description
of these and other Remuneration Committee functions is contained in the Remuneration Committee’s Charter, a copy of which is available in the Corporate Governance section of the Investor Relations page on our website
(www.ir.jameshardie.com.au).
5
JAMES HARDIE REMUNERATION REPORT
2017
REMUNERATION REPORT 2017 CONTINUED
Summary of Executive Compensation Practices
The following table summarises certain of the key governance practices employed by the Remuneration Committee relative to our executive compensation practices, including
those practices which we believe are important drivers of both short- and long-term corporate performance and those practices which we believe are not aligned with the long-term interests of our shareholders:
|
|
|
| WHAT WE
DO |
|
WHAT WE DON’T DO |
|
|
| ✓ Retain independent compensation advisors reporting
directly to Remuneration Committee |
|
O
Prohibition on hedging of stock held by executives and directors |
|
|
| ✓ Pay for performance model, with approximately 85% of
our CEO’s total target compensation being performance-based “at risk” compensation and an average of approximately 68% total target compensation being performance-based “at risk” compensation for our other Senior Executive
Officers |
|
O
Limited employment agreements and severance arrangements |
|
|
| ✓ Circuit breaker on annual STI awards to ensure that
no annual incentive awards are paid unless minimum corporate performance levels are achieved |
|
O
Limited change-in-control benefits |
|
|
| ✓ Set robust share ownership requirements for all
directors and Senior Executive Officers |
|
O No
dividends paid on unvested equity awards |
|
|
| ✓ Broad clawback policy on performance-based
compensation |
|
O
Limited perquisites and other benefits |
|
|
| ✓ Set performance-based vesting conditions for all
equity grants to Senior Executive Officers |
|
O No
annual time-based LTI equity grants to Senior Executive Officers |
|
|
| ✓ Provide
the Remuneration Committee with ability to exercise “negative” discretion when determining the vesting and payout of our LTI programs |
|
O No excessive retirement or deferred compensation arrangements |
Remuneration Advisers
As permitted by the
Remuneration Committee Charter, the Remuneration Committee retained Aon Hewitt (in the US) and Guerdon Associates (in Australia) as its independent advisers for matters regarding remuneration for fiscal year 2017. The Remuneration Committee reviews
the appointment of its advisors each year. Both Aon Hewitt and Guerdon Associates provided the Remuneration Committee with written certification during fiscal year 2017 to support their re-appointment. In those certifications, the advisors:
(i) confirmed that their pay recommendations were made without undue influence from any member of our management; and (ii) provided detailed responses to the six independence factors a Remuneration Committee should consider under relevant
NYSE rules, and confirmed their independence based on these factors.
The Remuneration Committee reviewed these certifications before re-appointing each advisor for
fiscal year 2018.
Benchmarking Analysis
To assist the Remuneration
Committee in making remuneration decisions, the Remuneration Committee evaluates the remuneration of our Senior Executive Officers against a designated set of companies (the “Peer Group”). The Peer Group, which is reviewed by the
Remuneration Committee on an annual basis, consists of companies that are similar to us in terms of certain factors, including size, industry, and exposure to the US housing market. For fiscal year 2017, the Peer Group remained unchanged from fiscal
year 2016. The Remuneration Committee believes that US market focused companies are a more appropriate peer group than ASX-listed companies, as they are exposed to the same macroeconomic factors in the US housing market as those we face. The names
of the 24 companies comprising the Peer Group are set forth below.
|
|
|
|
|
| |
|
|
| Acuity Brands, Inc |
|
Louisiana-Pacific Corp |
|
Sherwin Williams Co |
|
|
|
| American Woodmark Corp |
|
Martin Marietta Materials, Inc |
|
Simpson Manufacturing Co., Inc |
|
|
|
| Apogee Enterprises, Inc |
|
Masco Corporation |
|
Trex Co., Inc |
|
|
|
| Armstrong World Industries Inc |
|
Mohawk Industries, Inc |
|
USG Corp |
|
|
|
| Eagle Materials, Inc |
|
Mueller Water Products, Inc |
|
Valmont Industries, Inc |
|
|
|
| Fortune Brands Home & Security |
|
NCI Building Systems, Inc |
|
Valspar Corporation |
|
|
|
| Headwaters, Inc |
|
Owens Corning |
|
Vulcan Materials Co |
|
|
|
| Lennox International, Inc
|
|
Quanex Building Products Corp |
|
Watsco, Inc |
The Peer Group was used to benchmark the remuneration of Messrs Gries, Marsh, and Fisher in fiscal year 2017. Supplemental remuneration
survey data of other manufacturing companies of similar size to James Hardie was used to define competitive pay levels for Messrs Gadd and Blasko.
6
Performance Linkage with Remuneration Policy
During its annual review, the Remuneration Committee assessed our performance in fiscal year 2017 against:
| ◾ |
|
our historical performance; |
| ◾ |
|
the goals in our STI and LTI variable remuneration plans; and |
| ◾ |
|
the key objectives and measures the Board expects to see achieved, which are referred to as the “Scorecard” and further discussed later in this Remuneration Report. |
Based on that review, the Board and the Remuneration Committee concluded that management’s performance in fiscal year 2017 was on the whole: (i) at target on
growth measures and slightly below target on earnings, resulting in STI variable remuneration outcomes being below target for fiscal year 2017; and (ii) when taken together with performance in fiscal years 2015 and 2016, at the 59th percentile
of our Peer Group on TSR performance, above expectations on ROCE performance, and above expectations on long-term strategic measures included in the Scorecard, resulting in LTI variable remuneration being above target for fiscal years 2015-2017.
More details about this assessment, including the percentage of the maximum variable remuneration awarded to or forfeited by Senior Executive Officers is set out on
pages 8 through 13 of this Remuneration Report.
DESCRIPTION OF 2017 REMUNERATION ELEMENTS
Base Salaries and Other Fixed
Remuneration Benefits
Base salary provides a guaranteed level of income that recognises the market value of the position and internal equities between roles, and the individual’s
capability, experience and performance. Annual base salary increases are not automatic. Base salaries for Senior Executive Officers are positioned around the market median for positions of similar responsibility and are reviewed by the Remuneration
Committee each year.
In addition, Senior Executive Officers may receive certain other limited fixed benefits, such as medical and life insurance benefits, car
allowances, participation in executive wellness programs and an annual financial planning allowance. For fiscal year 2017, the base salary and value of other fixed benefits for each of our Senior Executive Officers is provided in the Base Pay and
Other Benefits columns of the remuneration table in the section titled “Remuneration Paid to Senior Executive Officers”.
Retirement Plan
In every country in which we operate, we offer employees access to pension, superannuation or individual retirement savings plans consistent with the laws of the
respective country.
In the US, we sponsor a defined contribution plan, the James Hardie Retirement and Profit Sharing Plan (the “401(k) Plan”). The
401(k) Plan is a tax-qualified retirement and savings plan covering all US employees, including our Senior Executive Officers, subject to certain eligibility requirements. Participating employees were able to elect to reduce their current annual
compensation by up to US$18,000 in calendar year 2016 and have the amount of such reduction contributed to the 401(k) Plan, with a maximum eligible compensation limit of US$265,000. In addition, we match employee contributions dollar for dollar up
to a maximum of the first 6% of an employee’s eligible compensation.
Incentive Arrangements
In addition to the base salary and other fixed benefits provided to our Senior Executive Officers, the Remuneration Committee reviews and approves a combination of both
short-term and long- term variable incentive programs on an annual basis.
For fiscal year 2017, our variable incentive plans for Senior Executive Officers were as follows:
|
|
|
|
|
|
|
| DURATION
|
|
PLAN NAME
|
|
AMOUNT
|
|
FORM
INCENTIVE PAID |
|
|
|
|
| STI (1 year) |
|
IP Plan |
|
20% of
STI Target |
|
Cash |
|
|
|
|
| |
|
CP Plan |
|
80% of
STI Target |
|
Cash |
|
|
|
|
| LTI (3–4.5 years) |
|
Long Term
Incentive Plan
2006 (“LTIP”) |
|
40% of
LTI Target |
|
ROCE RSUs |
|
|
|
|
|
|
|
|
30% of
LTI Target |
|
Relative TSR
RSUs |
|
|
|
|
| |
|
|
|
30% of
LTI Target |
|
Cash
(Scorecard LTI)
|
STI Plans
On an annual basis, the
Remuneration Committee approves an STI target for all Senior Executive Officers, expressed as a percentage of base salary, which is allocated between individual goals and Company goals under the IP and CP Plans, respectively. For fiscal year 2017,
the STI target percentage for Mr Gries was 125% of base salary, 70% of base salary for Mr Marsh, and 60% of base salary for Messrs Fisher, Gadd and Blasko, with 80% allocated to the CP Plan and 20% allocated to the IP Plan for all Senior Executive
Officers.
Since fiscal year 2014, the Remuneration Committee has applied a ‘circuit breaker’ to the STI plans, which for Senior Executive Officers will
prevent payment of any STI under the CP and IP Plans unless our performance exceeds a level approved by the Remuneration Committee each year. For fiscal year 2017, the ‘circuit breaker’ was set at 60% of our fiscal year 2017 plan Adjusted
EBIT (indexed to housing starts) less any impairment costs the Remuneration Committee determines should be disregarded.
CP Plan
The CP Plan is based on a series of payout matrices for the US and Asia Pacific businesses, which provide a range of possible payouts depending on our performance against
hurdles which assess volume growth relative to, and above, market (“Growth Measure”), earnings (“Return Measure”), and for the US business, performance of the interiors business and performance against certain
“wood-look” competitors. Each Senior Executive Officer can receive between 0% and 300% of their STI target allocated to the CP Plan based on the results of the payout multiple the Senior Executive Officer is tied to. All Senior Executive
Officers are tied to either the US multiple (Mr Gadd) or a composite multiple derived from the metrics for the US (80%) and Asia Pacific (20%) businesses combined (Messrs Gries, Marsh, Fisher and Blasko).
Payout Matrices
We use both performance measures (Growth Measure and
Return Measure) in the payout matrices for our US and Asia Pacific businesses in order to ensure that as management increases its top line market growth focus, it does not do so at the expense of short- to medium-term earnings. Management is
encouraged to balance market growth and earnings returns since achievement of a higher reward requires management to generate both strong earnings and growth relative to and above market. Higher returns on one measure at the expense of the other
measure may result in a lower reward or no reward at all.
7
JAMES HARDIE REMUNERATION REPORT
2017
REMUNERATION REPORT 2017 CONTINUED
To ensure that the payout matrices represent genuinely challenging targets aligned with our executive remuneration
philosophy, the Growth Measure is indexed to take into account changes in new housing starts in both the US and Asia Pacific and the US repair and remodel market, while the Return Measure is indexed to take into account changes in pulp prices. The
targets for the Return Measure exclude costs related to legacy issues. The Remuneration Committee has reserved for itself discretion to change the STI paid. Examples of instances when the Remuneration Committee would consider exercising this
discretion include external factors outside of management’s control, and for the US CP Plan only, if the general shift toward smaller homes at each segment of the US market is considered sufficiently material. The Remuneration Committee will
disclose the reasons for any such exercise of its discretion.
The Remuneration Committee believes that the payout matrices are appropriate because they provide
management with an incentive to achieve overall corporate goals, balance growth with returns in our primary markets, recognise the need to flexibly respond to strategic opportunities, incorporate indexing relative to market growth to account for
factors beyond management’s control, and incorporate Remuneration Committee discretion to ensure appropriate outcomes. Payouts under the US matrix may range from 0% to 200% of target, while payouts under the Asia Pacific matrix may range from 0
to 300% of target.
We do not disclose the volume Growth Measure and earnings Return Measure targets for our US or Asia Pacific businesses since these are
commercial-in-confidence. However, achieving a target payment for the Return Measure under either the US or Asia Pacific payout matrix for fiscal year 2017 would have required performance equal to the average of performance for the previous three
years and the fiscal year 2017 plan. Achieving a target payout for the Growth Measure requires growth substantially above market growth.
Additional US
Performance Metrics
In order to better align and focus management’s performance on initiatives that are key to the success of the US business, the US
payout multiple for fiscal year 2017 is determined by performance against the matrix multiple (Growth and Return Measures for 70% of STI opportunity), the interiors product business multiple (for 10% of STI opportunity), and the
“Wood-look” multiple (for 20% of STI opportunity). The overarching formula for the US payout multiple is:

Each payout factor (Matrix Factor, Interiors Factor, and “Wood-look” Factor) is capped as follows to properly balance
management’s focus across volume growth, returns and key initiatives:
| ◾ |
|
Matrix Factor = capped at 2.0x |
| ◾ |
|
Matrix Factor plus Interiors Factor = capped at 2.3x |
| ◾ |
|
“Wood-look” Factor = capped at 1.25x |
The Interiors Multiple is measured as a function of the revenue growth of
our interiors business in fiscal year 2017. The “Wood-look” Multiple is measured as our growth against key “wood-look” competition.
We do not
disclose the interiors volume growth or “wood-look” targets since these are commercial-in-confidence. However, achieving a target payment for fiscal year 2017 requires interior volume performance above fiscal year 2016 interiors volume and
substantial growth against key “wood-look” competition.
IP Plan
Under the IP Plan, the Remuneration Committee approves a series of one-year individual performance goals which, along with goals on our core organisational values, are
used to assess the performance of our Senior Executive Officers. The IP Plan links financial rewards to the Senior Executive Officer’s achievement of specific objectives that have benefited us and contributed to shareholder value, but are not
captured directly by financial measures in the CP Plan. Each Senior Executive Officer can receive between 0% and 150% of their STI target allocated to the IP Plan based on achievement of individual performance and core organisational values goals.
STI Plan Performance for Fiscal Year 2017
Our CP Plan results
and the subsequent STI payouts for fiscal year 2017 were just below target as a result of:
| ◾ |
|
the US business performing slightly above target on the Growth Measure; |
| ◾ |
|
the US business performing slightly below target on the Return Measure due to an increase in manufacturing costs (caused by the accelerated commissioning of new capacity and overall performance of the network lagging
fiscal year 2016 performance) as well as increased investment in the marketing development program; |
| ◾ |
|
the US business performing above target on the Interiors Factor and below target on the “Wood-look” Factor; |
| ◾ |
|
Asia Pacific performing above target on the Return Measure due to higher returns in Australia, partially offset by performance in New Zealand and the Philippines; and |
| ◾ |
|
Asia Pacific performing below target on the Growth Measure. |
In regards to the IP Plan, the Senior Executive
Officers’ performance and the subsequent STI payouts for fiscal year 2017 were generally at or below target based on each Senior Executive Officer’s achievement of fiscal year 2017 one-year individual performance and core organisational
values goals.
For fiscal year 2017, the amount to be paid to each of our Senior Executive Officers under the STI Plans is provided in the STI Award column of the
remuneration table, in the section titled “Remuneration Paid to Senior Executive Officers”. The percentage of the maximum STI Variable Remuneration awarded to or forfeited by each Senior Executive Officer for (individual and company)
performance in fiscal year 2017 compared to fiscal year 2016 was:
8
|
|
|
|
|
|
|
|
|
| |
|
STI AWARD 1 |
|
| |
|
AWARDED
%
|
|
|
FORFEITED
%
|
|
| L Gries |
|
|
|
|
|
|
|
|
| Fiscal Year 2017 |
|
|
33 |
|
|
|
67 |
|
| Fiscal Year 2016 |
|
|
76 |
|
|
|
24 |
|
| M Marsh |
|
|
|
|
|
|
|
|
| Fiscal Year 2017 |
|
|
35 |
|
|
|
65 |
|
| Fiscal Year 2016 |
|
|
76 |
|
|
|
24 |
|
| M Fisher |
|
|
|
|
|
|
|
|
| Fiscal Year 2017 |
|
|
33 |
|
|
|
67 |
|
| Fiscal Year 2016 |
|
|
74 |
|
|
|
26 |
|
| S Gadd |
|
|
|
|
|
|
|
|
| Fiscal Year 2017 |
|
|
34 |
|
|
|
66 |
|
| Fiscal Year 2016 |
|
|
76 |
|
|
|
24 |
|
| J Blasko |
|
|
|
|
|
|
|
|
| Fiscal Year 2017 |
|
|
35 |
|
|
|
65 |
|
| Fiscal Year 2016 |
|
|
74 |
|
|
|
26 |
|
| 1 |
Awarded = % of STI Award maximum actually paid. Forfeited = % of STI Award maximum foregone. STI Award amounts are paid in cash under the CP and IP Plans. |
LTI Plans
Each year, the Remuneration Committee approves an LTI target
for all Senior Executive Officers. The approved target is allocated between three separate components to ensure that each Senior Executive Officer’s performance is assessed across factors considered important for sustainable long-term value
creation:
| ◾ |
ROCE RSUs are used as they are an indicator of high capital efficiency required over time; |
| ◾ |
Relative TSR RSUs are used as they are an indicator of our performance relative to our Peer Group; and |
| ◾ |
Scorecard LTI is an indicator of each Senior Executive Officer’s contribution to achieving our long-term strategic goals. |
Awards issued under the LTI Plans are issued pursuant to the terms of the LTIP. During fiscal year 2017, our Senior Executive Officers were granted the following awards
under the LTIP:
|
|
|
|
|
|
|
|
|
|
|
|
|
| |
|
ROCE RSUs
|
|
|
TSR RSUs
|
|
|
SCORECARD
LTI UNITS
|
|
| L Gries |
|
|
194,626 |
|
|
|
218,159 |
|
|
|
218,954 |
|
| M Marsh |
|
|
58,388
|
|
|
|
65,448
|
|
|
|
65,686
|
|
| M Fisher |
|
|
31,627 |
|
|
|
35,451 |
|
|
|
35,580 |
|
| S Gadd |
|
|
31,627
|
|
|
|
35,451
|
|
|
|
35,580
|
|
| J Blasko
|
|
|
21,895 |
|
|
|
24,543 |
|
|
|
24,632 |
|
RSUs issued under our LTI programs will be settled upon vesting in CUFS on a 1-to-1 basis. Unless the context indicates otherwise, in
this Remuneration Report when we refer to our common stock, we are referring to the shares of our common stock that are represented by CUFS.
ROCE RSUs (40% of target LTI)
The Remuneration Committee introduced ROCE RSUs in fiscal year 2013 because the US housing market had stabilised to an extent which permitted the setting of multi-year
financial metrics. The Remuneration Committee believes ROCE RSUs remain an appropriate component of the LTI Plan because they:
| ◾ |
tie the reward’s value to share price which provides alignment with shareholder interests; |
| ◾ |
promote that we earn appropriate returns on capital invested; |
| ◾ |
reward performance that is under management’s direct influence and control; and |
| ◾ |
focus management on capital efficiency as the necessary precondition for the creation of additional shareholder value. |
Consistent with fiscal years 2013 through 2016, the maximum payout for the ROCE RSUs is 200% of target LTI. ROCE is determined by dividing Adjusted EBIT by Adjusted
Capital Employed1. The ROCE hurdles will be indexed for changes to US and Asia Pacific addressable housing starts. The resulting Adjusted Capital Employed for each quarter of any fiscal year will
be averaged to better reflect Capital Employed through a year rather than at a certain point in time.
ROCE hurdles for the ROCE RSUs are based on historical results
and take into account the recovering US housing market and better optimisation of our manufacturing plants. The three-year average ROCE for fiscal years 2014, 2015 and 2016 was 27.6%.
The hurdles for ROCE RSUs granted in fiscal year 2017 (for performance in fiscal years 2017 to 2019) were changed from those granted in fiscal year 2016 as follows:
|
|
|
|
|
|
|
| FISCAL YEARS
2016-2018 ROCE
|
|
FISCAL YEARS
2017-2019 ROCE |
|
% OF ROCE
RSUs
GRANTED
TO
VEST |
|
| < 23.0% |
|
< 24.0% |
|
|
0% |
|
| > 23.0%, but < 25.0% |
|
> 24.0%, but < 26.0% |
|
|
25% |
|
| > 25.0%, but < 27.5% |
|
> 26.0%, but < 28.5% |
|
|
50% |
|
| > 27.5%, but < 28.5% |
|
> 28.5%, but < 29.5% |
|
|
75% |
|
| > 28.5%
|
|
> 29.5% |
|
|
100% |
|
At the conclusion of this three-year performance period, the Remuneration Committee will review management’s performance based on
the quality of the returns balanced against management’s delivery of market share growth and performance against the Scorecard. Following this review, the Remuneration Committee can exercise negative discretion to reduce the number of shares
received on vesting of the ROCE RSUs. This discretion can only be applied to reduce the number of shares which will vest.
| 1 |
For purposes of ROCE RSU vesting, “Adjusted EBIT” and “Adjusted Capital Employed” will be calculated as follows: “Adjusted EBIT” will be calculated as (i) EBIT as reported in our
financial results; adjusted by (ii) deducting the earnings impact of legacy issues (such as asbestos adjustments and New Zealand weathertightness); and (iii) adding back asset impairment charges in the relevant period, unless otherwise
determined by the Remuneration Committee. |
“Adjusted Capital Employed” will be calculated as Total Assets minus Current
Liabilities as reported in our financial results; adjusted by: (i) excluding balance sheet items related to legacy issues (such as asbestos adjustments), dividends payable and deferred taxes; (ii) adding back asset impairment charges in
the relevant period, unless otherwise determined by the Remuneration Committee; (iii) adding back leasehold assets for manufacturing facilities and other material leased assets; and (iv) deducting all greenfield construction-in-progress,
and any brownfield construction-in-progress projects involving capacity expansion that are individually greater than US$20 million, until such assets reach commercial production and are transferred to the fixed asset register.
9
JAMES HARDIE REMUNERATION REPORT
2017
REMUNERATION REPORT 2017 CONTINUED
ROCE RSUs Vesting in Fiscal Year 2017
(For Fiscal Years 2014-2016)
As a component of the fiscal year 2014
LTI Plan, we granted ROCE RSUs in September 2013. The ROCE RSUs comprised 40% of each Senior Executive Officer’s LTI target and were granted assuming maximum performance (200% of target). Vesting of the ROCE RSUs is dependent on the average
ROCE performance for fiscal years 2014-2016 and is subject to the Remuneration Committee’s negative discretion based on its judgment regarding the quality of returns balanced against management’s delivery of market share growth. The ROCE
performance hurdles for this grant were approved as follows:
|
|
|
|
|
| ROCE PERFORMANCE LEVEL |
|
% OF ROCE RSUs
GRANTED TO VEST |
|
| < 19.5% |
|
|
0% |
|
| ³
19.5%, but < 21.0% |
|
|
25% |
|
| ³
21.0%, but < 22.5% |
|
|
50% |
|
| ³
22.5%, but < 24.0% |
|
|
75% |
|
| ³ 24.0% |
|
|
100% |
|
Based solely on the average ROCE result for fiscal years 2014-2016 of 27.6%, 100% of the ROCE RSUs granted (or 200% of target) would have
vested. However, based on the Remuneration Committee’s assessment of the quality of returns balanced against management’s delivery of market share growth, the Remuneration Committee determined that it would apply negative discretion in the
amount of 35%. As such, 65% (or 130% of target) of the outstanding fiscal year 2014 ROCE RSUs vested on 16 September 2016. Unvested ROCE RSUs from this grant were forfeited.
ROCE RSUs Vesting for Fiscal Years 2015-2017
As a component of the
fiscal year 2015 LTI Plan, we granted ROCE RSUs in September 2014. The ROCE RSUs comprised 40% of each Senior Executive Officer’s LTI target and were granted assuming maximum performance (200% of target). Vesting of the ROCE RSUs is dependent
on the average ROCE performance for fiscal years 2015-2017 and is subject to the Remuneration Committee’s negative discretion based on its judgment regarding the quality of returns balanced against management’s delivery of market share
growth. The ROCE performance hurdles for this grant were approved as follows:
|
|
|
|
|
| ROCE PERFORMANCE LEVEL |
|
% OF ROCE RSUs
GRANTED TO VEST |
|
| < 22.0% |
|
|
0% |
|
| ³
22.0%, but < 24.5% |
|
|
25% |
|
| ³
24.5%, but < 27.0% |
|
|
50% |
|
| ³
27.0%, but < 28.5% |
|
|
75% |
|
| ³ 28.5% |
|
|
100% |
|
Based solely on the average ROCE result for fiscal years 2015-2017 of 29.9%, 100% of the ROCE RSUs granted (or 200% of target) would have
vested. However, based on the Remuneration Committee’s assessment of the quality of returns balanced against management’s delivery of market share growth, the Remuneration Committee determined that it would apply negative discretion in the
amount of 40%. As such, 60% (or 120% of target) of the outstanding fiscal year 2015 ROCE RSUs will vest on 16 September 2017. Unvested ROCE RSUs from this grant will be forfeited.
Relative TSR RSUs (30% of target LTI)
The Remuneration Committee believes that Relative TSR RSUs continue to be an appropriate component of the LTI Plan because they provide alignment with shareholders. Even
if macro-economic conditions create substantial shareholder value, Senior Executive Officers will only receive payouts if the TSR of our shares exceeds a specified percentage of our Peer Group over a performance period.
We have used Relative TSR RSUs in our LTI Plan since fiscal year 2009. Consistent with fiscal years 2013 through 2016, the maximum payout for Relative TSR RSUs granted in
fiscal year 2017 is 200% of target LTI.
Relative TSR measures changes in our share price and the share prices of our Peer Group; and assumes all dividends and
capital returns are reinvested when paid. For fiscal year 2017, our relative TSR performance will be measured against the Peer Group over a 36 to 54 month period from grant date, with testing at the 36th month, 48th month and at the end of the 54
month period. To eliminate the impact of short-term share price changes, the starting point and each test date are measured using a 20 trading-day average closing price. Relative TSR RSUs will vest based on the following straight-line schedule:
|
|
|
|
|
| PERFORMANCE AGAINST
PEER GROUP |
|
% OF RELATIVE TSR RSUs
GRANTED TO VEST |
|
| < 40th Percentile |
|
|
0% |
|
| 40th Percentile |
|
|
25% |
|
| > 40th, but < 60th Percentile |
|
|
Sliding Scale |
|
| 60th Percentile |
|
|
50% |
|
| > 60th, but < 80th Percentile |
|
|
Sliding Scale |
|
| ³ 80th Percentile |
|
|
100% |
|
For the fiscal year 2018 Relative TSR RSU component, the Remuneration Committee has determined that relative TSR performance will be
measured against the Peer Group over a 36 month period only. A complete description of the changes to our fiscal year 2018 LTI program is set out in the section titled “Changes to LTI Variable Compensation for Fiscal Year 2018” later in
this Remuneration Report. The Remuneration Committee will continue to monitor the design of the Relative TSR RSU component of the LTI Plan for Senior Executive Officers with the aim of balancing investor preferences with the ability to motivate and
retain Senior Executive Officers.
TSR RSUs Vesting in Fiscal Year 2017
As part of the fiscal year 2012 LTI Plan, in September 2011 we granted five year Relative TSR RSUs to senior executives. Vesting of these Relative TSR RSUs was dependent
on our TSR performance relative to a set peer group, based on the following schedule:
|
|
|
|
|
| PERFORMANCE AGAINST
PEER GROUP |
|
% OF RELATIVE TSR RSUs
GRANTED TO VEST |
|
| < 50th Percentile |
|
|
0% |
|
| 50th Percentile |
|
|
33% |
|
| ³
51st, but < 75th Percentile |
|
|
Sliding Scale |
|
| ³ 75th Percentile |
|
|
100% |
|
In September 2016, the final test of relative TSR performance was completed, resulting in our TSR performance at just over the 65th
percentile of the peer group. This brought the total vesting percentage for these grants over the five-year performance period to 74% of the Relative TSR RSUs granted (or 222% of target). The remaining unvested Relative TSR RSUs from this grant were
forfeited.
10
As part of the fiscal year 2013 LTI Plan, in September 2012 we granted five year Relative TSR RSUs to senior executives.
Vesting of these Relative TSR RSUs was dependent on our TSR performance relative to a set peer group, based on the following schedule:
|
|
|
|
|
| PERFORMANCE AGAINST
PEER GROUP |
|
% OF RELATIVE TSR RSUs
GRANTED TO VEST |
|
| < 40th Percentile |
|
|
0% |
|
| ³
40th, but < 60th Percentile |
|
|
Sliding Scale |
|
| 60th Percentile |
|
|
50% |
|
| > 60th, but < 80th Percentile |
|
|
Sliding Scale |
|
| ³ 80th Percentile |
|
|
100% |
|
In September 2016, the third test of relative TSR performance was completed, resulting in our TSR performance at just above the 83rd
percentile of the peer group. This brought the total vesting percentage for these grants to 100% of the Relative TSR RSUs granted (or 200% of target).
As part of
the fiscal year 2014 LTI Plan, in September 2013 we granted four and a half year Relative TSR RSUs to Senior Executive Officers. Vesting of these Relative TSR RSUs was dependent on our TSR performance relative to a set peer group, based on the
following schedule:
|
|
|
|
|
| PERFORMANCE AGAINST
PEER GROUP |
|
% OF RELATIVE TSR RSUs
GRANTED TO VEST |
|
| < 40th Percentile |
|
|
0% |
|
| 40th Percentile |
|
|
25% |
|
| > 40th, but < 60th Percentile |
|
|
Sliding Scale |
|
| 60th Percentile |
|
|
50% |
|
| > 60th, but < 80th Percentile |
|
|
Sliding Scale |
|
| ³ 80th Percentile |
|
|
100% |
|
In September 2016, the first test of relative TSR performance was completed, resulting in our TSR performance at just above the 91st
percentile of the peer group. As a result, 100% of the outstanding Relative TSR RSUs (or 200% of target) vested.
Scorecard LTI (30% of target LTI)
Scorecard LTI have been a component of our LTI Plan since fiscal year 2010. Each year, the Remuneration Committee approves a number of key management
objectives and the measures it expects to see achieved in relation to these objectives. These objectives are incorporated into that year’s grant of Scorecard LTI. At the end of the three-year performance period, the Remuneration Committee
assesses our Senior Executive Officers’ collective performance on each key objective and each individual Senior Executive Officer’s contribution to those achievements (with scores between 0 and 100) and the Board reviews this assessment.
Senior Executive Officers may receive different ratings depending on the contribution they have made during the three-year performance period. Although most of the objectives in the Scorecard have quantitative targets, we consider some of the
targets to be commercial-in-confidence. Consistent from fiscal year 2010, the maximum payout for Scorecard LTI is 300% of target LTI.
The Remuneration Committee believes that the Scorecard LTI continues to be an appropriate component of its LTI Plan because
it:
| ◾ |
allows the Remuneration Committee to set targets for and reward executives on a balance of longer-term financial, strategic, business, customer and organisational development goals which it believes are important
contributors to long-term creation of shareholder value; |
| ◾ |
ties the reward’s value to our share price over the medium-term; and |
| ◾ |
allows flexibility to apply rewards across different countries, while providing Senior Executive Officers with liquidity to pay tax or other material commitments at a time that coincides with vesting of shares (via the
other components of the LTI Plan) as payment is in cash. |
No specific weighting is applied to any single objective and the final Scorecard assessment
reflects an element of judgment by the Board. The Board may only exercise negative discretion (i.e., to reduce the amount of Scorecard LTI that will ultimately vest). It cannot enhance the maximum reward that can be received.
The amount received by Senior Executive Officers is based on both our share price performance over the three years from the grant date and the Senior Executive
Officer’s Scorecard rating. At the start of the three-year performance period, we calculate the number of shares each Senior Executive Officer could have acquired if they received a maximum payout on the Scorecard LTI at that time (based on a
20 trading-day average closing price). Depending on the Senior Executive Officer’s rating (between 0 and 100), between 0% and 100% of the Senior Executive Officer’s Scorecard LTI awards will vest at the end of the three-year performance
period. Each Senior Executive Officer will receive a cash payment based on our share price at the end of the period (based on a 20 trading-day average closing price) multiplied by the number of shares they could have acquired at the start of the
performance period, adjusted downward in accordance with their Scorecard rating.
Further details related to the Scorecard for fiscal year 2017, including the method
of measurement, historical performance against the proposed measures and the Board of Director’s expectations, were previously set out in our Remuneration Report for fiscal year 2016. An assessment of our Scorecard performance for fiscal years
2015-2017 is set out below. We will provide an explanation of the final assessment of performance under the Scorecard for fiscal years 2017-2019 at the conclusion of fiscal year 2019.
11
JAMES HARDIE REMUNERATION REPORT
2017
REMUNERATION REPORT 2017 CONTINUED
Scorecard LTI for Fiscal Years 2015-2017
After fiscal year 2017, the Remuneration Committee reviewed our performance over fiscal years 2015-2017 against the Scorecard objectives set forth in fiscal year 2015,
and the contribution of individual Senior Executive Officers towards the achievement of such objectives. As a result of this evaluation, the Remuneration Committee determined that Senior Executive Officers would receive a weighted average Scorecard
rating of 53.4% (with a range of 33% to 58%).
|
|
|
|
|
|
|
|
|
|
|
|
|
| PERFORMANCE MEASURE/RATIONALE |
|
PERFORMANCE METRIC/RESULTS
|
|
|
BOARD ASSESSMENT FOR
THE
THREE-YEAR PERIOD |
|
|
|
| Grow exterior cladding market share and maintain category share in the US
business A key strategy for the Company is to maximise its market share
growth/ retention of the exterior cladding market for new housing starts and for repair & remodel markets. |
|
Goal: PDG above market.
Outperformance against ‘wood-look’ competition.
Result: PDG performance at the Board requirement. Growth above key competition and an increase in exterior cladding market share above the Board requirement.
|
|
|
Performance exceeded expectations |
|
|
|
| Build US organisational and leadership capability in support of the 35/90 growth
target The amount of growth that 35/90 entails requires lower turnover
levels and an increase in management depth and organisational capability. |
|
Goal: Satisfactory progress on turnover, engagement initiatives and programs to build
organisational capability demonstrated by greater bench strength of high performing managers.
Result: Increase in total turnover over the three year period, however have seen a positive trend on turnover for salaried employees. Some progress made on
developing bench strength, although additional recruiting, mentoring career development and leadership programs are required to further build bench strength and overall organisational capability.
|
|
|
Performance below expectations |
|
|
|
| Manufacturing effectiveness and sourcing efficiency
The Company operates a national US network of manufacturing facilities. |
|
Goal: Commercial-in-confidence metrics for product and process efficiency and material
yield used to confirm manufacturing performance and progress as well as service levels is effectively supporting our product leadership strategy.
Result: Product and process efficiency above Board expectations for the three year period and material yield slightly below Board expectations. Service levels
above Board expectations for two of three fiscal years, however this was offset by a drop off in service levels during fiscal year 2017 due to supply/ capacity constraints.
|
|
|
Performance met expectations |
|
|
|
| Safety
The safety of our employees is an essential objective of the Company. |
|
Goal: No fatalities, 2.0 or below incident rate (“IR”) and 20.0 or below severity rate (“SR”).
|
|
|
Performance met expectations |
| |
|
Result: |
|
IR |
|
|
SR |
|
|
|
|
|
FY2017 |
|
|
1.4 |
|
|
|
20.5 |
|
|
|
|
|
FY2016 |
|
|
1.8 |
|
|
|
42.4 |
|
|
|
|
|
FY2015 |
|
|
1.3 |
|
|
|
11.0 |
|
|
|
| |
|
|
|
|
|
|
|
|
|
|
|
|
12
|
|
|
|
|
|
|
|
|
| PERFORMANCE MEASURE/RATIONALE
|
|
PERFORMANCE METRIC/RESULTS
|
|
BOARD ASSESSMENT FOR
THE
THREE-YEAR PERIOD |
|
|
|
| Maintain market position on core products in Australian and NZ Markets and grow Scyon
to greater proportion of Australian business Value creating
opportunity. |
|
Goal: Grow category share on core Australian and New Zealand products, grow PDG in
Australia and New Zealand, and achieve growth of Scyon as a percentage of the Australian business.
Result: APAC business has maintained and grown market position in Australia and NZ markets over the period driven by a new management focus on new products and
segments, and a substantial investment in management capability and marketing programs. Scyon grew as a percentage of the Australian business over the three-year period. |
|
Performance met expectations |
|
|
|
| Global capacity expansion
Expansion to support expected growth over the next 20 years. |
|
Goal: Completion of building construction, equipment installation and start up at
identified sites. Result: The Company expanded global nameplate capacity by ~20%
during the three year period. The Company added four brownfield sheet machines in North America and a new sheet machine and new finishing lines in Carole Park over the three year period. The Company’s returns will significantly benefit from
identification of brownfield capacity versus adding more expensive greenfield capacity. |
|
Performance met expectations |
|
|
|
| Strategic positioning
Developing sustainable growth beyond the Company’s traditional markets may
create shareholder value through increased profits and diversification for lower risk. |
|
Goal: This measure is subjective and achievement can take many different forms, including
developing new technologies, expanding into new product categories, or expanding geographically.
Result: Plans in place to move forward with additional product offerings which show great potential in terms of market acceptance and profitability. Additionally,
the Europe business grew volume and expanded market position during the period, including expanding into Germany. |
|
Performance exceeded expectations |
|
|
|
| Customer experience
Necessary to support the Company’s 35/90 strategy. |
|
Goal: Demonstrated improvement in the customer experience based on measures set in fiscal
year 2015. Result: Customer experience initiatives met expectations. The Customer
Experience team was disbanded and the initiatives distributed within operations. Operations has had success in continuing to execute on the customer experience strategy. |
|
Performance met expectations |
|
|
|
| Defend market share position against key wood-look competitor
Necessary to support the Company’s 35/90 strategy. |
|
Goal: Outgrow key wood-look competitors in specific markets in the aggregate measured on a
calendar year basis. Result: By the end of the three-year period, the Company
outgrew key wood-look competition in the relevant market. |
|
Performance met expectations |
|
|
|
| Trim market strategy implementation
Developing sustainable growth beyond the Company’s traditional
products. |
|
Goal: Commercial-in-confidence targets will be reviewed to confirm progress is supporting
the Company’s trim market strategy. Result: Some progress made. Performance
for the three-year period is above the prior three-year period. |
|
Performance met expectations |
13
JAMES HARDIE REMUNERATION REPORT
2017
REMUNERATION REPORT 2017 CONTINUED
CHANGES TO REMUNERATION FOR FISCAL YEAR 2018
Remuneration for Fiscal Year 2018
During May 2017, the Board, with the
assistance of the Remuneration Committee and its independent remuneration advisers, undertook its annual review of our existing remuneration policies, programs and arrangements and determined to implement certain changes for fiscal year 2018.
CEO Compensation
For fiscal year 2018, there will be no
changes to the CEO’s base salary, target STI or target LTI.
Other Senior Executive Officer Compensation
Base pay, and target LTI increases in fiscal year 2018 for other Senior Executive Officers, excluding Mr Fisher who resigned from James Hardie effective 3 April 2017
and did not receive any pay adjustments, are as follows:
|
|
|
|
|
|
|
|
|
|
|
|
|
|
|
|
|
| |
|
BASE SALARY |
|
|
TARGET LTI |
|
| NAME |
|
FISCAL
YEAR 2017
(US$) |
|
|
FISCAL
YEAR 2018
(US$) |
|
|
FISCAL
YEAR 2017
(US$) |
|
|
FISCAL
YEAR 2018
(US$) |
|
| M Marsh |
|
|
560,000 |
|
|
|
600,000 |
|
|
|
1,200,000 |
|
|
|
No change |
|
| S Gadd |
|
|
408,000 |
|
|
|
500,000 |
|
|
|
650,000 |
|
|
|
800,000 |
|
| J Blasko |
|
|
405,000 |
|
|
|
425,000 |
|
|
|
450,000 |
|
|
|
500,000 |
|
There are no changes to target STI for other Senior Executive Officers for fiscal year 2018. The base salary increase for Mr Marsh was
made to continue to align his compensation package with our CEO succession plan and our need to retain key senior executives through the eventual CEO transition process. Base salary and LTI target increases for Mr Gadd were made to properly align
his overall compensation package with the increase in role scope and accountability that occurred for Mr Gadd during fiscal year 2017. The base salary increase for Mr Blasko was made in line with our annual compensation review guidelines and were
adjusted as required to maintain positioning relative to market merit increase levels. The small increase to Mr Blasko’s LTI target was made to better align his LTI target value with the 75th percentile of the market, consistent with our
remuneration philosophy.
STI Plans
There will be
no changes to the operation of the IP or CP Plans for fiscal year 2018 other than to establish new commercial-in-confidence targets aligned with our strategic initiatives as we do every year.
LTI Plan
The Remuneration Committee believes the three
components of the LTI Plan continue to (i) align management objectives with shareholder interests (Relative TSR RSU component), (ii) promote the appropriate internal management behaviours related to operating efficiency and the
profitability of JHIplc’s assets (ROCE RSU component), and (iii) emphasise strategic long-term priorities (Scorecard LTI component). As such, the fiscal year 2018 LTI Plan will continue to be comprised of these three components. However,
after careful consideration of strategic priorities, as well as investor feedback and LTI Plan design alternatives, the Remuneration Committee has made the following changes to the design of the LTI Plan for fiscal year 2018:
| ◾ |
shifted the allocation of LTI target amongst the three components of the LTI plan as follows: |
|
|
|
|
|
|
|
|
|
| LTI COMPONENT |
|
FY2017 |
|
|
FY2018 |
|
| ROCE RSUs |
|
|
40% |
|
|
|
25% |
|
| Relative TSR RSUs |
|
|
30% |
|
|
|
25% |
|
| Scorecard LTI |
|
|
30% |
|
|
|
50% |
|
| ◾ |
increased the ROCE performance hurdles; and |
| ◾ |
removed the re-testing feature from the Relative TSR RSU awards such that there is only one test of relative TSR performance on the third anniversary of the grant date and no re-tests. |
The Remuneration Committee made these changes to strike a balance of strategic and operational performance with financial and share price performance metrics within the
LTI Plan (re-allocation of the LTI target amongst the three components), reflect the Board’s requirement for improved ROCE, and address shareholder concerns (removal of the re-testing feature).
The Board and Remuneration Committee feel the LTI Plan for fiscal year 2018 will continue to have the desired effect of balancing the short-term focus of base salaries
and the STI program by tying equity-based rewards to performance achieved over multi-year periods and aligning equity incentives with long-term shareholder interests.
The 2017 Notice of AGM contains further details on the Relative TSR RSU and ROCE RSU grants for fiscal year 2018. Changes to ROCE performance hurdles and Scorecard
objectives for fiscal year 2018 are set forth below.
Changes to LTI Variable Compensation for Fiscal Year 2018
ROCE RSUs
To reflect the Board’s requirement
for improved and sustainable operational efficiencies, the Remuneration Committee increased the hurdles for fiscal year 2018 ROCE RSUs (for performance in fiscal years 2018 to 2020) from the hurdles for fiscal year 2017 ROCE RSUs, thereby making it
more difficult to achieve minimum, at target and maximum vesting:
|
|
|
|
|
|
|
| FISCAL YEARS
2018-2020 ROCE |
|
FISCAL YEARS
2017-2019 ROCE |
|
% OF ROCE RSUs
GRANTED TO VEST |
|
| < 25.0% |
|
< 24.0% |
|
|
0% |
|
| > 25.0%, but < 27.0% |
|
> 24.0%, but < 26.0% |
|
|
25% |
|
| > 27.0%, but < 29.5% |
|
> 26.0%, but < 28.5% |
|
|
50% |
|
| > 29.5%, but < 30.5% |
|
> 28.5%, but < 29.5% |
|
|
75% |
|
| > 30.5% |
|
> 29.5% |
|
|
100% |
|
Relative TSR RSUs
The Remuneration Committee has removed the re-testing feature such that relative TSR performance for fiscal year 2018 Relative TSR RSUs is tested once on the third
anniversary of the grant date. Any awards which do not vest based on this performance test will be forfeited.
14
Scorecard LTI
The Remuneration Committee has set the following six fiscal year 2018 Scorecard goals (for performance in fiscal years 2018 to 2020) to ensure alignment with our
strategic priorities:
|
|
|
|
|
|
|
|
|
| PERFORMANCE GOAL/RATIONALE |
|
PERFORMANCE METRIC |
|
BOARD EXPECTATION |
|
|
|
| Market Position: Growing market share in all our businesses and geographies.
A key strategy for the Company is to maximise market share of the exterior
cladding market for new housing starts and for repair & remodel markets in North America, while maintaining 90% category share. |
|
Our PDG performance for exterior cladding compared to the underlying market (in standard feet) and outperformance of key competition. |
|
PDG growth above market and outperformance against key competition. |
|
|
|
| People: Continue to invest in the development and promotion of our people.
The ability for the Company to realise its growth potential and deliver results
in line with shareholder expectations requires lower turnover, an increase in management depth, and greater organisational capability. |
|
A range of factors including the rate of salaried turnover, execution of programs to build organisational capability and bench strength for key roles, and succession
planning. |
|
Continued focus on turnover and engagement initiatives, success in external recruitment, onboarding of key positions and programs to build organisational capability, and development
of/successful execution on a management team succession plan. |
|
|
|
| Safety
The safety of our employees is an essential objective of the Company. |
|
Incident Rate (IR): Recordable incidents per 200,000 hours worked.
Severity Rate (SR): Days lost per 200,000 hours worked. |
|
Zero fatalities.
IR: 2.0 or below.
SR: 20.0 or below. |
|
|
|
| Deliver on Brand Promise: An unrivalled commitment to research and development;
maintaining our manufacturing cost advantage; delivering industry leading quality and service levels; investing in future manufacturing capability and capacity; utilising technology to better improve our customers’ experiences with us; and
ensuring we meet our financial returns objective. Adequate capacity, and
effective machine utilisation, product quality, and service are critical to delivering future growth and optimising returns through a more efficient manufacturing network. |
|
Completion of capacity projects on budget and schedule. First pass quality and service, as well
as sheet machine product and process efficiency metrics. Manufacturing performance data is
commercial-in-confidence. |
|
Commercial-in-confidence targets will be reviewed to confirm progress is supporting the Company’s product leadership strategy. |
|
|
|
| International: Pursue organic growth in all International markets. Value
creating opportunity. |
|
Category share and PDG.
Continued growth of Scyon and introduction and growth of new products in Asia Pacific. |
|
Grow category share on core Australian and New Zealand products.
Grow PDG in Australia and New Zealand.
Achieve growth in Scyon as well as the introduction of new products in Asia Pacific. |
|
|
|
| Non-fiber Cement Business Development: Develop other streams of growth
beyond fiber cement. Long-term growth of James Hardie in part requires growth
businesses beyond core fiber cement. |
|
This measure is subjective and achievement can take many different forms, including developing a vision or business development framework, new technologies, or expanding into
new product categories. |
|
Progress against this goal will be reviewed to ensure any progress is supporting the Company’s position in the non-fiber cement marketplace. |
15
JAMES HARDIE REMUNERATION REPORT
2017
REMUNERATION REPORT 2017 CONTINUED
OTHER EXECUTIVE COMPENSATION PRACTICES
Clawback Provisions
The Remuneration Committee has established an executive
performance-based compensation clawback policy in connection with performance-based compensation paid or awarded to certain executives. The clawback policy provides that the Board may, in all appropriate circumstances, recover from any current or
former executive regardless of fault, that portion of any performance-based compensation erroneously awarded: (i) based on financial information required to be reported under applicable US or Australian securities laws or applicable exchange
listing standards that would not have been paid in the three completed fiscal years preceding the year(s) in which an accounting restatement is required to correct a material error; or (ii) during the previous three completed fiscal year as a
result of any errors or omissions in objective, calculable performance measures contained in formal papers presented to and relied upon by the Board for purposes of determining compensation to be paid or awarded, where the absence of such errors or
omissions would have resulted in there being a material negative impact on the amount of performance-based compensation paid or awarded. The clawback policy applies to any person designated as a participant by the Board in the annual LTI Plan and
applies to any compensation that is granted, earned or vested based wholly or in part upon the attainment of any financial or other objective, calculable performance measure under any incentive, bonus, retirement or equity compensation plan
maintained by the Company, including, without limitation, the STI Plan and LTI Plan. Salaries, discretionary bonuses, time-based equity awards and bonuses or equity awards based on subjective, non-financial measures, including strategic or personal
performance metrics, are excluded.
The excess compensation requiring recovery shall be the amount of performance-based compensation that an executive received, based
on the erroneous data, less the amount that would have been paid to the executive based on the restated or corrected data. All recoverable amounts shall be calculated on a pre-tax basis. For equity awards still held at the time of the recovery, the
recoverable amount shall be the amount vested in excess of the number that should have vested under the restated or corrected financial reporting measure. For vested equity awards which have already been sold, the recoverable amount shall be the
sale proceeds the executive received with respect to the excess number of shares.
In addition, all LTI grants made to Messrs Gries, Marsh and Fisher were subject to
a specific clawback provision for violation of a limited non-compete provision that specifically prohibits executives from working for designated competitors or for any company that may enter the fiber cement market within two years of departure.
Stock Ownership Guidelines
The Remuneration Committee believes that
Senior Executive Officers should hold a meaningful level of our stock to further align their interests with those of our shareholders. We have adopted stock ownership guidelines for the CEO and other Senior Executive Officers, respectively, which
require them to accumulate holdings of three times and one times their base salary, respectively, in our stock over a period of five years from the effective date of the guidelines (1 April 2009) or the date the Senior Executive Officer first
becomes subject to the applicable guideline.
Until the stock ownership guidelines have been met, Senior Executive Officers are required to retain at least 75% of
shares obtained under our LTI Plans (net of taxes and other costs). Once Senior Executive Officers have met or exceeded their stock ownership guidelines, they are required to retain at least 25% of shares issued under our LTI Plans through the
vesting of RSUs (net of taxes and other costs) for a period of two years
(by way of a holding lock), after which time those shares can be sold (provided the Senior Executive Officer remains at or
above the stock ownership guideline).
As of 31 March 2017, all Senior Executive Officers have achieved the minimum share accumulation threshold.
Equity Award Practices
Annual equity awards under the LTI Plan are generally
approved by the Remuneration Committee in May of each year with awards generally issued in September of each year. We do not time the granting of equity awards to the disclosure of material information.
For details of the application of our insider-trading policy for equity award grant participants, including our prohibition on employee hedging transactions, see the
“Insider Trading” section of our 2017 Annual Report.
Loans
We
did not grant loans to Senior Executive Officers during fiscal year 2017. There are no loans outstanding to Senior Executive Officers.
EMPLOYMENT AND SEVERANCE ARRANGEMENTS
During
fiscal year 2017, we maintained employment agreements with each of Messrs Gries, Marsh and Fisher. Mr Fisher resigned from his employment on 3 April 2017, and as a result, his employment agreement is no longer in effect. Other than as provided
under the terms of their respective employment agreements, no other termination payments are payable, except as required under the terms of the applicable STI or LTI plans.
Employment Agreement with Louis Gries
Below is a summary of the key terms of
Mr Gries’ current employment agreement:
| ◾ |
Executive Employment Agreement renewed effective as of 14 October 2010 providing for service as Chief Executive Officer. |
| ◾ |
Mr Gries is an employee-at-will and either he or the Company may terminate his employment at any time or any reason. |
| ◾ |
Base salary at an initial annual rate of US$950,000, subject to annual review and approval by the Remuneration Committee. |
| ◾ |
Participation in the Company’s annual STI and LTI Plans, with a minimum STI target of 100% of his annual base salary, as established by the Company’s Board. |
| ◾ |
Participation in the Company’s benefit, health and welfare plans and certain fringe benefits made generally available to Senior Executive Officers in accordance with his agreement and Company policies.
|
| ◾ |
Provisions concerning consequences of termination of employment under specified circumstances, including: (i) termination by the Company for cause; (ii) termination by reason of death or disability;
(iii) retirement; (iv) termination by the Company without cause or by Mr Gries with good reason; or (v) termination by Mr Gries without good reason. |
| ◾ |
In the event that Mr Gries’ employment is terminated by the Company for any reason other than for cause, or if Mr Gries voluntarily terminates his employment for good reason, the Company shall pay to Mr Gries, in
addition to any compensation or reimbursements he would otherwise be entitled to up to the date of termination: (i) an amount equal to 150% of his then current base salary; (ii) an amount equal to 150% of his average annual STI bonus
actually paid, calculated based on the three full fiscal years immediately preceding the year of termination; (iii) his prorated bonus; (iv) no pro rata forfeiture of his unvested RSUs/Scorecard LTI grants – these will vest in
accordance with the terms and timing of the specific grants; and (v) continuation |
16
| |
of health and medical benefits at the Company’s expense for the duration of the consultation agreement referenced below, provided that Mr Gries signs the Company’s release of claims without revocation and has
been and continues to remain in compliance with his confidentiality and non-competition obligations as set forth in this agreement. |
| ◾ |
In the event of Mr Gries’ retirement after the age of 65, or prior to age 65 with the approval of the Board, his then unvested RSUs and awards will not be forfeited and will be held through the applicable testing
periods. |
| ◾ |
In the event that Mr Gries’ employment is terminated for any reason other than by the Company for cause or due to his death, in addition to any severance payment he may be entitled to as set forth above, the
Company and Mr Gries each agree to enter into a consulting arrangement for a minimum of two years, as long as Mr Gries adheres to certain non-competition and confidentiality provisions and executes a release of claims following the effective date of
termination. Under the consulting agreement, Mr Gries will receive his annual target STI bonus and annual base salary in exchange for his consulting services and non-compete. |
Employment Agreement with Matthew Marsh
Below is a summary of the key terms
of Mr Marsh’s current employment agreement:
| ◾ |
Effective 15 May 2016, the Company entered into an employment agreement with Mr Marsh (the “Marsh Agreement”), which has an initial term of three years and automatic one year renewals thereafter
unless either Mr Marsh or the Company notifies the other party at least 90 days before the expiration date that the Marsh Agreement is not to be renewed. In the event that the Company is the party that determines not to renew, such non-renewal shall
be treated as a termination without “Cause” (as defined in the Marsh Agreement) and subject to the termination without “Cause” provisions of the Marsh Agreement. |
| ◾ |
The Marsh Agreement provides for a base salary of not less than US$560,000, or such greater amount as may be established by the Remuneration Committee, for Mr Marsh. The base salary shall be reviewed annually for
increase in the discretion of the Remuneration Committee. Additionally, Mr Marsh shall be eligible for an annual STI award with payout opportunities that are commensurate with his position and duties, with a minimum target annual STI award
opportunity of not less than 70% of his current base salary. Mr Marsh shall also be eligible to participate in our annual LTI plan on terms commensurate with his position and duties, with a minimum annual target LTI award opportunity of not less
than US$1,200,000. |
| ◾ |
Mr Marsh shall be eligible for participation in our employee benefit, health and welfare plans and certain fringe benefits made generally available to Senior Executive Officers in accordance with Company policies.
|
| ◾ |
The Marsh Agreement contains provisions concerning the consequences of termination of employment under specified circumstances, including: (i) termination by the Company for Cause; (ii) termination by reason
of death or disability; (iii) termination by the Company without Cause or by Mr Marsh with “Good Reason” (as defined in the Marsh Agreement); or (iv) termination by Mr Marsh without Good Reason. In particular, in the event the
Company terminates Mr Marsh without Cause or Mr Marsh voluntarily terminates for Good Reason, Mr Marsh shall be entitled to: (i) a lump-sum amount equal to his unpaid base salary through and including the date of termination, as well as
accrued, unused vacation pay and unreimbursed business expenses; (ii) a payment for any earned but unpaid annual incentive award for a completed calendar year prior to the date of termination; (iii) salary continuation for the two
|
| |
year period following the date of termination, provided the aggregate amount of such continuation payments shall be equal to the sum of (A) two times the base salary plus (B) one times the annual incentive
award opportunity, as then in effect; (iv) an amount, if any, with respect to the annual incentive award opportunity for the year in which such termination of employment occurs, as determined under the terms and conditions of the Company’s
annual incentive program(s); (v) all outstanding equity awards will remain subject to the terms and conditions of the applicable equity incentive plan and any corresponding award agreement(s); (vi) monthly payments for a period of 18
months equal to the premium Mr Marsh would be required to pay for COBRA continuation coverage under the James Hardie’s health benefit plans, determined using the COBRA premium rate in effect for the level of coverage that Mr Marsh has in place
immediately prior to termination; and (vii) the Company will assist Mr Marsh in finding other employment opportunities by providing to him, at James Hardie’s limited expense, reasonable professional outplacement services through the
provider of James Hardie’s choice for a period of up to 24 months. |
| ◾ |
Pursuant to the confidentiality, non-competition and non-solicitation provisions of the Marsh Agreement, for a period of 24 months following any termination of Mr Marsh’s employment, Mr Marsh shall be prohibited
from: (i) directly or indirectly acting, engaging in, have a financial or other interest in, or otherwise serving as an employee, agent, partner, shareholder, director, or consultant for certain designated competitors of the Company; and
(ii) employing or retaining or soliciting for employment any person who is an employee or consultant of the Company or soliciting suppliers or customers of the Company or inducing any such person to terminate his, her, or its relationship with
the Company. |
Prior Employment Agreement with Mark Fisher
Prior to his resignation on 3 April 2017, we were a party to an employment agreement with Mr Fisher, which was effective as of 31 March 2006. Below is a summary
of the key terms of Mr Fisher’s prior employment agreement:
| ◾ |
Mr Fisher is an employee-at-will and either he or the Company may terminate his employment at any time or for any reason. |
| ◾ |
Base salary subject to annual review and approval by the Remuneration Committee. |
| ◾ |
Participation in the Company’s annual STI and LTI Plans, as established by the Company’s Board. |
| ◾ |
Participation in the Company’s benefit, health and welfare plans and certain fringe benefits made generally available to Senior Executive Officers in accordance with Company policies. |
| ◾ |
Provisions concerning consequences of termination of employment under specified circumstances, including: (i) termination by the Company for cause; (ii) termination by reason of death or disability;
(iii) termination by the Company without cause or by Mr Fisher with good reason; or (iv) termination by Mr Fisher without good reason. |
| ◾ |
In the event that Mr Fisher’s employment was terminated by the Company for any reason other than for cause or due to his death or if Mr Fisher voluntarily terminates his employment for good reason, in addition to
any compensation or reimbursements he would otherwise be entitled to up to the date of termination, the Company and Mr Fisher each agree to enter into a consulting arrangement for a minimum of two years, as long as Mr Fisher adheres to certain
non-competition and confidentiality provisions and executes a release of claims following the effective date of termination. Under the consulting agreement, Mr Fisher will receive his annual base salary as of the termination date for each year in
exchange for his consulting services and non-compete. |
17
JAMES HARDIE REMUNERATION REPORT
2017
REMUNERATION REPORT 2017 CONTINUED
REMUNERATION PAID TO SENIOR EXECUTIVE OFFICERS
Total Remuneration for Senior Executive Officers
Details of the remuneration
for Senior Executive Officers in fiscal years 2017 and 2016 are set out below:
|
|
|
|
|
|
|
|
|
|
|
|
|
|
|
|
|
|
|
|
|
|
|
| |
|
PRIMARY |
|
|
POST-
EMPLOYMENT |
|
EQUITY
AWARDS |
|
TOTAL |
|
| NAME |
|
BASE PAY2
(US$) |
|
|
STI AWARD3
(US$) |
|
|
OTHER
BENEFITS4
(US$) |
|
|
401(K)
(US$) |
|
ONGOING
VESTING5
(US$) |
|
MARK-TO
MARKET6
(US$) |
|
(US$) |
|
| L Gries1 |
|
|
|
|
|
|
|
|
|
|
|
|
|
|
|
|
|
|
|
|
|
|
| Fiscal Year 2017 |
|
|
979,269 |
|
|
|
1,061,625 |
|
|
|
117,701 |
|
|
15,900 |
|
6,164,203 |
|
1,678,876 |
|
|
10,017,574 |
|
| Fiscal Year 2016 |
|
|
950,000 |
|
|
|
2,424,875 |
|
|
|
134,174 |
|
|
15,919 |
|
6,283,244 |
|
1,228,260 |
|
|
11,036,472 |
|
| M Marsh |
|
|
|
|
|
|
|
|
|
|
|
|
|
|
|
|
|
|
|
|
|
|
| Fiscal Year 2017 |
|
|
569,231 |
|
|
|
370,048 |
|
|
|
77,579 |
|
|
16,454 |
|
1,339,162 |
|
241,857 |
|
|
2,614,331 |
|
| Fiscal Year 2016 |
|
|
513,846 |
|
|
|
637,104 |
|
|
|
49,233 |
|
|
16,177 |
|
965,366 |
|
67,910 |
|
|
2,249,636 |
|
| M Fisher |
|
|
|
|
|
|
|
|
|
|
|
|
|
|
|
|
|
|
|
|
|
|
| Fiscal Year 2017 |
|
|
526,231 |
|
|
|
276,246 |
|
|
|
41,030 |
|
|
8,977 |
|
848,150 |
|
198,944 |
|
|
1,899,578 |
|
| Fiscal Year 2016 |
|
|
496,923 |
|
|
|
597,600 |
|
|
|
36,657 |
|
|
16,038 |
|
753,040 |
|
126,265 |
|
|
2,026,523 |
|
| S Gadd |
|
|
|
|
|
|
|
|
|
|
|
|
|
|
|
|
|
|
|
|
|
|
| Fiscal Year 2017 |
|
|
421,231 |
|
|
|
227,174 |
|
|
|
34,429 |
|
|
16,011 |
|
913,691 |
|
178,409 |
|
|
1,790,945 |
|
| Fiscal Year 2016 |
|
|
396,923 |
|
|
|
493,776 |
|
|
|
56,836 |
|
|
16,038 |
|
604,505 |
|
61,017 |
|
|
1,629,095 |
|
| J Blasko |
|
|
|
|
|
|
|
|
|
|
|
|
|
|
|
|
|
|
|
|
|
|
| Fiscal Year 2017 |
|
|
412,885 |
|
|
|
229,392 |
|
|
|
71,357 |
|
|
16,246 |
|
610,218 |
|
140,177 |
|
|
1,480,275 |
|
| Fiscal Year 2016 |
|
|
373,846 |
|
|
|
454,176 |
|
|
|
56,987 |
|
|
16,177 |
|
485,451 |
|
88,935 |
|
|
1,475,572 |
|
| TOTAL |
|
|
|
|
|
|
|
|
|
|
|
|
|
|
|
|
|
|
|
|
|
|
| Fiscal Year 2017 |
|
|
2,908,847 |
|
|
|
2,164,485 |
|
|
|
342,096 |
|
|
73,588 |
|
9,875,424 |
|
2,438,263 |
|
|
17,802,703 |
|
| Fiscal Year 2016 |
|
|
2,731,538 |
|
|
|
4,607,531 |
|
|
|
333,887 |
|
|
80,349 |
|
9,091,606 |
|
1,572,387 |
|
|
18,417,298 |
|
| 1 |
L Gries base pay includes US$189,005 and US$170,184 in fiscal years 2017 and 2016, respectively, which is allocated for tax purposes to his services on the Company’s Board. |
| 2 |
Base pay for FY2017 includes salary paid to Senior Executive Officers for the 27 bi-weekly paychecks received during FY2017 as compared to 26 bi-weekly paychecks as is typically standard in most fiscal years. This
additional bi-weekly pay period was a function of the number of bi-weekly pay dates during FY2017 only and does not represent an increase in the base salary rate for Senior Executive Officers. |
| 3 |
For further details on STI awards paid for fiscal years 2017 and 2016, see pages 8 and 9 of this Remuneration Report. Amounts reflect actual STI awards to be paid in June 2017 and paid in June 2016, for fiscal years
2017 and 2016, respectively. |
| 4 |
Includes the aggregate amount of all other benefits received in the year indicated. Examples of benefits that may be received include medical and life insurance benefits, car allowances, membership in executive wellness
programs, and financial planning and tax services. |
| 5 |
Includes equity award expense for grants of Scorecard LTI awards, relative TSR RSUs and ROCE RSUs. Relative TSR RSUs are valued using a Monte Carlo simulation method. ROCE RSUs and Scorecard LTI awards are valued based
on the Company’s share price at each balance date as well as the Remuneration Committee’s current expectation of the percentage of the RSUs or awards which will vest. The fair value of equity awards granted are included in compensation
during the period in which the equity awards vest. For ROCE RSUs and Scorecard LTI awards, this amount excludes the equity award expense in fiscal years 2017 and 2016 resulting from changes in the Company’s share price, which is disclosed
separately in the Equity Awards “Mark-to-Market” column. |
| 6 |
The amount included in this column is the equity award expense in relation to ROCE RSUs and Scorecard LTI awards resulting solely from changes in the US dollar share price during fiscal years 2017 and 2016. During
fiscal year 2017, there was a 14.9% appreciation in our share price from US$13.68 to US$15.72. During fiscal year 2016, there was a 17.4% appreciation in our share price from US$11.65 to US$13.68. |
Variable Remuneration Payable in Future Years
Details of the accounting cost
of the variable remuneration for fiscal year 2017 that may be paid to Senior Executive Officers in future years are set out below. The minimum amount payable is nil in all cases. The maximum amount payable will depend on the share price at time of
vesting, and is therefore not possible to determine. The table below is based on the fair value of the RSUs and Scorecard LTI according to US GAAP and our estimate of the rating to be applied to Scorecard LTI.
|
|
|
|
|
|
|
|
|
|
|
|
|
|
|
|
|
|
|
|
|
|
|
|
|
|
|
|
|
|
|
|
|
|
|
|
|
|
|
|
|
|
|
|
|
|
|
|
|
|
|
|
|
| |
|
SCORECARD LTI¹ |
|
|
|
|
ROCE RSUS² |
|
|
|
|
RELATIVE TSR RSUS³ |
|
| |
|
FY2017
(US$) |
|
|
FY2018
(US$) |
|
|
FY2019
(US$) |
|
|
FY2020
(US$) |
|
|
|
|
FY2017
(US$) |
|
|
FY2018
(US$) |
|
|
FY2019
(US$) |
|
|
FY2020
(US$) |
|
|
|
|
FY2017
(US$) |
|
|
FY2018
(US$) |
|
|
FY2019
(US$) |
|
|
FY2020
(US$) |
|
| L Gries |
|
|
410,845 |
|
|
|
765,094 |
|
|
|
765,094 |
|
|
|
354,249 |
|
|
|
|
|
273,885 |
|
|
|
510,040 |
|
|
|
510,040 |
|
|
|
236,156 |
|
|
|
|
|
417,880 |
|
|
|
778,195 |
|
|
|
778,195 |
|
|
|
360,315 |
|
| M Marsh |
|
|
123,251 |
|
|
|
229,524 |
|
|
|
229,524 |
|
|
|
106,273 |
|
|
|
|
|
82,166 |
|
|
|
153,013 |
|
|
|
153,013 |
|
|
|
70,847 |
|
|
|
|
|
125,365 |
|
|
|
233,460 |
|
|
|
233,460 |
|
|
|
108,095 |
|
| M Fisher4 |
|
|
66,762 |
|
|
|
– |
|
|
|
– |
|
|
|
– |
|
|
|
|
|
44,507 |
|
|
|
– |
|
|
|
– |
|
|
|
– |
|
|
|
|
|
67,906 |
|
|
|
– |
|
|
|
– |
|
|
|
– |
|
| S Gadd |
|
|
66,762 |
|
|
|
124,327 |
|
|
|
124,327 |
|
|
|
57,565 |
|
|
|
|
|
44,507 |
|
|
|
82,882 |
|
|
|
82,882 |
|
|
|
38,376 |
|
|
|
|
|
67,906 |
|
|
|
126,457 |
|
|
|
126,457 |
|
|
|
58,551 |
|
| J Blasko |
|
|
46,219 |
|
|
|
86,072 |
|
|
|
86,072 |
|
|
|
39,852 |
|
|
|
|
|
30,811 |
|
|
|
57,378 |
|
|
|
57,378 |
|
|
|
26,567 |
|
|
|
|
|
47,012 |
|
|
|
87,547 |
|
|
|
87,547 |
|
|
|
40,536 |
|
| |
|
|
713,839 |
|
|
|
1,205,017 |
|
|
|
1,205,017 |
|
|
|
557,939 |
|
|
|
|
|
475,876 |
|
|
|
803,313 |
|
|
|
803,313 |
|
|
|
371,946 |
|
|
|
|
|
726,069 |
|
|
|
1,225,659 |
|
|
|
1,225,659 |
|
|
|
567,497 |
|
| 1 |
Represents annual SG&A expense for Scorecard LTI granted in September 2016. The fair value of each award is adjusted for changes in our common stock price at each balance sheet date until the final Scorecard rating
is applied in September 2019, at which time the final value is based on our share price and the Senior Executive Officers Scorecard rating at the time of vesting. |
| 2 |
Represents annual SG&A expense for the ROCE RSUs granted in September 2016. The fair value of each RSU is adjusted for changes in our common stock price at each balance sheet date until September 2019 when ROCE
results are known and the Remuneration Committee makes a determination on the amount of negative discretion to be applied and some, all or none of the awards become vested. |
| 3 |
Represents annual SG&A expense for the Relative TSR RSUs granted in September 2016 with fair market value estimated using the Monte Carlo option-pricing method. |
| 4 |
Mr Fisher resigned from the Company effetive 3 April 2017. |
18
OUTSTANDING EQUITY AWARDS HELD BY SENIOR EXECUTIVE OFFICERS
The following tables set forth information regarding outstanding equity awards held by our Senior Executive Officers as of 30 April 2017.
Options
As at 30 April 2017, no Senior Executive Officers held stock
options.
Restricted Stock Units
|
|
|
|
|
|
|
|
|
|
|
|
|
|
|
|
|
|
|
|
|
|
|
|
|
|
|
|
|
| NAME |
|
GRANT
DATE |
|
RELEASE
DATE |
|
HOLDING AND
UNVESTED
AT 1 APRIL
2016 |
|
GRANTED |
|
TOTAL
VALUE AT
GRANT1
(US$) |
|
|
VESTED |
|
|
LAPSED |
|
|
HOLDING
AND
UNVESTED
AT 30 APRIL
2017 |
|
|
FAIR VALUE
PER
RSU2
(US$) |
|
| L Gries |
|
15-Sep-113 |
|
15-Sep-14 |
|
282,988 |
|
606,852 |
|
|
$2,500,291 |
|
|
|
(125,230) |
|
|
|
(157,758) |
|
|
|
– |
|
|
|
$4.1201 |
|
|
|
14-Sep-123 |
|
14-Sep-15 |
|
62,959 |
|
273,732 |
|
|
$2,041,356 |
|
|
|
(62,959) |
|
|
|
– |
|
|
|
– |
|
|
|
$7.4575 |
|
|
|
16-Sep-133 |
|
16-Sep-16 |
|
295,824 |
|
295,824 |
|
|
$1,994,593 |
|
|
|
(295,824) |
|
|
|
– |
|
|
|
– |
|
|
|
$6.7425 |
|
|
|
16-Sep-134 |
|
16-Sep-16 |
|
278,393 |
|
278,393 |
|
|
$2,640,140 |
|
|
|
(180,955) |
|
|
|
(97,438) |
|
|
|
– |
|
|
|
$9.4835 |
|
|
|
16-Sep-143,5 |
|
16-Sep-17 |
|
260,346 |
|
260,346 |
|
|
$1,883,812 |
|
|
|
– |
|
|
|
– |
|
|
|
260,346 |
|
|
|
$7.2358 |
|
|
|
16-Sep-144 |
|
16-Sep-17 |
|
232,980 |
|
232,980 |
|
|
$2,607,442 |
|
|
|
– |
|
|
|
– |
|
|
|
232,980 |
|
|
|
$11.1917 |
|
|
|
16-Sep-153 |
|
16-Sep-18 |
|
292,514 |
|
292,514 |
|
|
$2,448,459 |
|
|
|
– |
|
|
|
– |
|
|
|
292,514 |
|
|
|
$8.3704 |
|
|
|
16-Sep-154 |
|
16-Sep-18 |
|
254,480 |
|
254,480 |
|
|
$3,227,875 |
|
|
|
– |
|
|
|
– |
|
|
|
254,480 |
|
|
|
$12.6842 |
|
|
|
16-Sep-163 |
|
16-Sep-19 |
|
– |
|
218,159 |
|
|
$2,334,585 |
|
|
|
– |
|
|
|
– |
|
|
|
218,159 |
|
|
|
$10.7013 |
|
| |
|
16-Sep-164 |
|
16-Sep-19 |
|
– |
|
194,626 |
|
|
$3,045,566 |
|
|
|
– |
|
|
|
– |
|
|
|
194,626 |
|
|
|
$15.6483 |
|
| M Marsh |
|
16-Sep-133 |
|
16-Sep-16 |
|
33,400 |
|
33,400 |
|
|
$225,200 |
|
|
|
(33,400) |
|
|
|
– |
|
|
|
– |
|
|
|
$6.7425 |
|
|
|
16-Sep-134 |
|
16-Sep-16 |
|
31,431 |
|
31,431 |
|
|
$298,076 |
|
|
|
(20,430) |
|
|
|
(11,001) |
|
|
|
– |
|
|
|
$9.4835 |
|
|
|
16-Sep-136 |
|
16-Sep-16 |
|
56,128 |
|
56,128 |
|
|
$482,734 |
|
|
|
(56,128) |
|
|
|
– |
|
|
|
– |
|
|
|
$8.6006 |
|
|
|
16-Sep-143 |
|
16-Sep-17 |
|
38,787 |
|
38,787 |
|
|
$280,655 |
|
|
|
– |
|
|
|
– |
|
|
|
38,787 |
|
|
|
$7.2358 |
|
|
|
16-Sep-144 |
|
16-Sep-17 |
|
33,283 |
|
33,283 |
|
|
$372,493 |
|
|
|
– |
|
|
|
– |
|
|
|
33,283 |
|
|
|
$11.1917 |
|
|
|
16-Sep-153 |
|
16-Sep-18 |
|
65,816 |
|
65,816 |
|
|
$550,906 |
|
|
|
– |
|
|
|
– |
|
|
|
65,816 |
|
|
|
$8.3704 |
|
|
|
16-Sep-154 |
|
16-Sep-18 |
|
57,258 |
|
57,258 |
|
|
$726,272 |
|
|
|
– |
|
|
|
– |
|
|
|
57,258 |
|
|
|
$12.6842 |
|
|
|
16-Sep-163 |
|
16-Sep-19 |
|
– |
|
65,448 |
|
|
$700,379 |
|
|
|
– |
|
|
|
– |
|
|
|
65,448 |
|
|
|
$10.7013 |
|
| |
|
16-Sep-164 |
|
16-Sep-19 |
|
– |
|
58,388 |
|
|
$913,673 |
|
|
|
– |
|
|
|
– |
|
|
|
58,388 |
|
|
|
$15.6483 |
|
| M Fisher7 |
|
15-Sep-113 |
|
15-Sep-14 |
|
31,951 |
|
68,516 |
|
|
$282,293 |
|
|
|
(14,139) |
|
|
|
(17,812) |
|
|
|
– |
|
|
|
$4.1201 |
|
|
|
14-Sep-123 |
|
14-Sep-15 |
|
7,109 |
|
30,905 |
|
|
$230,474 |
|
|
|
(7,109) |
|
|
|
– |
|
|
|
– |
|
|
|
$7.4575 |
|
|
|
16-Sep-134 |
|
16-Sep-16 |
|
33,400 |
|
33,400 |
|
|
$225,200 |
|
|
|
(33,400) |
|
|
|
– |
|
|
|
– |
|
|
|
$6.7425 |
|
|
|
16-Sep-134 |
|
16-Sep-16 |
|
31,431 |
|
31,431 |
|
|
$298,076 |
|
|
|
(20,430) |
|
|
|
(11,001) |
|
|
|
– |
|
|
|
$9.4835 |
|
|
|
16-Sep-143 |
|
16-Sep-17 |
|
38,787 |
|
38,787 |
|
|
$280,655 |
|
|
|
– |
|
|
|
(5,875) |
|
|
|
32,912 |
|
|
|
$7.2358 |
|
|
|
16-Sep-144 |
|
16-Sep-17 |
|
33,283 |
|
33,283 |
|
|
$372,493 |
|
|
|
– |
|
|
|
(5,042) |
|
|
|
28,241 |
|
|
|
$11.1917 |
|
|
|
16-Sep-153 |
|
16-Sep-18 |
|
47,533 |
|
47,533 |
|
|
$397,870 |
|
|
|
– |
|
|
|
(23,030) |
|
|
|
24,503 |
|
|
|
$8.3704 |
|
|
|
16-Sep-154 |
|
16-Sep-18 |
|
41,353 |
|
41,353 |
|
|
$524,530 |
|
|
|
– |
|
|
|
(20,036) |
|
|
|
21,317 |
|
|
|
$12.6842 |
|
|
|
16-Sep-163 |
|
16-Sep-19 |
|
– |
|
35,451 |
|
|
$379,372 |
|
|
|
– |
|
|
|
(35,451) |
|
|
|
– |
|
|
|
$10.7013 |
|
| |
|
16-Sep-164 |
|
16-Sep-19 |
|
– |
|
31,627 |
|
|
$494,909 |
|
|
|
– |
|
|
|
(31,627) |
|
|
|
– |
|
|
|
$15.6483 |
|
| S Gadd |
|
15-Sep-113 |
|
15-Sep-14 |
|
7,304 |
|
15,661 |
|
|
$64,525 |
|
|
|
(3,232) |
|
|
|
(4,072) |
|
|
|
– |
|
|
|
$4.1201 |
|
|
|
14-Sep-123 |
|
14-Sep-15 |
|
1,625 |
|
7,064 |
|
|
$52,680 |
|
|
|
(1,625) |
|
|
|
– |
|
|
|
– |
|
|
|
$7.4575 |
|
|
|
16-Sep-134 |
|
16-Sep-16 |
|
23,857 |
|
23,857 |
|
|
$160,856 |
|
|
|
(23,857) |
|
|
|
– |
|
|
|
– |
|
|
|
$6.7425 |
|
|
|
16-Sep-134 |
|
16-Sep-16 |
|
22,451 |
|
22,451 |
|
|
$212,914 |
|
|
|
(14,593) |
|
|
|
(7,858) |
|
|
|
– |
|
|
|
$9.4835 |
|
|
|
16-Sep-143 |
|
16-Sep-17 |
|
38,787 |
|
38,787 |
|
|
$280,655 |
|
|
|
– |
|
|
|
– |
|
|
|
38,787 |
|
|
|
$7.2358 |
|
|
|
16-Sep-144 |
|
16-Sep-17 |
|
33,283 |
|
33,283 |
|
|
$372,493 |
|
|
|
– |
|
|
|
– |
|
|
|
33,283 |
|
|
|
$11.1917 |
|
|
|
16-Sep-153 |
|
16-Sep-18 |
|
47,533 |
|
47,533 |
|
|
$397,870 |
|
|
|
– |
|
|
|
– |
|
|
|
47,533 |
|
|
|
$8.3704 |
|
|
|
16-Sep-154 |
|
16-Sep-18 |
|
41,353 |
|
41,353 |
|
|
$524,530 |
|
|
|
– |
|
|
|
– |
|
|
|
41,353 |
|
|
|
$12.6842 |
|
|
|
16-Sep-163 |
|
16-Sep-19 |
|
– |
|
35,451 |
|
|
$379,372 |
|
|
|
– |
|
|
|
– |
|
|
|
35,451 |
|
|
|
$10.7013 |
|
| |
|
16-Sep-164 |
|
16-Sep-19 |
|
– |
|
31,627 |
|
|
$494,909 |
|
|
|
– |
|
|
|
– |
|
|
|
31,627 |
|
|
|
$15.6483 |
|
| J Blasko |
|
14-Sep-123 |
|
14-Sep-15 |
|
5,078 |
|
22,075 |
|
|
$164,624 |
|
|
|
(5,078) |
|
|
|
– |
|
|
|
– |
|
|
|
$7.4575 |
|
|
|
16-Sep-133 |
|
16-Sep-16 |
|
23,857 |
|
23,857 |
|
|
$160,856 |
|
|
|
(23,857) |
|
|
|
– |
|
|
|
– |
|
|
|
$6.7425 |
|
|
|
16-Sep-134 |
|
16-Sep-16 |
|
22,451 |
|
22,451 |
|
|
$212,914 |
|
|
|
(14,593) |
|
|
|
(7,858) |
|
|
|
– |
|
|
|
$9.4835 |
|
|
|
16-Sep-143 |
|
16-Sep-17 |
|
23,272 |
|
23,272 |
|
|
$168,392 |
|
|
|
– |
|
|
|
– |
|
|
|
23,272 |
|
|
|
$7.2358 |
|
|
|
16-Sep-144 |
|
16-Sep-17 |
|
19,970 |
|
19,970 |
|
|
$223,498 |
|
|
|
– |
|
|
|
– |
|
|
|
19,970 |
|
|
|
$11.1917 |
|
|
|
16-Sep-153 |
|
16-Sep-18 |
|
29,251 |
|
29,251 |
|
|
$244,843 |
|
|
|
– |
|
|
|
– |
|
|
|
29,251 |
|
|
|
$8.3704 |
|
|
|
16-Sep-154 |
|
16-Sep-18 |
|
25,448 |
|
25,448 |
|
|
$322,788 |
|
|
|
– |
|
|
|
– |
|
|
|
25,448 |
|
|
|
$12.6842 |
|
|
|
16-Sep-163 |
|
16-Sep-19 |
|
– |
|
24,543 |
|
|
$262,642 |
|
|
|
– |
|
|
|
– |
|
|
|
24,543 |
|
|
|
$10.7013 |
|
| |
|
16-Sep-164 |
|
16-Sep-19 |
|
– |
|
21,895 |
|
|
$342,620 |
|
|
|
– |
|
|
|
– |
|
|
|
21,895 |
|
|
|
$15.6483 |
|
| 1 |
Total Value at Grant = Fair Value per RSU multiplied by number of units granted. |
| 2 |
Fair Value per RSU is estimated on the date of grant using a binomial lattice model that incorporates a Monte Carlo simulation for Relative TSR RSUs. For ROCE RSUs, the grant date fair value is our stock price on the
date of grant. For service vesting RSUs, the fair value is our stock price on the date of grant, adjusted for the fair value of estimated dividends as the RSU holder is not entitled to dividends over the vesting period. |
| 3 |
Relative TSR RSUs granted under the LTIP. These RSUs are subject to performance hurdles. |
| 4 |
ROCE RSUs granted under the LTIP. These RSUs are subject to performance hurdles and/or application of negative discretion. |
| 5 |
Mr Gries was also granted a cash-settled award (equivalent to 11,164 units) on 16 September 2014. This cash-settled award may vest based on the same vesting criteria as his relative TSR RSU grant and may only vest
in the event that his relative TSR RSU grant vests in full. Upon vesting, the award will be settled in cash based on the number of units vested and the fair market value of our shares of common stock as of the relevant vesting date.
|
| 6 |
Time vested RSUs granted under the 2001 JHI plc Equity Incentive Plan. |
| 7 |
Mr Fisher resigned from the Company effective 3 April 2017. Lapsed awards reflect forfeitures pursuant to the terms of his separation agreement. |
19
JAMES HARDIE REMUNERATION REPORT
2017
REMUNERATION REPORT 2017 CONTINUED
Scorecard LTI
|
|
|
|
|
|
|
|
|
|
|
|
|
|
|
|
|
|
|
|
|
|
|
|
|
| NAME |
|
GRANT DATE |
|
RELEASE
DATE |
|
HOLDING AT
1 APRIL 2016 |
|
|
GRANTED |
|
|
VESTED1 |
|
|
LAPSED |
|
|
HOLDING AT
30 APRIL 2017 |
|
| L Gries |
|
16-Sep-13 |
|
16-Sep-16 |
|
|
313,192 |
|
|
|
313,192 |
|
|
|
(216,102) |
|
|
|
(97,090) |
|
|
|
– |
|
|
|
16-Sep-142 |
|
16-Sep-17 |
|
|
262,103 |
|
|
|
262,103 |
|
|
|
– |
|
|
|
– |
|
|
|
262,103 |
|
|
|
16-Sep-15 |
|
16-Sep-18 |
|
|
286,290 |
|
|
|
286,290 |
|
|
|
– |
|
|
|
– |
|
|
|
286,290 |
|
| |
|
16-Sep-16 |
|
16-Sep-19 |
|
|
– |
|
|
|
218,954 |
|
|
|
– |
|
|
|
– |
|
|
|
218,954 |
|
| M Marsh |
|
16-Sep-13 |
|
16-Sep-16 |
|
|
35,360 |
|
|
|
35,360 |
|
|
|
(24,398) |
|
|
|
(10,962) |
|
|
|
– |
|
|
|
16-Sep-142 |
|
16-Sep-17 |
|
|
37,443 |
|
|
|
37,443 |
|
|
|
– |
|
|
|
– |
|
|
|
37,443 |
|
|
|
16-Sep-15 |
|
16-Sep-18 |
|
|
64,415 |
|
|
|
64,415 |
|
|
|
– |
|
|
|
– |
|
|
|
64,415 |
|
| |
|
16-Sep-16 |
|
16-Sep-19 |
|
|
– |
|
|
|
65,686 |
|
|
|
– |
|
|
|
– |
|
|
|
65,686 |
|
| M Fisher3 |
|
16-Sep-13 |
|
16-Sep-16 |
|
|
35,360 |
|
|
|
35,360 |
|
|
|
(20,508) |
|
|
|
(14,852) |
|
|
|
– |
|
|
|
16-Sep-142 |
|
16-Sep-17 |
|
|
37,443 |
|
|
|
37,443 |
|
|
|
– |
|
|
|
(5,672) |
|
|
|
31,771 |
|
|
|
16-Sep-15 |
|
16-Sep-18 |
|
|
46,522 |
|
|
|
46,522 |
|
|
|
– |
|
|
|
(22,540) |
|
|
|
23,982 |
|
| |
|
16-Sep-16 |
|
16-Sep-19 |
|
|
– |
|
|
|
35,580 |
|
|
|
– |
|
|
|
(35,580) |
|
|
|
– |
|
| S Gadd |
|
16-Sep-13 |
|
16-Sep-16 |
|
|
25,257 |
|
|
|
25,257 |
|
|
|
(10,860) |
|
|
|
(14,397) |
|
|
|
– |
|
|
|
16-Sep-142 |
|
16-Sep-17 |
|
|
37,443 |
|
|
|
37,443 |
|
|
|
– |
|
|
|
– |
|
|
|
37,443 |
|
|
|
16-Sep-15 |
|
16-Sep-18 |
|
|
46,522 |
|
|
|
46,522 |
|
|
|
– |
|
|
|
– |
|
|
|
46,522 |
|
| |
|
16-Sep-16 |
|
16-Sep-19 |
|
|
– |
|
|
|
35,580 |
|
|
|
– |
|
|
|
– |
|
|
|
35,580 |
|
| J Blasko |
|
16-Sep-13 |
|
16-Sep-16 |
|
|
25,257 |
|
|
|
25,257 |
|
|
|
(14,649) |
|
|
|
(10,608) |
|
|
|
– |
|
|
|
16-Sep-142 |
|
16-Sep-17 |
|
|
22,466 |
|
|
|
22,466 |
|
|
|
– |
|
|
|
– |
|
|
|
22,466 |
|
|
|
16-Sep-15 |
|
16-Sep-18 |
|
|
28,629 |
|
|
|
28,629 |
|
|
|
– |
|
|
|
– |
|
|
|
28,629 |
|
| |
|
16-Sep-16 |
|
16-Sep-19 |
|
|
– |
|
|
|
24,632 |
|
|
|
– |
|
|
|
– |
|
|
|
24,632 |
|
| 1 |
Represents the number of Scorecard LTI awards vesting after the Remuneration Committee’s application of the Scorecard in respect of fiscal years 2014-2016. A detailed assessment of the reasons for the Scorecard
ratings was set out in the fiscal year 2016 Remuneration Report. |
| 2 |
Scorecard LTI awards in respect of fiscal years 2015-2017 will vest on 16 September 2017. A detailed assessment of the Remuneration Committee’s assessment of management’s performance is set out on pages
12 and 13 of this Remuneration Report. |
| 3 |
Mr Fisher resigned from the Company effective 3 April 2017. Lapsed awards reflect forfeitures pursuant to the terms of his separation agreement. |
REMUNERATION FOR NON-EXECUTIVE DIRECTORS
Fees
paid to non-executive directors are determined by the Board, with the advice of the Remuneration Committee’s independent external remuneration advisers, within the maximum total amount of base and committee fees pool approved by shareholders
from time-to-time. Shareholders at the 2014 AGM approved the current maximum aggregate base and committee fee pool of US$2.3 million per annum. No additional Board fees are paid to executive directors.
Remuneration Structure
Non-executive directors are paid a base fee for
service on the Board. Additional fees are paid to the person occupying the positions of Chairman and Board Committee Chairman (and had been paid to the Deputy Chairman prior to his retirement), as well as for attendance at ad-hoc sub-committee
meetings.
During fiscal year 2017, the Remuneration Committee reviewed non-executive directors’ fees, using market data and taking into consideration the level
of fees paid to chairmen and directors of companies with similar size, complexity of operations and responsibilities and workload requirements. The Remuneration Committee recommended an increase in the non-executive director base fee for calendar
year 2017 and the fee increase was effective from the start of the calendar year. The annual fee adjustment when calculated on a fiscal year basis equates to a 2.6% increase in base fee.
|
|
|
|
|
|
|
|
|
| POSITION |
|
FISCAL
YEAR 2017
(US$) |
|
|
FISCAL
YEAR 2018
(US$) |
|
| Chairman |
|
|
404,066 |
|
|
|
408,984 |
|
| Board member |
|
|
189,006 |
|
|
|
193,924 |
|
| Audit Committee Chair |
|
|
20,000 |
|
|
|
20,000 |
|
| Remuneration Committee Chair |
|
|
20,000 |
|
|
|
20,000 |
|
| Nominating & Governance Committee Chair |
|
|
20,000 |
|
|
|
20,000 |
|
| Ad-hoc Board sub-committee attendance1 |
|
|
3,000 |
|
|
|
3,000 |
|
| 1 |
Fee is payable in respect of each ad-hoc Board sub-committee meeting attended. |
During fiscal year 2016, the Remuneration
Committee approved a non-executive director tax equalisation policy, in order to ensure that the Company continues to attract highly qualified persons to serve on the Board irrespective of their tax residence. In accordance with the policy, the
Company will ensure that each non-executive director does not have an increased income tax liability as a direct result of their appointment to the Board. Accordingly, if Irish income taxes levied on their director compensation exceed net income
taxes owed on such compensation in their country of tax residence, assuming it had been derived solely in their country of tax residence, such director is eligible to receive a tax equalisation payment in respect of that excess.
As the focus of the Board is on maintaining the Company’s long-term direction and well-being, there is no direct link between non-executive directors’
remuneration and the Company’s short-term results.
20
Board Accumulation Guidelines
Non-executive directors are encouraged to accumulate a minimum of 1.5 times (and two times for the Chairman) the non-executive director base fee in shares of the
Company’s common stock (either personally, in the name of their spouse, or through a personal superannuation or pension plan). The Remuneration Committee reviews the guidelines and non-executive directors’ shareholdings on a periodic
basis.
Director Retirement Benefits
We do not provide any benefits for
our non-executive directors upon termination of their service on the Board.
Total Remuneration for Non-Executive Directors for the Years Ended 31 March
2017 and 2016
The table below sets out the remuneration for those non-executive directors who served on the Board during the fiscal years ended
31 March 2017 and 2016:
|
|
|
|
|
|
|
|
|
|
|
|
|
|
|
|
|
| NAME |
|
PRIMARY
DIRECTORS’
FEES1 (US$) |
|
|
OTHER
PAYMENTS2
(US$) |
|
|
OTHER
BENEFITS3
(US$) |
|
|
TOTAL
(US$) |
|
| M Hammes |
|
|
|
|
|
|
|
|
|
|
|
|
|
|
|
|
| Fiscal Year 2017 |
|
|
410,065 |
|
|
|
– |
|
|
|
28,142 |
|
|
|
438,207 |
|
| Fiscal Year 2016 |
|
|
473,984 |
|
|
|
96,047 |
|
|
|
16,740 |
|
|
|
586,771 |
|
| D McGauchie |
|
|
|
|
|
|
|
|
|
|
|
|
|
|
|
|
| Fiscal Year 2017 |
|
|
151,610 |
|
|
|
– |
|
|
|
21,882 |
|
|
|
173,492 |
|
| Fiscal Year 2016 |
|
|
232,922 |
|
|
|
– |
|
|
|
15,741 |
|
|
|
248,663 |
|
| B Anderson |
|
|
|
|
|
|
|
|
|
|
|
|
|
|
|
|
| Fiscal Year 2017 |
|
|
215,005 |
|
|
|
– |
|
|
|
8,906 |
|
|
|
223,911 |
|
| Fiscal Year 2016 |
|
|
244,935 |
|
|
|
72,605 |
|
|
|
– |
|
|
|
317,540 |
|
| D Harrison |
|
|
|
|
|
|
|
|
|
|
|
|
|
|
|
|
| Fiscal Year 2017 |
|
|
209,005 |
|
|
|
– |
|
|
|
10,324 |
|
|
|
219,329 |
|
| Fiscal Year 2016 |
|
|
238,934 |
|
|
|
49,308 |
|
|
|
7,307 |
|
|
|
295,549 |
|
| A Littley |
|
|
|
|
|
|
|
|
|
|
|
|
|
|
|
|
| Fiscal Year 2017 |
|
|
195,005 |
|
|
|
– |
|
|
|
16,030 |
|
|
|
211,035 |
|
| Fiscal Year 2016 |
|
|
179,184 |
|
|
|
– |
|
|
|
– |
|
|
|
179,184 |
|
| J Osborne |
|
|
|
|
|
|
|
|
|
|
|
|
|
|
|
|
| Fiscal Year 2017 |
|
|
201,005 |
|
|
|
– |
|
|
|
– |
|
|
|
201,005 |
|
| Fiscal Year 2016 |
|
|
179,184 |
|
|
|
– |
|
|
|
– |
|
|
|
179,184 |
|
| R van der Meer |
|
|
|
|
|
|
|
|
|
|
|
|
|
|
|
|
| Fiscal Year 2017 |
|
|
209,005 |
|
|
|
– |
|
|
|
1,531 |
|
|
|
210,536 |
|
| Fiscal Year 2016 |
|
|
188,847 |
|
|
|
– |
|
|
|
– |
|
|
|
188,847 |
|
| R Chenu4 |
|
|
|
|
|
|
|
|
|
|
|
|
|
|
|
|
| Fiscal Year 2017 |
|
|
195,005 |
|
|
|
– |
|
|
|
4,390 |
|
|
|
199,395 |
|
| Fiscal Year 2016 |
|
|
170,184 |
|
|
|
– |
|
|
|
– |
|
|
|
170,184 |
|
| A Gisle Joosen |
|
|
|
|
|
|
|
|
|
|
|
|
|
|
|
|
| Fiscal Year 2017 |
|
|
189,005 |
|
|
|
– |
|
|
|
1,406 |
|
|
|
190,411 |
|
| Fiscal Year 2016 |
|
|
173,184 |
|
|
|
– |
|
|
|
– |
|
|
|
173,184 |
|
| Total Compensation for Non-Executive Directors |
|
|
|
|
|
|
|
|
|
|
|
|
|
|
|
|
| Fiscal Year 2017 |
|
|
1,974,710 |
|
|
|
– |
|
|
|
92,611 |
|
|
|
2,067,321 |
|
| Fiscal Year 2016 |
|
|
2,081,358 |
|
|
|
217,960 |
|
|
|
39,788 |
|
|
|
2,339,106 |
|
| 1 |
Amount includes base, Chairman, Deputy Chairman, Committee Chairman fees, as well as fees for attendance at ad-hoc sub-committee meetings. |
| 2 |
Amount relates to a one-off payment to partially compensate non-executive directors who have received a reduction in net compensation following the Company’s re-domicile from the Netherlands to Ireland. The impact
of the re-domicile meant that US based non-executive directors incurred an increased income tax burden since the Irish tax rate is significantly higher than the US tax rate. |
| 3 |
Amount includes the cost of non-executive directors’ fiscal compliance in Ireland and other costs connected with Board-related events paid for by the Company and Company product received in accordance with the
Policy on Products for Friends and Family. In addition to these costs, travel and subsistence expenses incurred by non-executive directors in attending board meetings held in Ireland which are paid or reimbursed by the Company have, pursuant to a
direction from the Irish Revenue Commissioners effective from February 2014, been grossed up and subjected to Irish income taxes. The aggregate cost to the Company, including income taxes, for these costs in fiscal year 2016 was US$282,789. Irish
tax legislation was enacted with effect from January 2016 that specifically exempts travel and subsistence expenses incurred by non-executive directors in attending board meetings from Irish income taxes. |
| 4 |
In addition to the compensation set forth above, Mr Chenu continues to receive certain tax services from the Company, and remains eligible for certain tax equalisation benefits relative to the vesting of previously
granted equity awards, stemming from his prior service as an executive officer of the Company. |
21
JAMES HARDIE REMUNERATION REPORT
2017
REMUNERATION REPORT 2017 CONTINUED
Director Remuneration for the Years Ended 31 March 2017 and 2016
For Irish reporting purposes, the breakdown of director’s remuneration between managerial services (which only relate to Mr Gries) and director services is:
|
|
|
|
|
|
|
|
|
| |
|
YEARS ENDED 31 MARCH |
|
| |
|
2017
(US$) |
|
|
2016
(US$) |
|
| Managerial Services1 |
|
|
9,828,569 |
|
|
|
10,866,287 |
|
| Director Services2 |
|
|
2,256,327 |
|
|
|
2,792,080 |
|
| |
|
|
12,084,896 |
|
|
|
13,658,367 |
|
| 1 |
Includes cash payments, non-cash benefits (examples include medical and life insurance benefits, car allowances, membership in executive wellness programs, financial planning and tax services), 401(k) benefits, and
amounts expensed for outstanding equity awards for L Gries. |
| 2 |
Includes compensation for all non-executive directors, which includes base, Chairman, former Deputy Chairman, Committee Chairman and cost of non-employee directors’ fiscal compliance in Ireland, and Company product
received in accordance with the employee program as well as other costs connected with Board-related events paid for by the Company. It includes travel and subsistence expenses incurred by non-executive directors in attending board meetings held in
Ireland paid or reimbursed by the Company which have, pursuant to a direction from the Irish Revenue Commissioners effective from February 2014, been grossed up and subjected to Irish income taxes and a proportion of the CEO’s remuneration paid
as fees for his service on the JHI plc Board in fiscal years 2017 and 2016. New Irish tax legislation was enacted with effect from January 2016 that specifically exempts travel and subsistence expenses incurred by non-executive directors in
attending board meetings from Irish income taxes. |
Share Ownership and Stock Based
Compensation Arrangements
As of 30 April 2017 and 30 April 2016,
the number of CUFS and RSUs beneficially owned by Senior Executive Officers is set forth below:
|
|
|
|
|
|
|
|
|
| NAME |
|
CUFS AT 30
APRIL 2017 |
|
CUFS AT 30
APRIL 2016 |
|
RSUs AT 30
APRIL 2017 |
|
RSUs AT 30
APRIL 2016 |
| L Gries |
|
404,038 |
|
454,334 |
|
1,453,105 |
|
1,960,484 |
| M Marsh |
|
59,557 |
|
– |
|
318,980 |
|
316,103 |
| M Fisher |
|
78,698 |
|
91,767 |
|
106,973 |
|
264,847 |
| J Blasko |
|
32,803 |
|
18,917 |
|
144,379 |
|
149,327 |
| S Gadd |
|
36,407 |
|
– |
|
228,034 |
|
216,193 |
As of 30 April 2017 and 30 April 2016, the number of CUFS beneficially owned by non-executive directors is set
forth below:
|
|
|
|
|
|
|
|
|
| NAME |
|
CUFS AT
30 APRIL 2017 |
|
|
CUFS AT
30 APRIL 2016 |
|
| M
Hammes1 |
|
|
44,109 |
|
|
|
44,109 |
|
| D
McGauchie2 |
|
|
8,372 |
|
|
|
8,372 |
|
| B
Anderson3 |
|
|
18,920 |
|
|
|
18,920 |
|
| R Chenu |
|
|
105,518 |
|
|
|
93,712 |
|
| A Gisle Joosen |
|
|
2,480 |
|
|
|
1,000 |
|
| D
Harrison4 |
|
|
19,259 |
|
|
|
19,259 |
|
| A
Littley5 |
|
|
2,045 |
|
|
|
2,045 |
|
| J
Osborne6 |
|
|
22,551 |
|
|
|
11,951 |
|
| R van der Meer |
|
|
17,290 |
|
|
|
17,290 |
|
| 1 |
35,109 CUFS held in the name of Mr and Mrs Hammes and 9,000 CUFS held as American Depositary Shares (“ADSs”) in the name of Mr and Mrs Hammes. |
| 2 |
Resigned from the Board on 11 August 2016. |
| 3 |
7,635 CUFS held in the name of Mr Anderson, 390 CUFS held as ADSs in the name of Mr Anderson and 10,895 CUFS held as ADSs in the name of Mr and Mrs Anderson. |
| 4 |
2,384 CUFS held in the name of Mr Harrison, 1,000 CUFS held as ADSs in the name of Mr Harrison and 15,875 CUFS held as ADSs in the name of Mr and Mrs Harrison. |
| 5 |
2,045 CUFS held as ADSs in the name of Ms Littley. |
| 6 |
2,551 CUFS held in the name of Mr Osborne and 20,000 CUFS held in the name of Aurum Nominees Limited and held on behalf of Mr Osborne as beneficial owner. |
Based on 440,859,888 shares of common stock outstanding at 30 April 2017 (all of which are subject to CUFS), no director or Senior Executive Officer beneficially
owned 1% or more of the outstanding shares of the Company at 30 April 2017 and none of the shares held by directors or Senior Executive Officers have any special voting rights. As of 30 April 2017, there were no options outstanding to
directors or Senior Executive Officers under any of the Company’s stock-based compensation arrangements. Individual’s holding RSUs have no voting or investment power over these units.
MORE DETAILED INFORMATION ABOUT EQUITY GRANTS
More detailed information about our equity grants and equity plans can be found in our 2017 Annual Report in both the Remuneration section as well as Note 15 to our
consolidated financial statements.
22
Designed and produced by ArmstrongQ
armstrongQ.com.au